
 ?Mathematical formulae have been encoded as MathML and are displayed in this HTML version using MathJax in order to improve their display. Uncheck the box to turn MathJax off. This feature requires Javascript. Click on a formula to zoom.
ABSTRACT
Neutron flux per pulse reached world record at neutron source in Japan Proton Accelerator Research Complex (J-PARC). In the J-PARC, mercury target system is used as a spallation neutron source. A target vessel has a multi-walled protection system that comprises a mercury vessel enclosed with a double-walled water shroud. This is to prevent the leakage of the mercury outside the target vessel. The multi-walled structure needed to be complicated with a lot of welding lines. However, during the operation, we faced an unscheduled shutdown due to water leakage to the intermediate layer between the mercury vessel and water shroud. An investigation on the cause of the leakage was carried out. It is deduced that the leakage path was formed due to the crack propagation from welding defects that are caused by the complicated multi-walled structure. The crack propagation is attributed to the repeated stress by pressure waves generated in the mercury target. Based on the investigation results, the design was improved to remove the welding line on the complicated structure and to realize the stable operation with 1 MW proton beam, which is the final design value of the neutron source in J-PARC.
1. Introduction
Mercury targets have been developed for high-power, MW-class spallation neutron source facilities such as the Spallation Neutron Source (SNS) in the Oak Ridge National Laboratory and the Materials and Life science experimental Facility (MLF) in the Japan Proton Accelerator Research Complex (J-PARC). In the MLF, a mercury target is designed to be bombarded by pulsed proton beams with a power of 1 MW. Energy of 3 GeV, frequency of 25 Hz, pulse duration of about 1 μs are the major parameters of the beam [Citation1].
Whenever the proton beam pulse is injected into the mercury target, the pressure waves that are caused by the rapid thermal energy deposition on the mercury result in an unacceptable stress on a mercury vessel. Moreover, they induce an aggressive mercury cavitation that imposes the pitting damage on the vessel wall. This is a crucial factor that determines the lifetime and acceptable power in the target [Citation2]. To overcome this issue, we injected the helium microbubbles into the flowing mercury. This was to provide the compressibility of target medium, to reduce the pressure waves, and to mitigate the aggressiveness of the mercury cavitation [Citation3–Citation5].
The mercury target vessel comprises multi-walled structures. This includes a double-walled water shroud with coolant-water channels and a mercury vessel. The double-walled water shroud was connected with the mercury vessel through several ribs to keep the sufficient stiffness enduring against the static and dynamic pressures and thermal expansion. This means that complicated structures were fabricated with a lot of welding. However, we must avoid deformation and defects due to welding during fabrication.
Meanwhile, the operation of the mercury targets started at the SNS and MLF in 2006 and 2008, respectively. Furthermore, the power of proton beams was increased step-by-step as investigating the structural integrity through the post-irradiation examination in which the pitting damages and the irradiation damages were observed [Citation6–Citation8]. However, the operations suffered a huge setback due to the mercury and water leakage that resulted in an unscheduled shutdown [Citation9,Citation10]. The occurrence of leakage is most likely dependent on the soundness of welding. We twice experienced water leakage at the MLF. We first observed that water leaked outside the vessel [Citation10]. Second, water leaked into an intermediate layer between the mercury vessel and water shroud.
To achieve the 1-MW stable operation that is capable of producing the highest neutron flux per pulse in the world, we must apply the improved design that enhances the robustness of the target vessel. Furthermore, to clarify the cause of water leakage and improve the design of the target vessel, we must carry out the cause analyses relating to the water leakage that focuses on a welding part undergoing water leakage. To investigate the weld quality, we first carried out a welding test using a mockup. Therefore, we generated a welding defect that was later evaluated. Moreover, we examined whether the cracks propagated from the defect to generate leakage path due to repeated stress imposed on the target vessel. Furthermore, to investigate the reason for the generation of the defect, we carried out a numerical simulation to obtain the temperature distribution during the welding process. Thus, we describe the results of cause analyses and the improvement of target vessel design based on the cause analyses.
2. Structure of mercury target
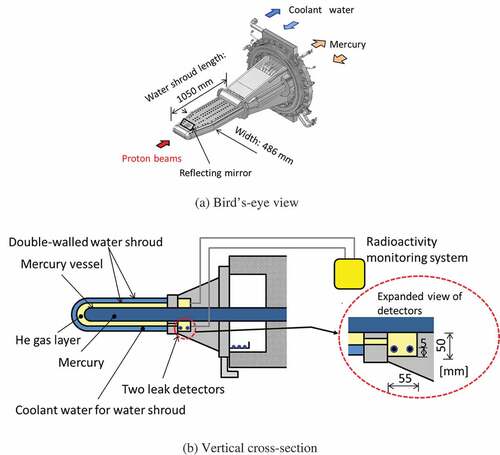
shows the schematic of the mercury target vessel with its vertical cross-section. The mercury target vessel comprises the mercury vessel and double-walled water shroud made of type 316 L stainless steel. The mercury target vessel weighs 1.6 tons and has a total length of 2 m. Moreover, the forefront part has a length of 1050 mm with the multi-walled structure. This double-walled water shroud covers the mercury vessel to confine any mercury contamination in an event of mercury leakage from the mercury vessel. Mercury flows through the mercury vessel and the coolant-water flows through the water shroud to remove the heat load from the spallation reactions in the mercury target. This amounts to 500 kW under a 1-MW beam operation [Citation11]. The intermediate space between the mercury vessel and the water shroud is filled with helium gas and its radioactivity is monitored to detect any mercury or water leak into the gas layer. Two sets of leak detectors with electrodes are also installed in the intermediate space as shown in ). The leak detector monitors a change of the electric resistance between the electrode and the mercury target vessel during operation. The electric resistance decreases whenever there is a leakage of mercury or water. To measure the displacement velocity caused by the pressure waves in the mercury vessel by using the Laser Doppler diagnostic system, a retro-reflective corner-cube mirror (hereafter called as mirror) set up on the upper side of the mercury target vessel [Citation12]. The design pressure of the mercury and the coolant-water is 0.5 MPa, while that of the helium gas is 0.2 MPa.
Figure 1. Schematic of mercury target vessel; (a) Bird’s-eye view and (b) its vertical cross-section.
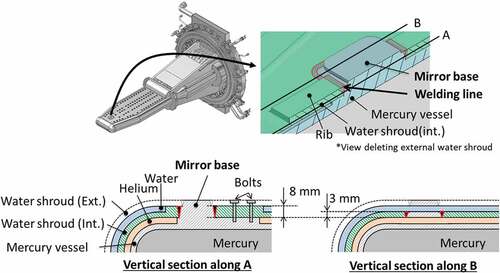
shows the welding line around the mirror base. During the fabrication of the target vessel, the mirror base was machined from the same ingot with the mercury vessel to transmit the displacement velocity that is induced by the pressure waves directly to the water shroud. After that, the mercury vessel was covered with the internal water shroud. The internal water shroud had the hole to put on the mirror base and the ribs to connect the external water shroud. The mirror base was welded with the water shroud. Finally, the external water shroud covered them and three vessels were bolted through the ribs to keep the stiffness of the target vessel against the static pressure and pressure wave. However, the total length of the welding line was about 40 m because of this complicated structure. Focusing on the welding line around the mirror base, there were a 3-mm-thickness region for the water shroud wall and an 8-mm region for rib in the water layer along one welding line, but this thickness change was steep.
Figure 2. Welding line around the mirror base.
The mercury target is contained within another large helium-filled vessel with other neutron source components such as the neutron reflector, cryogenic moderators, radiation shielding block [Citation13].
3. Detection of water leakage
During the 500-kW beam operation, both two leak detectors in the intermediate space between the mercury vessel and the water shroud were alarmed. However, with the visual observation on the outside of the water shroud, there was no water leakage. The electrical resistance between the leak detector and the target vessel was 5 kΩ, which was almost the same as that of water, while it was 2 × 10⁻⁸ Ω in the case of mercury. The radioactivity monitoring system detected no mercury-related radioactivity. Additionally, pressure in the helium layer was varied when the coolant-water layer in the water shroud was depressurized after the coolant-water was drained. From these inspection results, we concluded that coolant water leaked from inside of the water shroud to the intermediate layer between mercury vessel and water shroud.
4. Failure analyses
In the water shroud, there was a complicated structure in the welding area around the mirror base as shown in . Therefore, we investigated the soundness of welding line through the stress analysis and mockup tests.
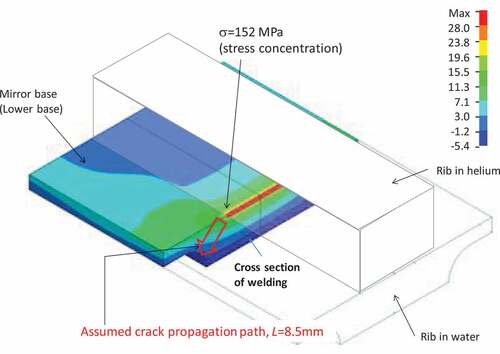
There is a possibility that pressure waves caused the high cycle fatigue crack propagation according to the welding line around the mirror base. The mercury vessel causes vibration due to the pressure waves. The measured amplitude of the vibration was 13 μm at the mirror at 500-kW beam operation. The generated stress was numerically estimated when the vertical deformation of 13 μm at the mirror base was imposed on the mercury target vessel. On the welding line, the generated peak stress became 152 MPa as a result of the stress concentration. This is attributed to the corner shape between the rib in the helium layer and the wall of the water shroud.
shows the schematic of the mockup model around the mirror base. We fabricated two mockup models to confirm the reproducibility. The same welding condition with the target vessel fabrication was applied to the two mockup models, i.e. the mirror base was welded by 2-path for a 3-mm-thickness plate and by 3-path for 8-mm-thickness-rib. During the first and second paths, a welding groove on the 3-mm-thickness plate was fulfilled. The third path was applied for only 8-mm-thickness region to fulfill the remaining groove. To adjust applied energy from the welding torch to the weld metal in unit length, E, welder changed the electrical power, P, applied to the welding torch and the speed, v, of the welding torch moving along the welding line. Although the welder adjusted the applying energy as confirming the melting condition of welding region in actual, we measured P and v. Therefore, we calculated the applied energy from the welding torch to weld metal in unit length, E, using equation below:
Figure 3. Schematic drawing of the mockup model around the mirror base.
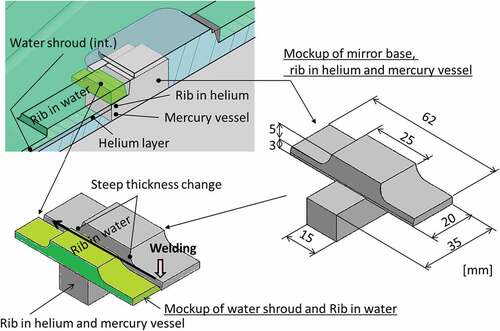
The welding process started at a 3-mm-thickness region with 760 kJ/m of applied energy. This energy increased to 2300 kJ/m when the welding torch arrived at the 8-mm-thickness region. After the torch passed the 8-mm-thickness region, the applied energy decreased and was adjusted to 660 kJ/m at a 3-mm-thickness region.
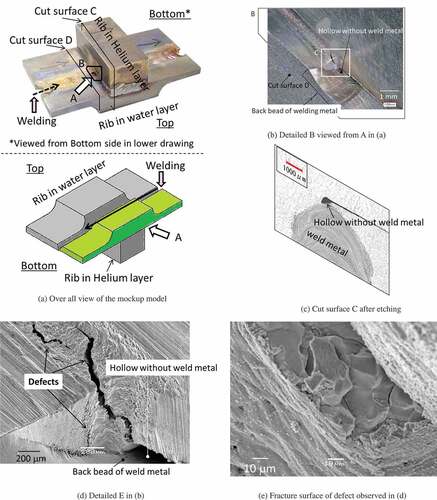
Consequently, the insufficient welding region and defects were identified in both of the two mockup models as shown in . Although shows results obtained using one mockup model, the insufficient welding region and defects were observed in the similar position of another mockup model. ) shows the overall view of the mockup model after the welding test observed from the back-bead side of the welding. In the 3-mm-thick plate, since the bump of back-bead was observed, the full penetration welding could be confirmed. However, insufficient welding was observed near the steep thickness change region in which the hollow was generated between the rib in the helium layer and back-bead surface as shown in ,c). ) shows a detailed view around the hollow (Window C in )). Defects were observed in the substrate material at the corner between the mirror base plate and the rib in the helium layer. And the fracture surface of these defects showed intergranular crack as shown in ). The depth of the defect, which was generated in the helium side, was about 0.4 mm toward the coolant-water side.
Figure 4. Inspection results of mockup model after the welding test; (a) overall view of the mockup model, (b) detailed B viewed from A in (a), (c) cut surface C after etching, (d) detailed E in (b), and (e) fracture surface of defect observed in (d).
The fatigue crack propagation analysis was carried out with the assumption that the initial crack was the defect as observed in the mockup models. The crack propagation length was estimated using the following equation [Citation14] based on the Paris law.
where a is the crack length, N the number of cycles, and ∆K the range of the stress intensity factor. shows the numerical result of the stress distribution on the cross-section of the welding line when the mirror deforms by 13 μm. This is attributed to the pressure waves imposed by the 500-kW beam injection. The crack propagation path was assumed that it starts from the defect as observed in to the helium layer with minimum distance. Thus, the length is 8.5 mm as shown in . Regarding the mirror vibration, the generated stress is varied linearly with the depth along the assumed crack propagation path, except for the corner where stress concentration occurs. This means that the bending stress was applied on the assumed path and was observed to be 16 MPa. The stress intensity factor is calculated following equation, which is provided in the case that the crack exists on the surface and the bending stress is imposed [Citation15].
Figure 5. Stress distribution on cross section of welding; Stress in perpendicular direction to the cross section.
where ∆σ is the range of bending stress (16 MPa) and W is the thickness of the assumed path.
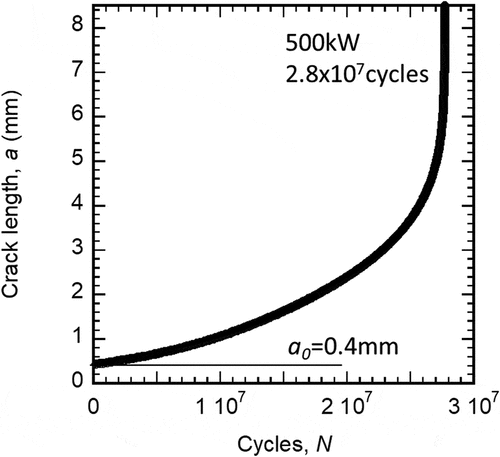
The operation time at 500-kW beam was about 300 h until the leakage occurred. During this period, the target vessel was exposed to the pressure waves of 2.8 × 10⁷ pulses. shows the result of the crack propagation analysis. The initial crack of 0.4 mm in depth was propagated to 8.5 mm after 2.8 × 10⁷ cycles. Therefore, it was deduced that the defect was penetrated through the plate thickness and the leak path was formed due to the pressure wave imposed repeatedly.
Figure 6. Estimated crack depth that propagates with the repeated stress owing to the pressure waves due to the pulsed proton beam injection.
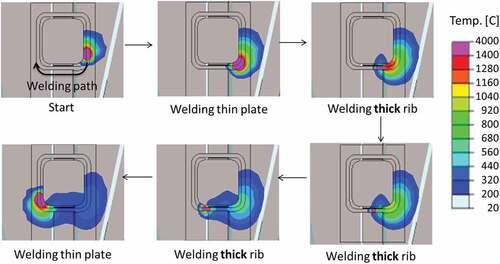
At next, we investigated the reason why the welding defect (insufficient welding) was formed. Transient numerical simulation was carried out in the welding process using the commercial finite element method code ‘ABAQUS’:
set the meshes of the first layer of the welded metal that was modeled with the ideal configuration, i.e., insufficient penetration could not be modeled,
input constant heat while moving it with constant speed as moving the welding torch,
repeat Steps 1) and 2) until the third layer.
Herein, the mechanical properties of the welded metal were assumed to be the same as those of the substrate materials. Temperature dependency of mechanical properties was considered but the phase change over the melting point was not modeled, i.e., latent heat was not considered. Heat transfer condition was applied between the surface of the substrate and the atmosphere except for the welded metal.
shows the calculated change in the temperature distribution during the welding process in the first path. The welding process was started at the position where the plate thickness is 3 mm as shown in . At the beginning of the welding process, the temperature above the melting point (1400°C) appeared not only at the welded metal but also at the substrate on the surface. However, it was shown that the high-temperature region became very small when the torch reached the region of thick rib. Regarding the results of the temperature distribution in depth, temperature exceeds 1400°C at the boundary of the weld metal and the substrate. However, the depth where the temperature exceeds 1400°C became shallow at the region of the thick rib, while the region of the high-temperature area became narrow as shown in . Therefore, these results were most likely to show the cause of the insufficient welding as observed in the mockup model. This is attributed to that the input heat defused to thick ribs due to the heat capacity change dependent on the thickness.
Figure 7. Change of the temperature distribution during the welding process of the first path.
In the welding condition, we must consider the plate thickness and moving torch speed to reach sufficient melting temperature at the welding area and must eliminate the steep change in thickness along to the welding line.
5. Design improvement resulting in 1-MW beam operation
Based on the investigation, to prevent the formation of defects as the cause of fatigue crack propagation, we adopted the design without the steep change in thickness along to the welding line for improved target vessel. Moreover, we reduced the number and total length of welding lines. In summary, a monolithic structure that comprised the mercury vessel, the mirror base, and water shroud was fabricated via machining from the same ingot, while a part that comprised the mercury vessel and the mirror base except for the water shroud was machined from the same ingot in the previous design. By improving the structure, the stress imposed by the pressure waves around the mirror base was numerically decreased from 152 MPa to 25 MPa under 1-MW beam operation. This is because of low-stress concentration at the corner part between the mirror base and wall of the water shroud. The improved target vessel with the monolithic structure was able to add the filets that reduced the stress concentration at the corner part. And we carried out more fluent inspections during the fabrication process to detect the defects along to the welding lines.
The two improved mercury target vessels were operated at MLF in 2017–2018 and 2018–2019. The operations at 1-MW beam were performed for 1 h with the first improved target vessel in 2018 and for almost half a day with the second one in 2019 just before the replacements of the target vessels. It is noted that the first and second improved target vessels were operated for ca 4400 h with 300–500 kW beam and for ca 3800 h with 500 kW beam, respectively, before 1-MW beam operations. The improved target vessels were operated without any troubles under such a high-power beam condition.
To achieve 1-MW beam operation for a longer period, we will operate the mercury target system as increasing the beam power for a longer period step-by-step and confirming the structural integrity of the target vessel.
6. Summary
At the MLF mercury target system, small inward leakage of coolant-water from the water shroud occurred during an operation at 500 kW in 2015. We carried out mockup tests and numerical simulation on the welding around the mirror base, on the upper side of the target vessel, concluding that welding around the mirror base was insufficient and the leak path was formed by the crack propagation due to the repeated-pressure waves during operation at 500 kW. Based on the investigation, the improved target design was adopted to eliminate the steep change of welding thickness which caused the welding defect and we carried out more fluent inspections to detect the defects along the welding lines. Two improved target vessels were operated so far. The operations at 1 MW beam for shorter period were successfully carried out in 2018 and 2019. From now on, to achieve 1-MW beam operation for a longer period, we will operate the mercury target system as increasing the beam power for a longer period step-by-step and confirming the structural integrity of the target vessel.
Acknowledgments
We deeply appreciate Dr. Hiroshi Yaguchi, Dr. Hisashi Nakamoto, and Mr. Makoto Tanabe of KOBELCO RESEARCH INSTITUTE Inc. for their assistance to carry out the investigation and numerical simulation on the welding process. We thank the member of Neutoron source section/J-PARC for their fruitful discussion.
Disclosure statement
No potential conflict of interest was reported by the authors.
References
- Maekawa F, Harada M, Oikawa K, et al. First neutron production utilizing J-PARC pulsed spallation neutron source JSNS and neutronic performance demonstrated. Nucl Instrum Meth Phys Res A. 2010;620:159–165.
- Futakawa M, Naoe T, Tsai CC, et al. Pitting damage by pressure waves in a mercury target. J Nucl Sci Technol. 2005;343:70–80.
- Futakawa M, Naoe T, Kogawa H, et al. Cavitation erosion induced by proton beam bombarding mercury target for high-power spallation neutron sources. Exp Therm Fluid Sci. 2014;57:365–370.
- Kogawa H, Naoe T, Futakawa M, et al. Mitigation technologies for damage induced by pressure waves in high-power mercury spallation neutron sources (IV) – measurement of pressure wave response and microbubble effect on mitigation in mercury target at J-PARC. J Nucl Sci Technol. 2017;54:733–741.
- Kogawa H, Naoe T, Kyotoh H, et al. Development of microbubble generator for suppression of pressure waves in mercury target of spallation source. J Nucl Sci Technol. 2015;52:1461–1469.
- McClintock DA, Riemer BW, Ferguson PD, et al. Initial observations of cavitation-induced erosion of liquid metal spallation target vessels at the spallation neutron source. J Nucl Mater. 2012;431:147–159.
- Naoe T, Teshigawara T, Wakui T, et al. Damage inspection of the first mercury target vessel of JSNS. J Nucl Mater. 2014;450:123–129.
- Naoe T, Wakui T, Kinoshita H, et al. Cavitation damage in double-walled mercury target vessel. J Nucl Mater. 2018;506:35–42.
- Wendel M, Winder D. Successful operation of the SNS mercury target at 1.4 MW. Trans Am Nucl Soc. 2019;120:394–396.
- Haga K, Kogawa H, Wakui T, et al. Technical investigation on small water leakage incident occurrence in mercury target of J-PARC. J Nucl Sci Technol. 2018;55:160–168.
- Harada M, Maekawa F, Teshigawara M, et al. Nuclear heat calculation for JSNS. Proceedings of the 18th Meeting of the International Collaboration on Advanced Neutron Sources (ICANS-XVIII); 2007 Apr 25 –29;Dongguan (China). p. 616–626.
- Teshigawara M, Wakui T, Naoe T, et al. Development of JSNS target vessel diagnosis system using laser Doppler method. J Nucl Mater. 2010;398:238–243.
- Takada H, Haga K, Teshigawara M, et al. Materials and life science experimental facility at the japan proton accelerator research complex I: pulsed spallation neutron source. Quantum Beam Sci. 2017;1:8. 1-8_26.
- Ohta A, Meda Y, Kosuge M, et al. Design curve for fatigue crack propagation in weldments containing tensile residual stress. Q J Jpn Weld Soc. 1989;7: 391–396. in Japanese.
- Satake R, Hirasaka Y, Mochida A, et al. Fundamental research of the stress intensity factor in the tip of a slit crack. Matsue Kousen Kenkyuu Kiyou. 2003;38: 65–71. in Japanese.