
 ?Mathematical formulae have been encoded as MathML and are displayed in this HTML version using MathJax in order to improve their display. Uncheck the box to turn MathJax off. This feature requires Javascript. Click on a formula to zoom.
ABSTRACT
Measuring the surface tension of molten ZrO2 is critical to determine the progression of a severe accident in a nuclear power plant. However, no experimental reports have been published pertaining to the surface tension of liquid ZrO2 because of its high melting point, high reactivity, and high vapor pressure, among other factors. Thus, in this study, the surface tension of ZrO2 was measured by using the droplet impingement method, which can help determine the surface tension of molten oxides in an extremely short time. The impingement behavior could be determined to analyze the surface tension from the image. The surface tension was approximately 0.91 N/m at 2988 K, which is the melting point of ZrO2, and this value was consistent with the data estimated using the oscillation droplet method. Compared with a past report regarding the surface tension of the molten Zr-O system, the surface tension of molten Zr was noted to reduce with oxidation.
1. Introduction
After the accident of the Fukushima Daiichi (1F) nuclear power plant in Japan, there is an increasingly urgent requirement to perform measurements pertaining to such events. In the 1F accident, core meltdown occurred, and a large amount of molten corium dropped to the bottom of the power plant [Citation1]. Therefore, it is necessary to grasp the flow behavior of the molten corium to locate the debris and remove it. Recently, computer simulations such as those involving the moving particle semi–implicit method (MPS) have been used to analyze the flow behavior [Citation2]; however, to apply the MPS method, the physical properties of molten corium are required as a parameter of the simulation.
Zirconium is used widely as the material for the control rods in nuclear power plants. When severe accidents occur, it is considered that zirconium is heated in air and oxidized to zirconium oxide; subsequently, the zirconium oxide melts and falls down the reactor. Therefore, a large of amount of molten corium made from zirconia is assumed to be present at such accident sites. It has been reported that 97 at. % of the debris generated by the severe accident in the three-mile-island was oxide, and 13.75 at. % of this oxide was zirconium oxide [Citation3,Citation4]. Consequently, to establish the physical properties of zirconium oxide, we reported upon the viscosity and surface tension of Zr1−xOx (x = 0, 0.1, 0.2) [Citation5] and the viscosity of molten ZrO2 [Citation6]. However, no experimental reports have reported on the surface tension of liquid ZrO2 because of the difficulty in performing the measurement at a high temperature.
The surface tension is usually measured using methods such as the sessile drop method [Citation7], maximum bubble pressure method [Citation8], and pendant drop method [Citation9]. Although these methods can facilitate the determination of the surface tension, the measurement cannot be performed at a high temperature because the molten oxides melt or react with the component of the apparatus, thereby affecting the result of the measurement [Citation10]. Recently, contactless methods have been improved, and some research groups have reported on the surface tension of molten oxides by using the aerodynamic levitation system (ADL) [Citation11,Citation12]. However, conventional ADL methods involve considerably long time (approximately a few minutes) to measure the surface tension because five resonant frequencies must be determined to evaluate the surface tension accurately [Citation13]. The surface tension evaluated using only one resonant frequency is said to be underestimated by approximately 20% [Citation12]. This aspect indicates that the ADL method is not suitable for measuring the surface tension of materials with high vapor pressure such as ZrO2 [Citation14].
In such a situation involving molten oxides, the droplet impingement method can be used to measure the surface tension. This method evaluates the surface tension of molten materials by considering the increase in the surface area when the free-fallen samples impinge onto the plate. The impingement behavior lasts for only a few hundred milliseconds, and by using the droplet impingement method, the surface tension of the samples can be determined in a considerably less time, as compared to that of other methods. The surface tension of molten Al2O3 has been determined accurately by using droplet impingement method [Citation15]. Thus, in this paper, the surface tension of molten ZrO2 is determined by using the droplet impingement method. To evaluate whether the oscillation droplet method underestimates the surface tension when applied for molten ZrO2, we also measured the surface tension by using the oscillation droplet method and compared the results obtained using the two methods.
2. Experimental
2.1. Droplet impingement method
The details of this method have been provided in a past report [Citation15]. ) shows the concept of the droplet impingement method, and ) shows is schematic of the measurement system. The levitation system consists of a separable conical converging–diverging nozzle (with the diameters of the converging and diverging parts being 1 mm and 3 mm, respectively) that is closed by gas pressure, and a levitation gas supply system. A gas mixture involving approximately 15% Ar and 85% O2 was supplied to the nozzle by using a mass flow controller at a typical combined flow rate of 400 cm3 min−1. O2 was mixed to prevent the reduction of samples during the experiments.
Figure 1. (a) Concept of the droplet impingement method (b) Schematic of the impingement analysis system.
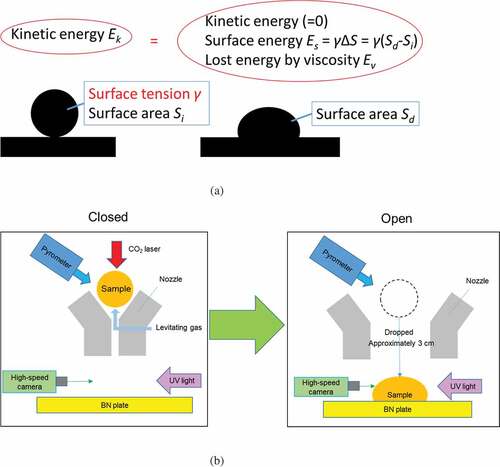
First, the sample, which was about 2 mm in diameter, was levitated by the levitation gas, and the sample was melted using a 100 W CO2 laser (Coherent, GEM100). Subsequently, the nozzle was opened by releasing the gas pressure, and the sample was dropped onto the boron nitride (BN) plate. The impingement behavior of the sample on the BN plate was observed by a 2000-fps high-speed camera (Ditect, HAS-D72M) equipped with a telecentric lens (Edmund, TS GOLD). It was verified by alumina measurement that the result of this method was not dependent on the type of plate and the interface effect between liquid and solid [Citation12]. We used UV light as the back light (Hamamatsu, Ls9588-02A) by using a 370 ± 2 nm band-pass filter. The images were analyzed using an original tool (Ditect, Deep macro II) to determine the center of gravity of the sample, center of gravity of the edge of the sample, and length of the edge of the sample. For the length, a stainless used steel ball with a diameter of 2 mm was used as the calibration sample. The temperature of the sample when it impinged the plate was evaluated from its cooling behavior, which was taken before the drop and the time required for the impingement.
The temperature of the sample during levitation was measured using a single-color (0.9 μm) pyrometer (Chino, IR-CAS8CNL). The data were recorded every 2 ms by using a data logger (Graphtec, GL-900). Because the emissivity of liquid ZrO2 is not known, we calibrated the temperature measured using the pyrometer (Tp) with the real temperature (T) of the samples, on the basis of Wien’s law [Citation16]:
where TL is the melting point, and TL,P is the melting point measured using the pyrometer (all temperature values have a unit of kelvin). The value of TL used for liquid ZrO2 was 2988 K [Citation14], and that of TL,P was determined based on the cooling curve corresponding to the maximum recalescence. By applying this equation, it is assumed that the emissivity of the sample does not change in the considered temperature range.
The surface tension of the sample can be evaluated from the change in the surface area during the impingement. The mechanical energy of the sample during the impingement can be expressed as
where Es is the surface energy, and Ev is the energy lost via viscous deformation. ΔEs is the increased surface energy because of deformation. The increased surface energy ΔEs is described elsewhere [Citation17],
where Si is the surface area before impingement, and Sd is the surface area of the deformed sample. These equations indicate that the surface tension can be calculated by determining Ek, Sd, Si, and Ev. The kinetic energy Ek and surface areas Sd, and Ss were determined from the recorded images. shows the images of the ZrO2 sample impinging the substrate. It should be noted that the edge of the sample is clearly recorded. To derive Ek, Sd, and Si, the recorded images were binarized, as shown in (b). Ek was determined from the adjacent images obtained immediately before the impingement (in this case, at 0 and 0.5 ms). The distance between the center of gravities of the sample for these two images (a) was calculated, which is the distance moved during one frame (0.5 ms) immediately before the impingement. Then, Ek was calculated as
where m is the mass of the sample after the experiment.
Figure 2. Images of the (a) sample during impingement (b) analyzed sample.
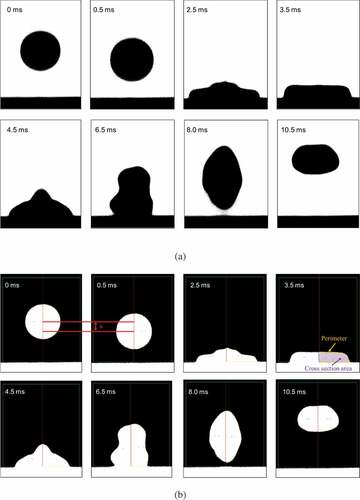
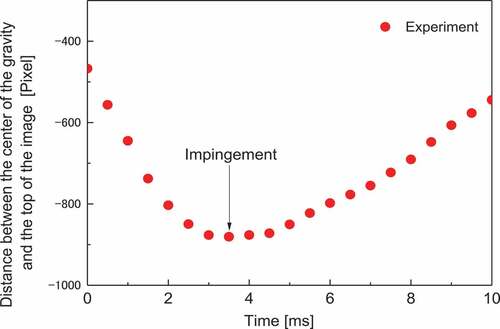
As Sd was determined from the image obtained when the kinetic energy of the sample became zero, the z position of the center of gravity was plotted as a function of time, as shown in (in this case, 3.5 ms). As we know the shape and size of the sample from the recorded image, Sd was calculated from the perimeter using the Pappus–Guldinus equation with the z axis being rotationally symmetric [Citation18]. Si was estimated as the surface area of a true sphere with the same volume as the deformed sample, which was calculated from the cross-sectional area of the sample using the Pappus–Guldinus equation [Citation18].
Figure 3. Time dependence of the center of gravity of the sample.
The lost energy by the viscose deformation of the sample during the impingement Ev can be calculated by assuming the deformation from the initial spherical shape to the maximum deformation during 1/4 the period of the well-known damped oscillation. The lost energy by 1/4 period of the damped oscillation is given by [Citation19]
where Γ is the damping oscillation constant, To is the time for a period of oscillation, ζ is the energy reduction rate, ρ is the density of the material [Citation12], and R is the radius of the sample when it is regarded as being spherical shaped. Γ could be calculated from the viscosity of the sample, which was taken from literature [Citation12]. The time between the sample contacting the plate and the maximum deformation was evaluated from the recorded image of the sample and found to be 2.0 ms for all cases. Thus, Ev was calculated using EquationEquations (5–7)(5)
(5) by specifying 8 ms for To.
2.2. Droplet oscillation method
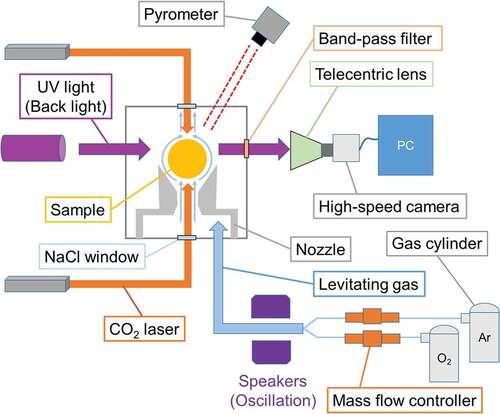
The experimental data was obtained from the previously performed viscosity measurement [Citation6], and the surface tension was analyzed by using the method described herein. shows the schematic for the experimental setup of the oscillation droplet method. The apparatus configuration is similar to that of the droplet impingement method. The sample of approximately 2 mm diameter is heated by two CO2 lasers to ensure homogeneous heating. The levitated sample is oscillated by the sound induced by the speakers to the levitation gas, and the behavior of the oscillation is recorded by the high-speed camera. More details pertaining to the setup of the apparatus are provided in previous paper [Citation6].
Figure 4. Schematic of the oscillation analysis system.
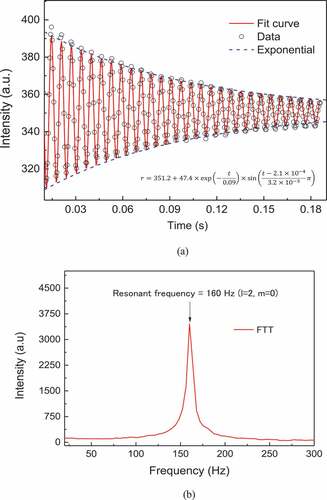
(a) shows the damping oscillation behavior (l = 2, m = 0 mode) of the molten ZrO2. The viscosity of the molten ZrO2 can be calculated from the damping behavior as shown in Ref [Citation6]. In this study, the surface tension of the molten ZrO2 was evaluated from the oscillation component using fast Fourier transform (FFT). (b) shows the result of the FFT, and the resonant frequency (l = 2, m = 0 mode) of the sample is shown as the peak in the graph. Using this value, the surface tension of the sample can be calculated as
where νR is the resonant frequency (l = 2, m = 0). The details of this method were presented by Langstaff et al. [Citation12].
Figure 5. (a) Damping oscillation of the ZrO2 sample (b) FFT analysis of the oscillation.
3. Results and discussion
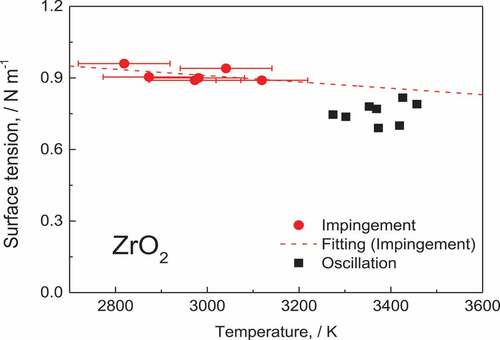
shows the result of the measurement. The filled-round plots correspond to the droplet impingement method, and the filled-square plots correspond to the droplet oscillation method. The droplet impingement method succeeded in measuring the surface tension of molten ZrO2 from 2819 K to 3119 K. The deviation of the result was small, and it was noted that the surface tension of the molten ZrO2 reduced slightly with an increase in the temperature.
Figure 6. Surface tension of liquid ZrO2.
The uncertainty of the impingement method arises from the process for calculating the initial kinetic energy Ek, temperature T, surface areas Si and Sd, and energy lost through viscous deformation, Ev.
The error of Ek is dependent on the timing with which the high-speed camera records the image of the sample because the value is more accurate when the images used to obtain the α value are taken just before the impingement. The uncertainty of Ek is expected to have a random distribution. For the same reason, also the value of Sd has a random error because the Sd value is accurate when the high-speed camera captures the image of the sample when the speed of the center of gravity is zero. As the deviation of our measured data shown in is not significant, we inferred that the uncertainty associated with Ek and Sd was small, owing to the high frame rate of the camera (2000 fps).
The error of the temperature is evaluated by comparing the value estimated by the cooling behavior of the levitated sample measured using the pyrometer and the value calculated using the Stefan–Boltzmann law [Citation20]. The cooling behavior measured by the pyrometer is usually lower than that of a free-falling sample due to the effect of the levitation gas. In contrast, the temperature of the sample estimated by the Stefan–Boltzmann law is usually overestimated because the law ignores the effect of the air surrounding the sample. When the emissivity of the liquid ZrO2 is assumed to be 0.81 [Citation20], the gap of the pyrometer value and the calculated value at the impinging time is about 100 K. The real temperature of the sample is between these gaps. Thus, we assumed that the temperature has an error of about ±100 K as a conservative estimate (error bar in ). This error did not affect largely the temperature dependence of the surface tension because the surface tension of liquid does not change greatly with temperature.
The error of Ev is affected by the error of the temperature because the viscosity is changed with the temperature of liquid. Using the equation of the viscosity of the liquid ZrO2 [Citation6], the viscosity of ZrO2 will reduce by 1 mPas when the temperature increased to 100 K. This affects the result of the surface tension insofar as it was underestimated by 0.3%.
Finally, we assumed that the shape of the sample before impingement was a true sphere; however, the actual shape of the sample was slightly distorted, which resulted in the overestimation of the Si value and the resultant surface tension. Thus, the ratio of the short to long axis of the sample before the impingement (, 0.5 ms) was analyzed and found to be 0.991, resulting in a 2% underestimation of the surface tension.
It follows that the systematic error of this method is up to 3% in the measurement of ZrO2, and this uncertainly is quite small regarding the result of the surface tension.
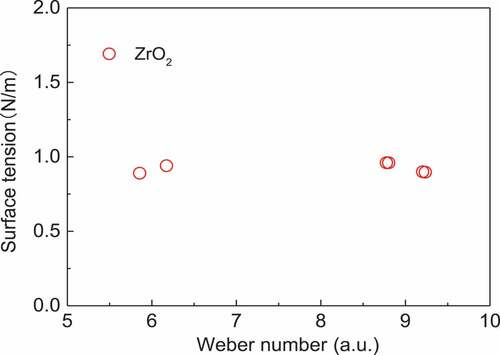
The other factor that causes uncertainly during measurement is the convection effect. To analyze this effect, we evaluated the Weber number [Citation21], which expresses the relationship between the kinetic energy and deformation of the sample as
where We is the Weber number, ρ is the density of the sample [Citation6], L is the diameter of the sample, v is the speed of the sample just before the impingement, and γ is the surface tension of the sample measured by the impingement method.
When there is a convection effect, the Weber number of each result is different because the temperature of each sample differs, which, in turn, means that the convection effect of each sample varies. This causes a change in the degree of deformation. However, the results from employing the Weber number () are almost the same among the measurements. This indicates that there is no convection effect during this measurement.
Figure 7. Weber numbers of the samples.
The value measured using the droplet oscillation method was lower than that obtained using the droplet impingement method, and the deviation was larger than that of the droplet impingement method. Langstaff et al. indicated that the surface tension calculated using only one resonant frequency is underestimated [Citation12].
The temperature dependence of the surface tension is expressed by the Eötvös rule [Citation10]:
The difference between the line corresponding to EquationEquation 10(10)
(10) (shown by the red-dotted line in ) and the measurement data was up to approximately 5%. Using EquationEquation 5
(5)
(5) , the surface tension of the liquid ZrO2 at its melting temperature (2988 K) was calculated to be (0.91 ± 0.01) N/m.
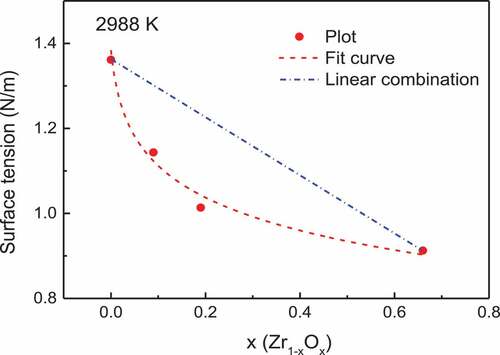
shows the data measured using the droplet impingement method along with the surface tension of molten Zr1−xOx (x = 0, 0.1, 0.2) measured using the electrostatic levitation system (ESL) [Citation5,Citation22] to evaluate the effect of oxygen on the surface tension. The surface tension of molten Zr decreased as O was introduced, and this phenomena has also been reported for other molten metal-oxygen systems such as Fe-O or Ag-O [Citation10].
Figure 8. Temperature dependence of the surface tension of the Zr-O system [Citation5,Citation22].
![Figure 8. Temperature dependence of the surface tension of the Zr-O system [Citation5,Citation22].](/cms/asset/1e9bd870-b420-4865-8304-06fc8ce229d6/tnst_a_1736681_f0008_oc.jpg)
The results shown in this indicate that the surface tension of molten Zr-O changes significantly with composition but slightly with temperature. Thus, the surface tension values of the molten Zr-O at 2988 K (melting temperature of ZrO2) are compared in . The surface tension values for Zr and ZrO2 at 2988 K were calculated based on the Eötvös rule. Since the slopes of the temperature dependence of surface tension of molten Zr and ZrO2 are almost the same, we estimated the slopes of the temperature dependence of the surface tension of Zr1−xOx (x = 0.1, 0.2) to be the average of Zr and ZrO2. The dotted lines in the are expressed as
The surface tension of molten Zr1−xOx (x = 0.1, 0.2) is slightly lower than the linear approximation estimated from the values for the molten Zr and ZrO2. The surface tension of a molten metal-oxygen system can be defined as [Citation10]
where γMetal-Oxy is the surface tension of a molten metal-oxygen binary system, γPure is the surface tension of the molten pure metal, R is gas constant, Г0 is the saturation coverage by the oxygen, K is the coverage independent adsorption coefficient, and ao is the activity of the oxygen. In this study, the activity of oxygen is considered to be the mole fraction of the oxygen (x). Since it is difficult to derive the values of Г0 and K theoretically, they are evaluated by fitting EquationEquation 6(6)
(6) to the data points in . Using these parameters, the surface tension of molten Zr-O at ZrO2’s melting point (2988 K) is expressed by
This equation agree well with the data points in , which indicates that the surface tension of the Zr-O system exhibits a typical behavior consistent with that of other metal-oxygen systems, such as Fe-O and Ag-O systems [Citation10]. The Г0 and K value could be reasonably compared with the value of Fe-O and Ag-O systems, which also indicate that a Zr-O system can be described with above metal-oxygen equation.
Figure 9. Composition dependence of the surface tension of the Zr-O system.
4. Conclusions
In the present work, the surface tension of molten ZrO2 was measured using the droplet impingement and droplet oscillation methods. The value measured using the oscillation droplet method was lower than that of the droplet impingement method, owing to the simplification of measurement of the oscillation droplet method. Thus, the value measured using the droplet impingement method is considered to be more accurate, with the value of the surface tension of liquid ZrO2 being approximately 0.91 N/m at its melting temperature (approximately 2988 K). The presented findings indicate that the surface tension of the Zr-O system can be described from the typical depiction formula of a molten metal-oxygen system.
Nomenclature
| T | = | Temperature [K] |
| E | = | Energy [J] |
| γ | = | Surface tension [N/m] |
| S | = | Surface area [m2] |
| t | = | Time [s] |
| R | = | Radius [a.u] |
| A | = | Amplitude [a.u] |
| ν | = | Frequency [Hz] |
| M | = | Mass [g] |
| We | = | Weber number [a.u] |
| L | = | Diameter [m] |
| ρ | = | Density [kg/m3] |
| v | = | Speed of the sample [m/s] |
| Γ | = | Saturation coverage [mol/m2] |
| K | = | Coverage independent adsorption coefficient [dimensionless number] |
| a | = | Activity [dimensionless number] |
Supplemental Material
Download PDF (2 MB)Acknowledgments
This study is the result of the research “Development of viscosity and surface tension measurement technique for molten core materials” performed under the Nuclear Energy Science & Technology and Human Resource Development Project (through concentrating wisdom) of the Japan Atomic Energy Agency, and it is supported by a Grant-in-Aid for JSPS Fellows, [18J10057].
Disclosure statement
No potential conflict of interest was reported by the authors.
Supplementary material
Supplemental data for this article can be accessed here.
References
- Funabashi Y, Kitazawa K. Fukushima in review: a complex disaster, a disastrous response. Bull At Sci. 2012;68:9–21.
- Yamaji A, Li X. Development of MPS method for analyzing melt spreading behavior and MCCI in severe accidents. J Phys Conf Ser. [Internet]. 2016;739:012002. Available from: http://stacks.iop.org/1742-6596/739/i=1/a=012002?key=crossref.834935216df259109da2438da39011ed
- Akers DW, Jensen SM, Schuetz BK. Examination of relocated fuel debris adjacent to the lower head of the TMI-2 reactor vessel. Idaho Natl Eng Lab. 1994. doi:10.2172/10140801.
- McCardell RK, Russell ML, Akers DW, et al. Summary of TMI-2 core sample examinations. Nucl Eng Des. 1990;118:441–449.
- Ohishi Y, Kurokawa K, Sun Y, et al. Thermophysical properties of molten Zr1−O (x=0.1, 0.2) measured by electrostatic levitation. J Nucl Mater. [Internet]. 2019;151873. Available from: https://linkinghub.elsevier.com/retrieve/pii/S0022311519310542
- Kondo T, Muta H, Kurosaki K, et al. Density and viscosity of liquid ZrO2 measured by aerodynamic levitation technique. Heliyon. [Internet]. 2019;5:e02049.
- Zubarev YV, Kostikov VI, Mitin BS, et al. Certain properties of molten (Liquid) aluminums oxide. Izv Akad Nauk SSSR Neorg Mat. 1968;5:1563.
- Shpil’rain EE, Yakimovich KA, Tsitsarkin AF. Experimental study of the density of liquid alumina up to 2750°C. High Temp Press. 1973;5:191–198.
- Kingery WD. Surface tension of some liquid oxides and their temperature coefficients. J Am Ceram Soc. 1959;42:6–10.
- Iida T, Guthrie RTL. The physical properties of liquid metals. Oxford: Oxford Science Publication; 1988.
- Millot F, Rifflet JC, Wille G. High-temperature properties of liquid boron from contactless techniques 1. Int J Thermophys. 2002;23:1185–1195.
- Langstaff D, Gunn M, Greaves GN, et al. Aerodynamic levitator furnace for measuring thermophysical properties of refractory liquids. Rev Sci Instrum. [Internet]. 2013;84:124901. Available from: http://aip.scitation.org/doi/10.1063/1.4832115
- Cummings DL, Blackburn DA. Oscillations of magnetically levitated aspherical droplets. J Fluid Mech. [Internet]. 1991;224:395–416. Available from: https://www.cambridge.org/core/product/identifier/S0022112091001817/type/journal_article
- Gale WF, Totemeier TC. Smithells metals reference book. 8th ed. Netherland: ELSEVIER Inc.; 2004.
- Kondo T, MuTa H, Ohishi Y. Development of a new method to measure surface tension of molten oxides. High Temp - High Press. Forthcoming.
- Brillo J. Thermophysical properties of multicomponent liquid alloys. Köln: De Gruyter Oldenbourg; 2016.
- Nii K. Surface tension and surface stress. Japan Inst Met. 1974;13:321–327.
- Goodman AW, Goodman G. Generalizations of the theorems of Pappus. Am Math Mon. [Internet]. 1969;76:355–366. Available from: https://www.tandfonline.com/doi/full/10.1080/00029890.1969.12000217
- Thomson W. Theory of vibration with applications. 4th ed. Upper Saddle River (NJ): Pearson Education; 1996.
- Noguchi T, Mizuno M. Phase changes in solids measured in a solar furnace ZrO2TiO2system. Sol Energy. 1967;11:56–61.
- Tanaka Y, Washio Y, Toshino M, et al. Dynamic behavior of droplet on solid surfaces for various weber numbers. JASCOME. [Internet]. 2008;8:65–70. Available from: http://ci.nii.ac.jp/naid/40016959856/
- Ishikawa T, Paul-François P, Junpei O, et al. Viscosity measurements of molten refractory metals using an electrostatic levitator. Meas Sci Technol. 2012;23:025305.