
 ?Mathematical formulae have been encoded as MathML and are displayed in this HTML version using MathJax in order to improve their display. Uncheck the box to turn MathJax off. This feature requires Javascript. Click on a formula to zoom.
ABSTRACT
This study develops a new fission gas release (FGR) model for mixed oxide (MOX) fuel pellets with fundamentally heterogeneous microstructures depending on the mixing methods of UO2 powder and PuO2 powder in fabrication process. The Japan Atomic Energy Agency developed a fuel performance modeling software FEMAXI-8 with an original FGR model supposing the microstructure to be homogeneous. The new FGR model explicitly treats the heterogeneity by computing the fission gas migration in two substructures independently. The model was applied to analyses of irradiation tests at the Halden reactor, in which two types of MOX fuels had different heterogeneity in their microstructure, while other fuel specifications were similar.
The homogeneous model significantly underestimated FGR from the fuel with a remarkably heterogeneous microstructure. The new FGR model gave better calculations of the FGR behaviors of the remarkably heterogeneous fuel, namely the earlier onset of FGR and larger FGR at the end of irradiation than the relatively homogeneous fuel. The improved agreement with the experimental observation confirmed a certain validity of the developed model for estimating FGR from MOX fuels and studying heterogeneity effects.
1. Introduction
Uranium and plutonium are utilized in light water reactors in the form of their oxides, as fuel pellets. The reactor core consists of hundreds of fuel assemblies, which are bundles of fuel rods containing the fuel pellets. While the fuel pellets confine most of the fission products generated from fission reaction under reactor operation, some gaseous fission products (fission gas) are expected to be released from the fuel pellets in both normal operation conditions and abnormal transient conditions. Released fission gas migrates to the pellet-cladding gap and gas plenum and increases the inner gas pressure of fuel rods. As excess gas pressure could affect the integrity of fuel cladding for sealing radioactive substances, fission gas release (FGR) needs to be evaluated for fuel design and safety evaluation. FGR evaluations for light water reactors today are based on strong empiricism in terms of effects of fuel burnup, fuel design, irradiation condition, and fuel pellet type as UO2 and mixed oxide (MOX). Therefore, efforts to better understand the release mechanisms for more mechanistic modeling are critical for improving existing safety evaluations and extending new materials and reactor designs, with far less supporting experimental data.
MOX fuels are broadly fabricated by mixing depleted UO2 powder and highly enriched PuO2 powder; therefore, MOX fuels must be more or less heterogeneous regarding their grain size and Pu content, and so on. MOX fuels generally consist of various types of fuel grains and corresponding agglomerate regions. Some MOX fuels and their unique fabrication methods cause several heterogeneities in microstructures. Several studies [Citation1,Citation2] have explored the features of MOX fuels’ microstructures and FGR differences among each fabrication method. Studies have produced various measurements about microstructures and results of post-irradiation examinations proving various gas concentrations between different agglomerate regions. Much fuel performance software, such as FRAPCON [Citation3], FAST [Citation4], and TRANSURANUS [Citation5], have supposed the microstructure to be homogeneous. Therefore, the FGR models represent only a single pair of fuel grain and grain boundary, making it challenging for such software to quantitatively estimate separate effects of heterogeneous microstructures on fission gas behaviors. Some studies [Citation6,Citation7] have already modeled such fission gas behaviors of MOX fuels by expressing the simulated system with a spherical particle of PuO2 and surrounded by UO2 matrix region, for mainly considering FGR from only Pu-spot and the diffusion of PuO2 into matrix region. Koo et al. [Citation8] proposed a model to treat fission gas behavior in Pu-spot and matrix region, which is capable of individually estimating FGR from two regions with consideration of Pu-spot size and recoil of fission products from Pu-spot to matrix region. The subsequent study by Jernkvist [Citation9] further took account of the consumption of fissile material in each region with burnup progress. While they succeeded in simulating enhanced FGR caused by the microstructure heterogeneity, efforts to assess validity of such modeling approach are still limited and close comparison of calculated fission gas inventories with detailed Post Irradiation Examination (PIE) data has never been performed. As such heterogeneous treatment of fuel microstructures has been incompatible with the previous FGR models implemented in FEMAXI-8, which traces fission gas behaviors with a single type of fuel crystal grain, this study develops an FGR model such that the analytical system consists of two pairs of fuel grains and associated grain boundaries for the matrix region and Pu agglomerate region (Pu-spot). Independent grain size and Pu enrichment are applied to each fuel grain using the new FGR model. This development and adopted approach are motivated by Kitano et al. [Citation10], in which FGR from a MOX fuel rod was evaluated using weight-average FGRs from two hypothetical rods consisting of Pu-spot and matrix region, respectively. This study adopted instrumented fuel assembly (IFA)-626 and IFA-702 irradiation tests conducted at the Halden reactor, in which two types of MOX fuels with different fabrication methods have been irradiated and analyzed for validating cases of the proposed model.
2. Method
2.1. Calculation method of FEMAXI-8
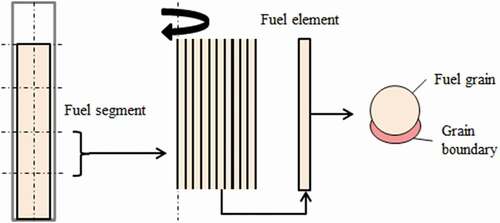
FEMAXI-8 [Citation11] analyzes a single fuel rod by assuming its geometry is axially symmetric. The fuel rod is axially divided into multiple segments, and the pellet within each segment is divided into several iso-volume ring elements, while the cladding is represented by iso-thickness ring elements with a few waterside oxide layers ().
Figure 1. Calculation geometry of FEMAXI-8 [Citation11].
![Figure 1. Calculation geometry of FEMAXI-8 [Citation11].](/cms/asset/93edd5e5-1a08-4808-8e91-dfba6a777151/tnst_a_1973924_f0001_oc.jpg)
FEMAXI-8 couples mechanical calculation (based on the finite element method) with thermal calculation (based on the finite difference method). Mechanical calculation considers fuel and cladding behaviors, such as elastic, plastic, creep deformation, fuel densification, fuel swelling, fuel and cladding thermal expansion, and fuel relocation. Thermal calculation considers radial heat conduction, fuel/cladding gap heat transfer, and cladding/coolant heat transfer. Because input information is specific to the calculation target, FEMAXI-8 needs fuel data, coolant conditions, and irradiation histories, such as the average linear heat rate of the rod and axial and radial power profiles.
2.2. FGR models of FEMAXI-8
A fuel pellet is an agglomeration of fuel crystal grains whose diameters are from several micrometer to several dozen micrometer. Here, grain sizes mentioned in this paper do not refer to what was acquired by only measuring cross-sectional fuel grains (2D grain size) but converted values acquired by considering their three-dimensionality (3D grain size). This conversion is necessary because most fuel grain cross-sections in a microscopic observation do not capture the center plane of each grain, and thus, a grain size measured in the sectional view must, on average, become lower than the true size.
The original FGR model of FEMAXI-8 represents one type of fuel grain and associated grain boundary in each subdivided fuel element (). Each fuel element is homogeneous regarding its microstructure, irrespective of actual heterogeneity. FEMAXI-8 runs as many separate FGR calculations as the number of subdivided fuel elements for a single axial segment. The amount of released fission gas from subdivided fuel elements is summated to determine the total amount of released fission gas from a fuel stack.
Figure 2. Calculation geometry of FGR evaluation of FEMAXI-8.
This subsection describes newly developed heterogeneous microstructure model for intra- and inter-granular gas behaviors and the model components. Meanwhile, the originally available FGR model, homogeneous microstructure model, are explained in Appendix.
2.3. Heterogeneous microstructure model
This subsection describes the newly developed model for FEMAXI-8 to independently treat several types of grains in each subdivided fuel element. Microstructures of MOX fuels are roughly distinguished as the Pu-spot and the matrix region. shows the calculation overview of the new FGR model.
Figure 3. Calculation geometry of the heterogeneous microstructure model.
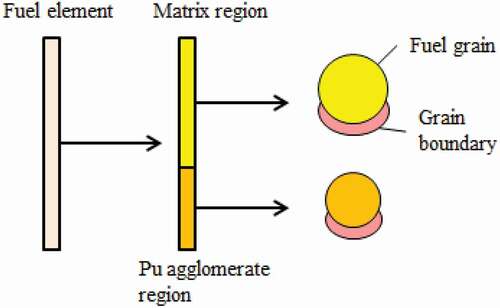
The new FGR model represents double pairs of fuel grains and their grain boundaries in each subdivided fuel element. To define the volumetric fraction of Pu-spot and the localization of Pu content in the Pu-spot, the model requires additional input data, such as the ratio of Pu weight in the Pu-spot to the total (all regions) Pu weight () and the ratio of Pu-spot volume to the total (all regions) fuel volume (
). The fuel grain size in the Pu-spot (
) can be specified independently. Note that the additional input data are based on the initial states of fuel, and this model does not consider the change in
and
through irradiation. The original FGR model of FEMAXI-8 (Appendices A and B) has been extended as described below.
2.3.1. Definition of local burnup and fission gas generation
The Pu-spot and matrix region in MOX fuel have different Pu contents and, consequently, different heat generation densities. The region-dependent heat generation densities are not used for the temperature calculation of each fuel element but for calculating the fission gas generation rate. Therefore, fuel temperature is assumed to be uniform between the Pu-spot and matrix region. The new FGR model defines the conversion factor from the heat generation density of fuel elements to that of each fuel microstructure (),
where is the type of fuel grain. The index
is for the matrix region and
is for the Pu-spot. The parameters on the right hand side of Equation (1) (
) are the fission macroscopic cross-section of fissile Pu (
, calculated from the fission microscopic cross-section of fissile Pu (Puf) and the number of Puf atoms per unit fuel volume (number density of Puf atoms) (Equation 2). The number density of Puf atoms in each fuel region (
) is nearly equal to the product of the two parameters (Equation 3). Equation (4) defines the first parameter on the right hand side (
). Here, the number of heavy metal atoms (Pu and U) per unit volume of the fuel region (
) is assumed to be independent of fuel regions. This study does not further describe this parameter because it is canceled in Equation (1).
where
: Fission microscopic cross-section of Puf
: The number of Puf atoms per unit volume of fuel region (number density of Puf atoms in each fuel region)
: The number of heavy metal atoms (Pu and U) per unit volume of fuel region
: Isotopic ratio of Puf in Put (total Pu)
: Put content in fuel pellet
Then, the heterogeneous microstructure model extends Equations (A-2) and (A-3) with Equation (1), which is shown as follows (Equations 5 and 6).
2.3.2. Extension of intergranular gas behavior model
The original intergranular gas behavior model treats its major state variables as quantities defined for the fuel element unit volume, which coincides with the fuel region unit volume in the case of the assumed homogeneous system. The two types of unit volumes must be discriminated in the case of the heterogeneous microstructure model because a fuel element is divided into two sub-regions with different volume fractions. Therefore, it is natural to precisely determine state variables for the unit volumes of fuel sub-regions. Accordingly, Equation (A-9) must be extended as
where is the area of the grain boundary per unit volume of fuel region (matrix region and Pu-spot); the conversion factor from
to
(per unit volume of fuel region).
The other parameters in Equations (A-4)–(A-7) are extended similarly to satisfy their definition as quantities per unit volume of fuel region. Then, the meaning of is also changed, and Equation (A-11) must be extended as follows (Equation 8):
Analyses of relatively homogeneous fuels, such as Short Binderless Route (SBR)-MOX and fuels, correspond to a condition of
and
. The contribution from
then almost disappears and the behavior related to
becomes very similar to that of the original (homogeneous) FGR model.
3. Analytical targets
The new FGR model, described in Section 2.3, was applied to the analysis of irradiation behaviors of two MOX fuel rods with different heterogeneity in their fuel microstructures, irradiated in the IFA-626 and IFA-702 tests conducted at the Halden reactor. IFA-626 is base irradiation up to about 63 GWd/t and IFA-702 is extension irradiation up to about 70 GWd/t. This section shows the test fuel specification, irradiation conditions, and data processing method needed to prepare input for FEMAXI-8.
3.1. Data from irradiation IFA-626 and IFA-702 tests
Two types of MOX fuels were fabricated using the SBR and the Micronized Master blend (MIMAS) method with the precipitation from Ammonium Uranyl Carbonate (AUC), namely the SBR-MOX and MIMAS-MOX fuels, respectively. shows the fuel rod specifications [Citation12].
Table 1. Fuel specifications of MOX fuels in IFA-626 and IFA-702 [Citation12]
There are only a few differences other than their fabrication methods between the two analyzed rods. The pellet diameter of the MIMAS-MOX fuel is smaller than that of the SBR-MOX fuel by 0.14 mm, and the cladding thickness of the MIMAS-MOX fuel is larger than that of the SBR-MOX fuel by the difference in their pellet diameters.
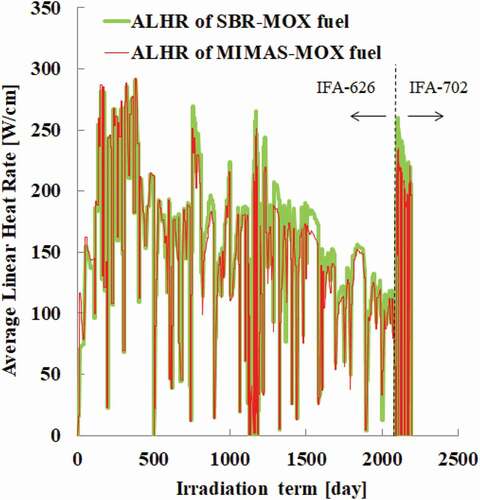
shows the average linear heat rate (ALHR) of each fuel. The ALHR of the SBR-MOX fuel is higher than that of the MIMAS-MOX fuel, except in the early stage of irradiation.
Figure 4. Irradiation histories of SBR-MOX and MIMAS-MOX fuels in IFA-626 and IFA-702.
shows the experimental data of FGR evaluated from the results of puncture tests performed after each of the two irradiation stages [Citation13]. The FGR differs significantly between the SBR-MOX and MIMAS-MOX fuels at the end of IFA-626, and the difference becomes smaller at the end of IFA-702.
Table 2. FGRs from IFA-626/IFA-702 SBR-MOX and MIMAS-MOX fuel at the end of each irradiation [Citation13]
3.2. Image processing of the microstructure of IFA-626 MIMAS-MOX fuel
This subsection describes data processing for the MIMAS-MOX and SBR-MOX fuels needed to use the heterogeneous microstructure model. Pu content distributions of both microstructures were investigated using EPMA mapping [Citation14]. Upper parts of show its microstructure colored by Pu content in wt%.
Figure 5. Microstructures of non-irradiated IFA-626 MIMAS-MOX (left side) and SBR-MOX fuel (right side) and extracted Pu-spot area of each fuel [Citation14].
![Figure 5. Microstructures of non-irradiated IFA-626 MIMAS-MOX (left side) and SBR-MOX fuel (right side) and extracted Pu-spot area of each fuel [Citation14].](/cms/asset/35456f67-60c6-4115-bdb8-f49350078280/tnst_a_1973924_f0005_oc.jpg)
Usually, the MIMAS-MOX fuels using the AUC method and SBR-MOX fuels have two fuel regions (Pu-spot and matrix region) [Citation1,Citation2]. Upper parts of , however, show the third region: the depleted U agglomerate region. Tentatively, the present analysis with the heterogeneous microstructure model regarded this microstructure as two fuel regions by averaging the matrix region and depleted U agglomerate region regarding Pu content. The analysis defined the fuel region in which the Pu content is more than 12% as the Pu-spot. The parameters VR and WR were determined using an image processing software, ImageJ [Citation15]. Lower parts of show the extracted Pu-spots as the black area. Image processing also produced an area ratio of the Pu-spot and Pu content in the Pu-spot (). Because each Pu-spot in the SBR-MOX fuel had a different Pu content and it was difficult to specify a unique value, a maximum value (40%) was adopted to confirm its impact on FGR. The volume ratios of the Pu-spot, which is needed to use the heterogeneous microstructure model, were substituted by area ratios evaluated from lower parts of .
Table 3. Microstructure data of IFA-626 SBR-MOX and MIMAS-MOX fuels
Some data on had to be modified to satisfy the requirement from the formulation of the heterogeneous microstructure model.
The previous study on the microstructure of irradiated IFA-702 [Citation10] estimates the initial grain sizes of two fuel regions in the MIMAS-MOX fuel, which was applied in this analysis (). Those in the SBR-MOX fuel are unknown. Because the SBR-MOX fuel contains only a limited volume fraction of the Pu-spot, an initial grain size of the matrix region should be nearly equal to the average grain size shown in . It is challenging to estimate the grain size of the Pu-spot, and the size seems not to produce a significant effect on FGR because the volume fraction is limited. This study still ensures the sensitivity by comparing calculation results with the original (homogeneous) model and the new (heterogeneous) model.
Table 4. The assumed initial grain size of IFA-626 MIMAS-MOX fuel [Citation10]
Almost all mechanical and thermal properties and models are based on another study with FEMAXI-8 [Citation16], including most of the models and parameters regarding fission gas behavior. A sole change was introduced on an empirical parameter for the equation to determine the fraction of edge porosity connected to a free volume, namely (E) seen in Equation (A-5). FEMAXI-8 formulates E as follows:
where
is the empirical parameter for correlation between edge porosity and E.
The empirical parameter is set to 1 in this study, instead of the grain size-dependent parameter introduced in [Citation17]. Equation (10) then returns to an equation seen in the original Matthews’ model. This change excludes a less physics-based tuning factor regarding the grain size effect that might screen the effect of separate treatment of the Pu-spot and matrix region enabled by the heterogeneous model.
4. Analytical results
First, an analysis of the SBR-MOX fuel with the heterogeneous microstructure model showed almost the same FGR behavior as that estimated by the homogeneous microstructure model. Sensitivity analyses regarding the grain size of the Pu-spot confirmed this result. Therefore, only the result of the homogeneous microstructure model is discussed hereafter regarding the SBR-MOX fuel.
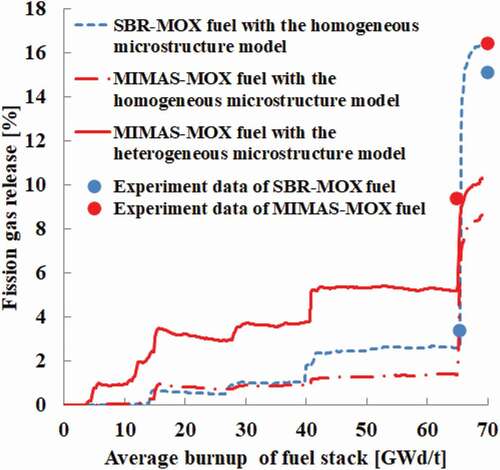
compares the evaluated FGRs of both fuels with the experimental results from IFA-626 and IFA-702. The estimation for the SBR-MOX fuel follows the experimental data, that for the MIMAS-MOX fuel with the homogeneous microstructure model is far less than the measurement, and that of the SBR-MOX fuel even though the experimental data shows higher FGR from the MIMAS-MOX fuel. However, the heterogeneous microstructure model estimates an earlier onset and, finally, a higher level of FGR from the MIMAS-MOX fuel. Therefore, the new FGR model, to some degree, improves the estimated magnitude relation of FGR values between the MIMAS- and SBR-MOX fuels.
Figure 6. FGRs from IFA-626/IFA-702 Sthe BR-MOX and MIMAS-MOX fuels calculated with the homogeneous/heterogeneous microstructure model.
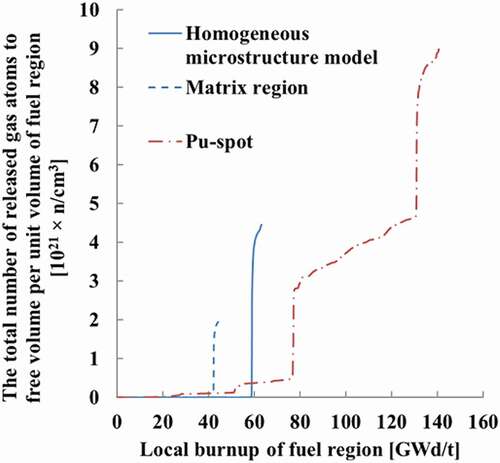
represents the total number of gas atoms released from each fuel region evaluated using the new FGR model. The figure focuses on the center fuel element in the highest segment, which will be explained later. The ratio of the local burnup to the element average burnup is 0.716 for the matrix region and 2.23 for the Pu-spot, which are based on the evaluations using Equation (1). The total number of gas atoms released from the matrix region is lower than that from the Pu-spot for a given local burnup.
Figure 7. Released fission gas atoms from the matrix region and Pu-spot calculated in IFA-626 and IFA-702 MIMAS-MOX fuel (a fuel element of interest is in the center position of the highest fuel segment).
Here, sensitivity analyses were also tried in the case of the MIMAS-MOX fuel, focusing on the change of the Pu-spot volume ratio () and Pu content of the Pu-spot (
) (). These analyses examine how uncertainties involved in image processing affect FGR since there are no clear or standardized criteria to determine the Pu-spot. In more detail, while it is natural that the green area seen in is regarded as the Pu-spot, it is more challenging to judge whether the light blue area, with a Pu content of ~10%–20%, is the Pu-spot. The sensitivity analyses confirm the uncertainty involved in treating the light blue area. The changes of ±5% in
and
assure enough sensitivity whether the Pu-spot contains such an ambiguous region or not.
Figure 8. Sensitivity analyses of MIMAS-MOX fuel focusing on VR.
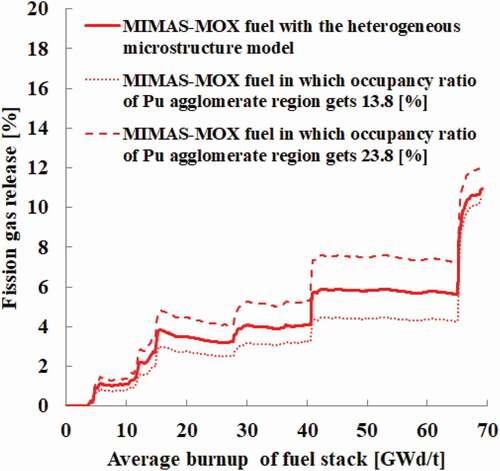
Figure 9. Sensitivity analyses of MIMAS-MOX fuel focusing on .
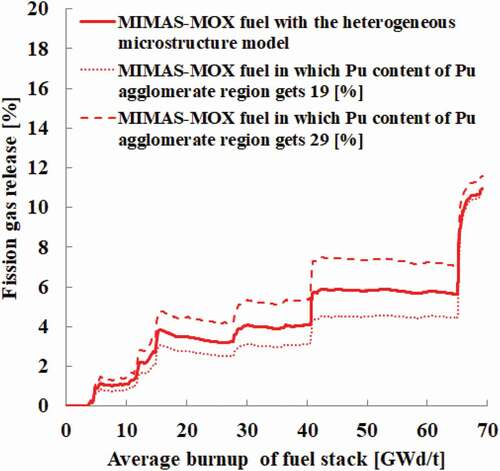
The results of the sensitivity analyses given in show that FGRs change by ~2% at a maximum. Therefore, the expected uncertainty does not affect the qualitative arguments mentioned in .
Next, study on the microstructure analysis of IFA-702 MIMAS-MOX fuel [Citation10] has clarified Xe concentrations of the matrix region and Pu-spot using EPMA and SIMS. Fission gas behaviors individually computed in each fuel region using the heterogeneous model can be compared more closely with the experimental data. The number of gas atoms in the intra-grain, grain boundary face, and grain boundary edge is given in .
Figure 10. Gas concentration in intra-grain calculated in IFA-626 and IFA-702 the MIMAS-MOX fuel (a fuel element of interest is in the center position of the highest fuel segment).
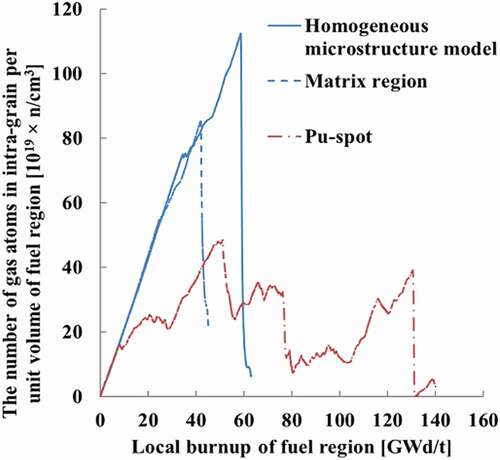
Figure 11. Gas concentration in grain boundary face calculated in IFA-626 and IFA-702 MIMAS-MOX fuel (a fuel element of interest is in the center position of the highest fuel segment).
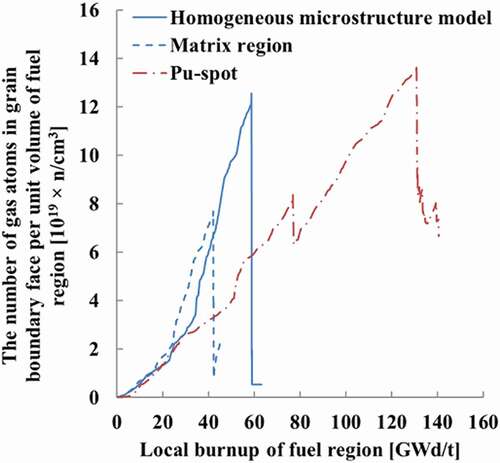
Figure 12. Gas concentration in grain boundary edge calculated in IFA-626 and IFA-702 MIMAS-MOX fuel (a fuel element of interest is in the center position of the highest fuel segment).
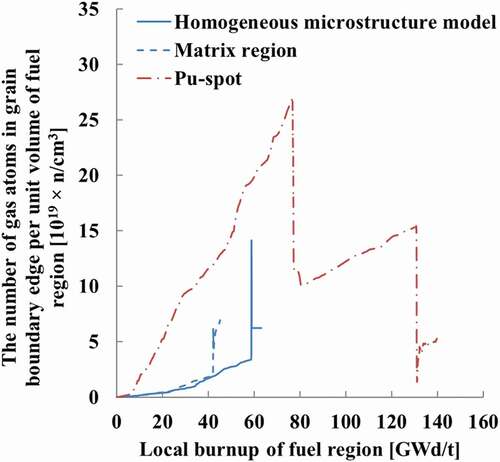
focus on the same fuel element as in because the burnup of the fuel sample investigated in Kitano study [Citation10] using SIMS is close to that of the highest segment, and the measured Xe concentration shows the least scatter at the center part of the fuel (pellet) sample. The total gas atoms in the intra-grain, grain boundary face, and grain boundary edge at the end of burnup () corresponds to the total gas atoms retained in the fuel element after the irradiation test. This retained gas amount can be converted into Xe concentrations and directly compared with the SIMS measurement of total Xe remaining in the solid phase and bubbles in each fuel region. compares the measured and calculated Xe concentrations.
Table 5. Comparison between the measurement after IFA-702 and the estimation of Xe remaining in solid phase and bubbles considering the matrix region and Pu-spot in IFA-626 and IFA-702 MIMAS-MOX fuel
Only in this fuel element, the evaluated Xe concentration of Pu-spot is less than the experimental result; however, that of the matrix region is larger than the experimental data.
5. Discussion
The estimation for the SBR-MOX fuel correlates well with the measurement, and the corresponding intra/intergranular gas behavior models and associated model parameters should work as a validated reference calculation condition, to some extent. On the other hand, the homogeneous microstructure model has estimated significantly lower FGR from the MIMAS-MOX fuel than that from the SBR-MOX fuel, contradicting the experimental result. This relation in estimated FGRs between the MIMAS-MOX and SBR-MOX fuels is a sort of natural result as long as the homogeneous model is employed since the fuel center temperature of the MIMAS-MOX fuel was lower than that of the SBR-MOX fuel because of its lower linear heat rate (). Therefore, some differences in fission gas migration or release kinetics between SBR and MIMAS exist in the case of IFA-626 and IFA-702. Applying the heterogeneous microstructure model to the MIMAS-MOX fuel case has partially improved FGR estimation with no change in the calculation condition, except the specifications of heterogeneous microstructures. Therefore, the microstructural heterogeneity is a critical factor to explain the difference in fission gas behaviors between the MIMAS-MOX and the SBR-MOX fuels, as discussed in Kitano [Citation10], specifically for the base irradiation period, IFA-626.
The new FGR model still underestimates FGR from the MIMAS-MOX fuel, especially for the ramp irradiation period, IFA-702. The comparisons made in imply that the underestimation is related to the overestimated fission gas amount in the matrix region, which raises the question whether or not the overestimation of retained gas amount in matrix region is attributed to the simplified treatment of the matrix region as a mixture of the original matrix region and the depleted U agglomerate region (see Section 3-2). The Pu content of the simulated matrix region becomes lower than that of the original one, leading to a lower heat generation density (fission gas generation density) because of the conversion factor defined by Equation (1).
Although the current version of FEMAXI-8 does not support explicit treatment on the Pu-spot, original matrix, and depleted U agglomerate regions for this case, the impact of the approximated treatment of the matrix region can be roughly estimated by comparing the calculation results with those from the homogeneous model. Therefore, since the homogeneous model case simply adopted a Pu content of 8.4% given in , which is close to the Pu content of the original matrix region (~8%) seen in , the results from the homogeneous model should predominantly represent the behavior of the original matrix region.
The comparison is made in between the matrix region using the heterogeneous model and the homogeneous microstructure model as a surrogate of the original matrix region. While gas behaviors in IFA-626 are similar between the two series, gas migration from the grain interior to the grain boundary and release from the grain boundary to the free volume in IFA-702 are significantly faster with a higher Pu content case (homogeneous microstructure model). The higher Pu content results in more FGR from the matrix region in IFA-702 and less retained gas, both of which improve the correlation between the experimental results seen in and . It is characteristic of current FEMAXI-8 fission gas modeling that transient gas migration from the grain interior to the grain boundary is enhanced when intra-grain gas concentrations become higher with local burnup increase [Citation11,Citation17]. Further improvement in estimating the gas behavior of MIMAS-MOX fuel is, thus, expected by introducing explicit treatment of the three regions.
Note that the contribution of local FGR increase, which would be achieved by an explicit treatment of the original matrix region with a Pu content of ~8% to the total FGR, should be partially canceled because the local FGR from the explicitly treated depleted U agglomerate region would become low. It would also be helpful for refining the gas behavior analysis in such a heterogeneous system by considering that the neutronics aspect that initially depleted the U agglomerate region has almost no Pu content but can receive some burnup because of Pu buildup, while the Pu content in initially Pu-rich regions is to be depleted with burnup extension. In fact, shows that the ratio of the end local burnup between Pu-spot to matrix region is about 3, while it is 2 according to the PIE data by Kitano [Citation10], namely the actual ratio gradually changed from about 3 to 2 through the irradiation period. Jernkvist et al. treated this burnup behavior by calculating consumption of fissile materials in Pu-spot and matrix region [Citation9], which is not the case of the present work. This limitation of modeling may in some conditions become significant as the local burnup is directly related to the produced fission gas amount. The limitation seems, however, somewhat compensated in the present work by the sensitivity analysis in terms of already given in . The ratio of local burnup between the two regions becomes about 2.2 in the analysis when Pu content of Pu-spot is varied to 19%. This change resulted in variation of FGR by approx. 1% at the end of IFA-626, and the effect is hardly seen at the end of IFA-702.
Koo et al. [Citation8] pointed that the effective size of Pu-spot should be larger by the dimension of recoil range (~5–10 µm) and only small fraction of generated fission gas atoms remains inside in the case of small Pu-spots. For the MIMAS-MOX fuel analyzed in the present work, volume fraction of small Pu-spots of ~10 µm is less than 1% and the rest ~18% of larger Pu-spots is thought to dominate the fission gas behavior. The impact of increase in effective Pu-spot sizes by fission recoil can be estimated through the sensitivity to VR as its surrogate. For instance, when we simulate the effect of recoil on the small Pu-spots of 1% volume fraction by treating them as a part of matrix region and the effect of recoil on the rest larger Pu-spots of ~18% volume fraction by increasing VR, the corresponding calculation condition is achieved by increasing VR by about 13% and decreasing WR by about 2%. The resultant FGR becomes lower by about 0.6% at the end of IFA-626 and becomes higher by about 0.7% at the end of IFA-702: only minor impacts have been observed for the specific irradiation test cases.
The present model does not address the fission gas migration process from the Pu-spot region to the free volume via matrix region, which was raised by Guerin et al. [Citation1] as a question through observation of the microstructure of various MOX fuels but just ignores the possible interference by the matrix region. However, in the light of the fact the apparent FGR enhancement observed in IFA-626 and −702 is still underestimated even by the present model, which should rather tend to overestimate the impact of heterogeneity by simple treatment of local burnup and recoil range as discussed above, such an interference effect on gas migration from the Pu-spot seems to have been minor at least in the specific condition of IFA-626 and IFA-702. More extensive analyses on various irradiation tests for the MIMAS-MOX fuels using this heterogeneous model should enable determining the design factors and irradiation conditions for which we should further address modeling factors such as interference by matrix region, recoil, diversion of fissile materials from the Pu-spot, and so on.
By focusing again on the steady-state irradiation period IFA-626, the FGR from MIMAS-MOX fuel is, to some degree, underestimated, while the estimation for the SBR-MOX fuel is fine (). Because the effects of heterogeneity, namely different grain sizes and local burnups, have already been considered, one reason for the difference in the estimative performance observed between the MIMAS-MOX and the SBR-MOX cases could be intrinsic differences in fission gas migration or release kinetics in the Pu-spot, with a markedly high burnup and Pu content, from other regions with less Pu content. It is then appropriate that specific model parameters are applied to the Pu-spot, instead of applying common model parameters with regions with less Pu content, as done in this work. More extensive analyses on various irradiation tests for MIMAS-MOX fuels using this heterogeneous model should also enable determining the Pu-spot-specific model parameters, such as effective diffusion coefficients for gas atoms, gas bubbles, and vacancies, and their dependencies on local burnup.
6. Conclusion
The new FGR model explicitly treating heterogeneity in the pellet microstructures of MOX fuels, including MIMAS-MOX, was implemented in the FEMAXI-8 software and confirmed effective for improving FGR estimation and investigating the respective fission gas behaviors in the Pu-spot and matrix region by applying the model to the irradiation IFA-626 and IFA-702 tests. The new heterogeneous microstructure model can accommodate other MOX fuels as long as their initial microstructure data are known. The presented approach for treating heterogeneity is simple and easily applicable to other fuel performance software that currently adopt a single fuel grain for a given fuel element. It will benefit their analyses, specifically in such irradiation conditions as IFA-626, where FGR from MIMAS-MOX fuel is higher than the relatively homogeneous MOX fuel, despite its lower heat rate. A close comparison of post-irradiation gas inventories calculated using the heterogeneous model with those quantified by SIMS suggests that the left underestimation of FGR during the ramp irradiation period, IFA-702, is, to some extent, attributable to the treatment of the matrix region and depleted U agglomerate region in the simulation that homogenized the two regions, unlike the explicitly modeled Pu-spot. Further validation work with various types of MOX fuels and irradiation conditions must be conducted for a more critical assessment of the validity of the model concept, determining better model parameters and factors that could be specific to the Pu-spot and the interference by matrix region, and applying the heterogeneous model to accident conditions such as LOCA and RIA.
Acknowledgments
The authors would like to thank Nuclear Regulation Authority for providing detailed experimental data of IFA-626 and IFA-702.
Disclosure statement
No potential conflict of interest was reported by the author(s).
References
- Guerin Y, Noirot J, Lespiaux D, et al. Microstructure evolution and in-reactor behavior of MOX fuel. Proceedings of the ANS International Topical Meeting on LWR Fuel Performance; 2000 Apr -1310; Utah, (USA).
- White RJ, Fisher SB, Cook PMA, et al. Measurement and analysis of fission gas release from BLFL’s SBR MOX fuel. J Nucl Mater. 2001 Feb;288:43–56.
- Geelhood KJ, Luscher WG, Raynaud PA, et al. FRAPCON-4.0: a computer code for the calculation of steady-state, thermal-mechanical behavior of oxide fuel rods for high burnup. US: Pacific Northwest National Laboratory; 2015. (PNNL-19417).
- Porter IE, Geelhood KJ, Colameco DV, et al. FAST-1.0: a computer code for thermal-mechanical nuclear fuel analysis under steady-state and transients. US: Pacific Northwest National Laboratory; 2020. (PNNL-29720).
- Lassmann K, Schubert A, Van Uffelen P, et al. Transuranus Handbook version “v1m1j06”. EU: European Commission, Joint Research Center, Institute for Transuranium Elements; 2006.
- Ishida M, Korei Y. Modeling and parametric studies of the effect of Pu-mixing heterogeneity on fission gas release from mixed oxide fuels of LWRs and FBRs. J Nucl Mater. 1994 Jan;210:203–215.
- Billaux M, van Vliet J. Impact of fuel heterogeneities on fission gas release for LWR U-Pu mixed oxide fuels. Res Mechanica. 1986;17:41–47.
- Yang-Hyun K, Byung-Ho L, Jin-Sik C, et al. Modeling and parametric studies of the effect of inhomogeneity on fission gas release in LWR MOX fuel. Ann Nucl Energy. 2002 Feb;29:271–286.
- Jernkvist LO. A model for fission gas release from mixed oxide nuclear fuel. SKI Rep. 2007 Dec;2008:30.
- Kitano K, Akiyama H, Nakae N. A methodology to predict a fission gas release ratio of MOX fuel with heterogeneous microstructure. J Nucl Sci Technol. 2017 Aug;54:1190–1200.
- Udagawa Y, Yamauchi A, Kitano K, et al. Development of fuel performance code FEMAXI-8 -Model improvements for light water reactor fuel analysis and systematic validation-. Japan: Japan Atomic Energy Agency; 2019. (JAEA-Data/Code 2018-016).
- Nakae N, Akiyama H, Miura H, et al. Thermal property change of MOX and UO2 irradiated up to high burnup of 74 GWd/t. J Nucl Mater. 2013 Mar;440:515–523.
- Nakae N, Miura H, Akiyama H, et al. Fission gas release of MOX irradiated to high burnup. Proc. Topfuel-2012; 2012 Sep 2-6; Manchester (UK).
- Nakae N, Akiyama H. MOX irradiation test up to high burnup. Proc. Topfuel-2015; 2015 Sep 13-17; Zurich (Switzerland).
- Schneider CA, Rasband WS, Eliceiri KWNIH. Image to ImageJ: 25 years of image analysis. Nat Methods. 2012 June;9:671–675.
- Udagawa Y, Mihara T, Taniguchi Y, et al. The effect of base irradiation on failure behaviors of UO2 and chromia-alumina additive fuels under simulated reactivity-initiated accidents: a comparative analysis with FEMAXI-8. Ann Nucl Energy. 2020 Dec;139:107268.
- Udagawa Y, Amaya M. Model updates and performance evaluations on fuel performance code FEMAXI-8 for light water reactor fuel analysis. J Nucl Sci Technol. 2019 Mar;56:461–470.
- Suzuki M, Saito H, Udagawa Y. Light water reactor fuel analysis code FEMAXI-7; model and structure. Japan: Japan Atomic Energy Agency; 2013. (JAEA-Data/Code 2013-005).
- Khvostov G, Mikityuk K, Zimmermann MA. A model for fission gas release and gaseous swelling of the uranium dioxide fuel coupled with the FALCON code. Nucl Eng Des. 2011 Aug;241:2983–3007.
- Matthews JR, Wood MH. A simple operational gas release and swelling model: II. Grain boundary gas. J Nucl Mater. 1980 Mar;91:241–256.
Appendices
Appendix A.
Original FGR model of intra-granular gas behavior
The FEMAXI-8 intra-granular fission gas migration model assumes that fission gas atoms generated from fission reactions are first dissolved in a fuel grain and some precipitate as intra-granular gas bubbles. The dissolved gas atoms migrate toward the grain boundary by concentration-gradient-driven diffusion. The model also assumes that the fuel grain is spherical and applies Speight’s equation (Equation A-1) to the spherical coordinate system. Here, the equilibrium between gas atom trapping by intra-granular bubbles and gas atom re-dissolution into solid phase is considered. The boundary condition of Equation (A-1) is determined by the type of fuel grain, which is Rgrain or Rgrain2.
where
c: The number of gas atoms (Xe and Kr) dissolving in solid matrix per unit volume of the fuel element
D: Diffusion coefficient of gas atoms
g: Rate of trapping gas atoms by intra-granular bubbles
b′: Rate of re-dissolution of gas atoms into solid phase
m:The number of gas atoms in bubbles per unit volume of fuel element
β: Generation rate of gas atoms per unit volume of fuel element
: Fuel crystal grain radius
The gas atoms generation rate in a fuel element () β is defined as
where
: Fission gas generation rate per unit length of a fuel element
: The Avogadro constant
: Outer radius of a fuel element
: Inner radius of a fuel element
Y: Fission yield of fission gas (Xe + Kr) = 0.3
:
: Heat generation density profile function radially
: Average heat generation density of an axial segment
: Energy generated per fission, 200 MeV
Suzuki et al. [Citation18] provide a full description of the above parameters and meanings. The model also treats fuel grain growth accompanied by sweeping the gas atoms to the grain boundary. The re-dissolution of fission gas atoms from the grain boundary into grain is neglected in this study in accordance with the approach adopted by Khvostov et al [Citation19]. The number of gas atoms transported into the grain boundary is passed to the intergranular gas behavior calculation, for processing convenience described as the increment in gas concentration per unit area of the grain boundary ().
Figure A1. Overview of the Matthews’ model.
Appendix B.
Original FGR model of intergranular gas behavior
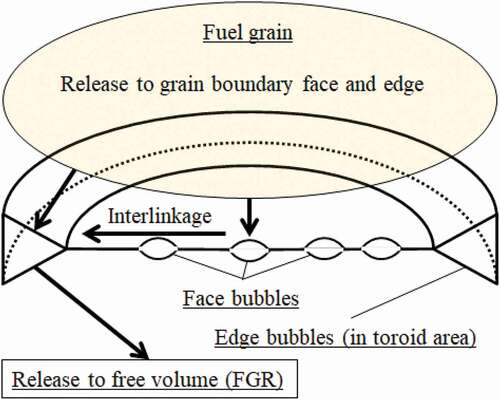
This study adopts Matthews’ model [Citation20] flavored with White’s model that was developed in FEMAXI-8 [Citation11] to treat intergranular gas behavior. illustrates gas bubbles modeled in the grain boundary.
This model simulates the time evolution of face and edge bubbles by considering their bubble porosity, bubble density, bubble length, interlinkage state, and fission gas amount retained in the bubbles. Equations (A-4)–(A-7) express the simulated gas bubble kinetics.
where
: The number of gas atoms in face bubbles per unit volume of fuel element
: The number of gas atoms in edge bubbles per unit volume of fuel element
: The change rate of the number of gas atoms flowing from the grain interior into the grain boundary
: The change rate of the number of gas atoms by interlinkage between face and edge bubbles
: The change rate of the number of gas atoms by edge porosity growth
: The change rate of the number of gas atoms by forming the path that connects to free volume
: Face bubble porosity per unit volume of fuel element
: Edge bubble porosity per unit volume of fuel element
: The change rate of the total volume fraction for grain boundary porosity
: Effective flow rate of volume from the face bubbles to the edge
: The change rate of the volume fraction of porosity by switching partial gas flow into face bubbles to edge bubbles because of progress of interlinkage
X: Occupancy ratio of edge porosity for all porosity in the grain boundary
F: Fraction of bubbles on grain face interlinked to the edge
E: Fraction of edge porosity connected to a free volume
Most parameters appearing on the right hand side of Equations (A-4)–(A-7) depend on ,
,
, or
(Y. Udagawa et al. [Citation11] provide a full description). The gas supply term
is calculated as
where
: The rate of gas atom transport into the grain boundary per unit area of grain boundary
: The area of grain boundary per unit volume of fuel element
The number of released fission gas atoms from the grain boundary per unit volume of fuel element () is defined as the difference between the gas supply rate (
) and the change of existing gas atoms in the grain boundaries (Equation A-10) and is evaluated in each time step.
The evaluated is converted into the gas amount released from a fuel element (
), which is then summated in all fuel elements (Equations A-11 and A-12).
where
: The number of released gas atoms from the fuel element
: The volume of the fuel element
: The released gas atoms from the fuel stack.