
 ?Mathematical formulae have been encoded as MathML and are displayed in this HTML version using MathJax in order to improve their display. Uncheck the box to turn MathJax off. This feature requires Javascript. Click on a formula to zoom.
ABSTRACT
We have constructed a computational scheme to obtain energy spectra of reactor antineutrinos, including the inverse -decay process through which they were to be detected. The antineutrino spectra from all the fission products were calculated based on the gross theory of
-decay. This data was combined with an inventory of fission products obtained by burnup calculations, and then multiplicity and reactor antineutrinos spectra were obtained by a summation calculation. We compared aggregate antineutrino spectra emitted from four major actinoids
, and
calculated in this work with experimental values. We found that those obtained by using Fission-Product Yield (FPY) data of JENDL-5 could reproduce the measured data better than or almost equivalently with those obtained with FPY data of other recent nuclear data libraries. Then, we proposed a new method of nuclear safeguards by using reactor antineutrinos; namely, we found that changes in the number and energy spectra of reactor antineutrinos were strongly correlated with burnup and fissile composition of light-water reactors.
1. Introduction
Nuclear reactors are vital sources of energy for many countries around the world. However, they also pose a significant security risk, as they can be used to produce nuclear weapons. Nuclear safeguards are a set of measures designed to prevent the diversion of nuclear material from peaceful uses to weapons purposes. Nuclear reactors produce antineutrinos as a byproduct of the nuclear fission reaction that takes place inside the reactor core as a result of decay of fission products (plus a small contribution of
decay of actinoids). The antineutrino is a neutral particle with no electric charge, which interacts with materials only via weak interaction. Therefore, the surrounding materials are almost transparent to antineutrinos, which makes antineutrinos generated inside the reactor travel (almost) freely outside the reactor, where it is detected by the inverse betadecay (IBD) reaction. In this manner, the antineutrinos can act as potential messengers to transfer information, such as fissile material composition, to outside.
The number of antineutrinos produced by a nuclear reactor is proportional to the power output of the reactor. This means that the antineutrino flux, or the number of antineutrinos passing through a unit area per unit time, is also proportional to the power output of the reactor. Therefore, antineutrinos can be used to monitor the operation of nuclear reactors. Furthermore, the antineutrino flux from a reactor decreases as the fuel is burned up, as will be shown later, so it is possible to determine the burnup by measuring the antineutrino flux. Antineutrinos can also be used to verify that a reactor is operating safely and that there is no unauthorized diversion of nuclear material.
Inverse beta decay (IBD) is a very rare process, so it is difficult to be detected. However, IBD has been the only concrete way to detect antineutrinos from nuclear reactors, though an alternative method using coherent elastic neutrino-nucleus scattering was recently proposed. For decades, nuclear reactor monitoring with the antineutrino spectra via the IBD process has been intensely studied in KamLAND [Citation2], Daya Bay [Citation3], RENO [Citation4], etc. Continuous measurements in those facilities have elucidated that the spectrum of antineutrinos emitted from a reactor depends on different types of fissile material. That is, we can use the antineutrinos not only to monitor the operating status of nuclear reactors but also to identify the type of fissile material in a reactor.
In the early 1960s, Masami Yamada developed a gross theory of decay based on very general properties of nuclei. This theory was able to successfully predict the half-lives of
decay for many nuclei over the nuclear chart. The development of the gross theory [Citation5] was a major breakthrough in the study of antineutrino spectra. It allowed us to make accurate predictions of the antineutrino flux from nuclear reactors. In the years since the original theory was published, there have been a number of refinements to the gross theory. These refinements have been made possible by the development of more accurate nuclear data libraries and by the improvement of experimental techniques. As a result, the accuracy of the gross theory has improved significantly, and it is now used as a standard tool for the calculation of antineutrino spectra.
In this paper, we first show how the computational scheme of the antineutrino spectra has been constructed in Section 2. We utilize the gross theory of beta-decay to derive the electron and antineutrino spectra emitted from and
in nuclear reactors by aggregating the contributions from numerous decaying fission products. Then, the validity of fission product yield (FPY) data adopted in JENDL-5 [Citation1] by comparison with the other nuclear data libraries with respect to the lepton spectra in Section 3. We also clarify which fission products mainly contribute to each spectrum focusing on the case with JENDL-5 FPY. Then, we propose a new method for remote monitoring of nuclear reactors in Section 4. For practical use, we examine the usefulness of a proposed method by applying it to Mihama and standard fast reactors. In Section 5, we summarize those discussions and describe the future subject.
2. Computational method of antineutrino spectra
Reactor antineutrinos are produced by the decay of fission products (FPs) in a nuclear reactor core. The antineutrinos emitted from these FPs are of interest because they can be used to study the properties of the reactor core. In this section, we describe the computational method we have constructed for the calculation of aggregate antineutrino spectra, then we validate those calculations using FPY data of JENDL-5, comparing the lepton spectra of representative nuclear data libraries with experimental data.
To calculate the concentration of individual FP nuclides in the reactor core, we need to use the coupled equations of burnup of the nuclear fuel for each decay chain as follows,
Here, the concentration of the -th nuclide at time
is denoted by
. The decay constant, neutron capture cross-section, neutron flux are denoted by
, respectively.
represents a fraction of producing isotope
for the unit decay of isotope
, while
represents a fraction of producing isotope
for a neutron capture of isotope
. The independent fission yield and the fission rate are denoted by
and
.
The antineutrino spectra can be calculated by summing up the contributions from all of the fission products.
where denotes spectra of antineutrios with energy
emitted from fission product species
, and is calculated as follows:
where integration with respect to the excitation energy of the daughter nucleus is carried out. The electron (
-ray) spectra can be calculated in the same manner as:
where
denotes the electron spectra from individual fission product . Here, an energy conversation condition
should be borne in mind.
In the above equations, is the normalization denominator,
is the coupling constant multiplied by the multiplicity and a factor depending on the forbiddenness of the transition,
and
are the antineutrino and electron energy, respectively. The symbol
denotes the linear momentum of electrons, which is related to the electron energy
as
with the electron rest mass. The symbols
and
indicate the Fermi function and the shape factor, respectively, of the
-type transition. The strength function
is the absolute square of the transition matrix element multiplied by the final level densities described as a continuous function of the excitation energy of the daughter nucleus
.
Our previous works concluded that the odd-odd fission product nuclides are very important to explain the antineutrino spectra from fissioning materials, though the agreement between the predicted half-lives of odd-odd nuclei and the experiments is not always reasonable. In order to complement Gross Theory Generation-2 (GT2), we applied the treatment proposed by Nakata-Tachibana-Yamada (NTY) for the odd-odd nuclides to GT2 [Citation6]. The NTY treatment takes advantage of the well-defined and
structures of the lowest two states of even-even daughters. With respect to beta transitions from odd-odd nuclei to the ground and the first excited states of their even-even daughters, the transition types are clearly classified by selection rules.
Present calculations based on GT2+NTY [Citation7] use the fission product yields of three representative libraries, JENDL-5 [Citation1], JEFF-3.3 [Citation8], and ENDF/B-VIII [Citation9]. For decay data, we adopt the JENDL-4.0 [Citation10] in this paper because we found antineutrino spectrum derived by JENDL-4.0 agrees very well with that calculated by JENDL-5. For fissioning materials, we assume four actinoids, and
.
3. Aggregate antineutrino and electron spectra
displays the aggregate antineutrino and electron spectrum when is irradiated with thermal neutrons for 12 h. This irradiation time corresponds to the measurement period of the reference experiment. The three lines for antineutrinos and electrons correspond to results calculated by the FPY data from JENDL-5 (green), ENDF/B-VIII (blue) and JEFF-3.3 (red). The experimental values for the antineutrinos compared with the calculated values were not directly measured but were converted from the electron spectrum to the energy spectrum of the anti-electron neutrinos.
Figure 1. Energy spectra of antineutrinos and electrons from thermal-neutron induced fission of irradiated for
. The triangles for the electron spectra are experimental results by Schreckenbach et al. [Citation11], and corresponding ones for the antineutrinos are those converted from their data by them. Green dashed- and solid-lines are electron and antineutrino spectra calculated with FPY data of JENDL-5, while the blue ones are those calculated with FPY data of ENDF/B-VIII and those shown by red curves are calculated with FPY data of JEFF-3.3. In all these calculations, decay data were taken from JENDL-5. The data for electrons were multiplied by a factor of 0.1.
![Figure 1. Energy spectra of antineutrinos and electrons from thermal-neutron induced fission of 235U irradiated for 12h. The triangles for the electron spectra are experimental results by Schreckenbach et al. [Citation11], and corresponding ones for the antineutrinos are those converted from their data by them. Green dashed- and solid-lines are electron and antineutrino spectra calculated with FPY data of JENDL-5, while the blue ones are those calculated with FPY data of ENDF/B-VIII and those shown by red curves are calculated with FPY data of JEFF-3.3. In all these calculations, decay data were taken from JENDL-5. The data for electrons were multiplied by a factor of 0.1.](/cms/asset/6b940850-d472-46fa-a1ee-9490705923a2/tnst_a_2276418_f0001_oc.jpg)
shows that the calculated spectra using JENDL-5 for FPY agree well with experimental data. In particular, we can see a significant improvement in the energy above , which was an important issue in improving the accuracy of JENDL-4.0. Now, the antineutrino spectra with JENDL-5 provide reasonable accuracy, better or almost equivalent, compared with other major nuclear data libraries.
shows how individual FP nuclide contributes to the overall antineutrino spectrum for thermal neutron induced fission of , which was calculated by using the FPY data of JENDL-5. This figure exhibits that a large number of nuclides contribute to the overall spectrum shape in the low energy region, while a few specific nuclides,
,
Figure 2. Energy spectrum of antineutrinos from thermal neutrons irradiating for 12 hours. The calculations were done with FPY data of JENDL5. Numerous lines below the total spectrum show contributions from different FP nuclide.
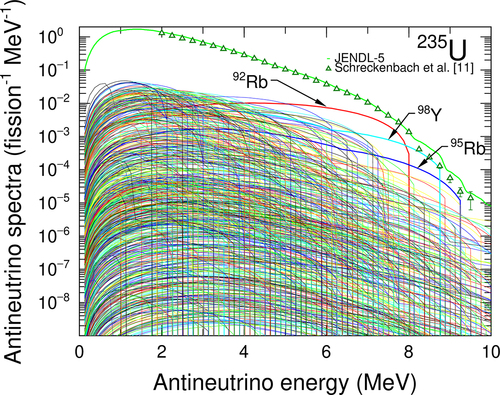
, and
, are dominant in the region above
. Since the gross theory of
decay is a theory to give the average trend of the
decay, the difference between the experimental values and the calculated values in the energy region above
may be due to the dominance of the small number of specific nuclides. At least, the aggregate antineutrino spectra above
may depend strongly on the theory which was used to calculate the antineutrino spectra from these nuclei. These three nuclei are also the main contributors to the antineutrino spectrum in ENDF/B-VIII and JEFF-3.3, but their yields vary slightly between libraries. These are nuclides with large
values and small fission yields, so the yield differences between nuclear data libraries are significant. It is difficult to prepare nuclear data by experimental data since the lifetimes of these nuclides are very short. However, it is important to focus on these specific nuclides in order to improve the accuracy of the aggregate antineutrino spectra.
shows the differences in the energy spectra for 42 h of irradiation of with fast neutrons using FPY data from three representative nuclear data libraries, JENDL-5 (green), ENDF/V-III (blue) and JEFF-3.3 (red). In all calculations including what follows, we used JENDL-5 for decay data. Assumed irradiation time is taken from that of the experiment being compared. The triangles are the electron and antineutrino spectra measured and reported by Haag et al., where the latter was converted from the former. From this figure, it is clear that the difference in the calculated values depending on the libraries are smaller than the case for
, and results of all libraries can describe the measured (and converted) electron and antineutrino spectra equally well. Even though not shown here, we found that JENDL-4.0 and JENDL-5 lead almost the same anti-neutrino spectrum for
with only an extremely small difference at
to
, but JENDL-5 gives better reproducibility of the experimental values in all energy regions.
Figure 3. Energy spectra of antineutrinos and electrons from fast-neutron induced fission of irradiated for
. Meanings of the symbols and lines are the same as fig. 1, while the experimental electron and converted antineutrino spectra are results reported by Haag et al. [Citation12].
![Figure 3. Energy spectra of antineutrinos and electrons from fast-neutron induced fission of 238U irradiated for 42h. Meanings of the symbols and lines are the same as fig. 1, while the experimental electron and converted antineutrino spectra are results reported by Haag et al. [Citation12].](/cms/asset/917a566b-e3a8-4d6b-8a82-9d4173bd9045/tnst_a_2276418_f0003_oc.jpg)
shows the contribution of the spectra of individual FP nuclide to the overall spectrum for the case of FPY data of JENDL-5. We can see that , and
are
Figure 4. The energy spectrum of antineutrinos from fast neutrons irradiating for 42 hand its composition from individual FP nuclide.
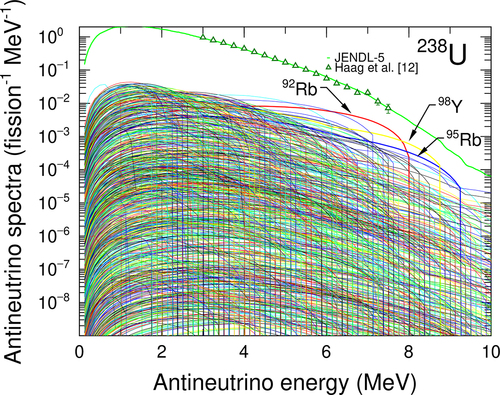
dominant in the energy region above for
, as in the case of
. In the energy region above
, a few specific nuclides are dominant, so it is necessary to consider the uncertainty of the gross theory.
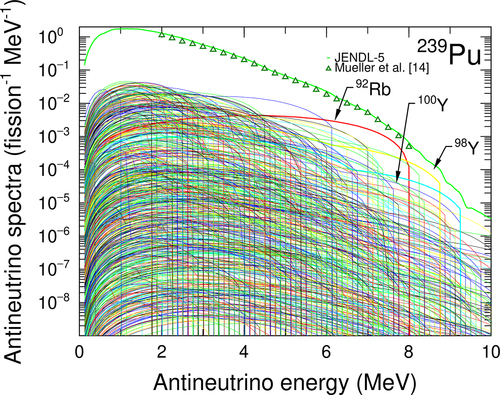
compares calculated aggregate electron and antineutrino energy spectra for thermal neutron induced fission of to the value of the reference experiment by Feilitzsch et al. where a sample was irradiated for 1.5 days. The up triangles represent the experimental electron spectrum, while the three symbols showing the antineutrino spectra are the ones converted from the electron spectrum by different authors. We know from this figure that the calculated overall spectral shape are in good agreement with measured and converted ones, but all the calculations overestimate the both spectra from 2 to around 6
.
Figure 5. Energy spectra of antineutrinos and electrons from fast-neutron induced fission of irradiated for 1.5 days. Meanings of the symbols and lines are the same as fig. 1, while the experimental electron spectrum was taken from [Citation13], and converted antineutrino spectra were taken from
.
![Figure 5. Energy spectra of antineutrinos and electrons from fast-neutron induced fission of 239Pu irradiated for 1.5 days. Meanings of the symbols and lines are the same as fig. 1, while the experimental electron spectrum was taken from [Citation13], and converted antineutrino spectra were taken from 13−15.](/cms/asset/f48ac415-68c9-4e61-9801-91ef0fc8ffa3/tnst_a_2276418_f0005_oc.jpg)
shows the contribution of each nuclide to the overall spectrum of the JENDL5 spectrum shown in . As can be seen from Fig. and
are dominant, as in the cases of
and
. However, in the case of
also contributes significantly to the spectrum, replacing
, which was larger in the cases of
and
.
Figure 6. Energy spectrum of anti-electron neutrinos from thermal neutrons irradiating for 1.5 days including contributions from
nuclides.
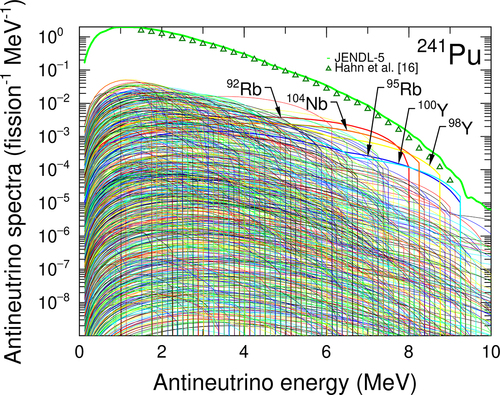
shows the energy spectra of electrons and antineutrinos emitted from after irradiation with thermal neutrons for 1.8 days. The irradiation time was referenced to the experimental value. The triangles for the antineutrinos are the evaluation values of the antineutrino energy spectrum by the group of Hahn et al. As can be seen from , there are slight differences in the calculation results of JENDL-5, ENDF/B-VIII, and JEFF-3.3 above
. They are all in uniform overestimation compared to the measured and converted spectra.
Figure 7. Energy spectra of antineutrinos and electrons from thermal-neutron induced fission of irradiated for 1.8 days. Meanings of the symbols and lines are the same as fig. 1, while the experimental electron and converted antineutrino spectra were taken from ref [Citation14].
![Figure 7. Energy spectra of antineutrinos and electrons from thermal-neutron induced fission of 241Pu irradiated for 1.8 days. Meanings of the symbols and lines are the same as fig. 1, while the experimental electron and converted antineutrino spectra were taken from ref [Citation14].](/cms/asset/bf315bf1-a3eb-465c-8329-39f8b8d7f5e0/tnst_a_2276418_f0007_oc.jpg)
illustrates the contributions of all nuclides that form the overall spectrum for the case of JENDL-5. From , it is evident that, in the case of , five nuclides, namely
, and
, are particularly dominant in the energy range above
. While the contributions of
and
isotopes were observed in other cases, the contribution of
is a unique characteristic observed only for
.
Figure 8. Energy spectrum of antineutrinos from thermal neutrons irradiating for 1.8 days including contributions from FP nuclides.
Based on the antineutrino spectra discussed above, we display the expected spectrum of aggregate antineutrinos measured by an off-site detector by the IBD reaction in . Red, blue, magenta, and green symbols (converted data) and lines (calculation) represent , and
, respectively. Lines are the results of our calculation, and various symbols are results converted from measured electron spectra [Citation11–16]. We have used the IBD cross-section taken from results calculated by Strumia’s group [Citation17]. We notice that the agreement of the calculated and converted spectra for
and
is quite good: they agree to the accuracy of
in almost all the energy region. This agreement may show that the basic database we have prepared and used (antineutrino spectrum from each FP nucleus, decay data and FPY data) can describe the aggregate emission of antineutrinos from these nuclei reasonably well. On the other hand, the antineutrino spectra for
and
are overestimated by about
near the peak of these spectra. We have not figured out the reason of this discrepancy yet. We cannot simply decrease the antineutrino spectra from each FP since it will deteriorate the good agreement we have for
and
. We understand that this is an important issue in this field if we are going to use reactor antineutrinos for application purposes. At the same time, we hope that similar experiments to be repeated since there is only one set of such data coming from the same research group. Nevertheless, the overall ‘shape’ of the antineutrino spectra is reproduced quite well by our calculation. Therefore, in what follows, we adopted our
Figure 9. Energy spectra of aggregate antineutrinos detected via IBD reaction from thermal-neutron induced fission of and fast-neutron induced fission of
. Lines denote the results of our calculation, while symbols are those converted from measured electron spectra [Citation11–16]. See text for details.
![Figure 9. Energy spectra of aggregate antineutrinos detected via IBD reaction from thermal-neutron induced fission of 235U, 239,241Pu and fast-neutron induced fission of 238U. Lines denote the results of our calculation, while symbols are those converted from measured electron spectra [Citation11–16]. See text for details.](/cms/asset/fb994155-aaf8-461e-94c9-6ff234debdee/tnst_a_2276418_f0009_oc.jpg)
calculation in discussing a novel possibility of applying reactor antineutrinos for real-time remote monitoring of nuclear reactors for nuclear safeguards.
4. Proposal of a novel method for application of reactor antineutrinos to real-time, remote monitoring of reactor status
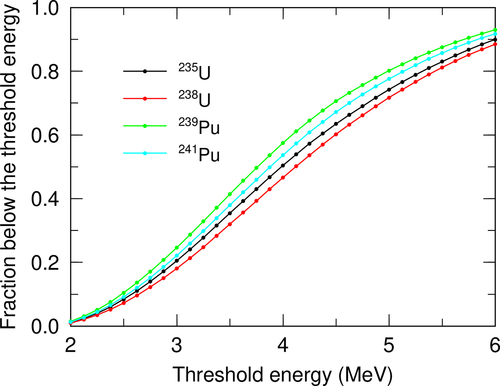
In the previous section, we have examined the energy spectra of FPs generated when irradiating a single fissioning nuclide with neutrons, as well as the energy spectra of antineutrinos emitted from that specific nuclide. However, actual nuclear reactor fuels contain multiple nuclides with different compositions, and the observed energy spectrum of emitted antineutrinos is a superposition of these nuclides with appropriate weights. To consider a new probe for identifying the nuclides inside the reactor based on the observed spectrum from the IBD reaction in neutrino detectors, we focused on the fact that the energy spectrum shape shown in is specific, even though they seem to be similar, to each nuclide as follows. divides the spectrum at each energy value shown on the -axis in and indicates the ratio of the area below that energy value (a) to the area above it (b), represented as a/(a+b) relative to the total area of a. From , it is evident that the ratio of the area below each energy value in the energy spectrum detected by the IBD reaction differs depending on the fissioning nuclide, with a significant difference observed especially around
. We consider the fraction of antineutrinos detected by the IBD reaction with energies below
as an indicator for new nuclide identification. We call this fraction below
as
index. In the following, we discuss the application of this new probe to remote monitoring of light-water and fast reactors as examples.
Figure 10. Fractions of the energy spectrum of antineutrinos detected by the inverse beta decay reaction below threshold energy shown by the horizontal axis.
We investigate the possibility of using the ratio proposed in the previous section as a new probe for real-time monitoring of nuclear reactors by reactor-fuel burn-up simulations using ORLIBJ40 [Citation18].
First, we focus on the Mihama-3 reactor [Citation19] as a standard light-water reactor. We show the calculation results assuming 600 days of continuous operation with the initial fuel composition of Mihama-3 (see ). shows the relationship between burn-up (blue line, right vertical axis), fissile to
ratio (red line, left vertical axis), and burn-up days in the upper panel; and the number of anti-electron neutrinos detected by IBD reaction (blue line, right vertical axis), and the fraction of anti-electron neutrinos with energy below
(
index, red line, left vertical axis) in the bottom panel. Here, we chose the fraction below
because the difference between the fractions of each nuclide at the fraction of interest near
is the largest, as shown in . As the burnup increases, the ratio of
fissile to
increases, while conversely, the number of antineutrinos decreases. The number of antineutrinos decreases because
is generated from
as it captures neutrons, since
generates more energy per fission than
so
can maintain the same reactor power with fewer number of fission, and
releases fewer neutrinos per fission.
Figure 11. Top panel: Burnup (blue line, right axis) and the ratio of fissile to
(red line, left axis) as functions of burnup days (horizontal axis) with the initial fuel and burnup conditions of Mihama-3 reactor; bottom panel: the number of antineutrinos detected by IBD reaction (blue line, right axis) and the
index (red line, left axis) as function of burnup days for the same condition as the top panel.
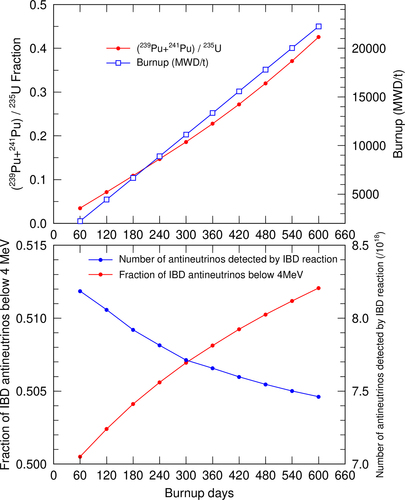
Table 1. Initial fuel composition of Mihama-3.
The measurement of the number of antineutrinos using the IBD reaction can be performed from a distant place or with a small detector because only the number needs to be measured. However, we need to keep measuring the number of neutrinos to know if it is increasing or decreasing. In contrast, the index that we have newly proposed can be used to monitor the operating status of a nuclear reactor, even without continuous measurement. However, a sufficient number of counts is required, and the measurement must be performed close to the reactor, with a large detector or multiple detectors. Our estimates show that, for example 10,000 counts are required to monitor the operating status with
accuracy of
, and 40,000 counts are required to achieve
accuracy.
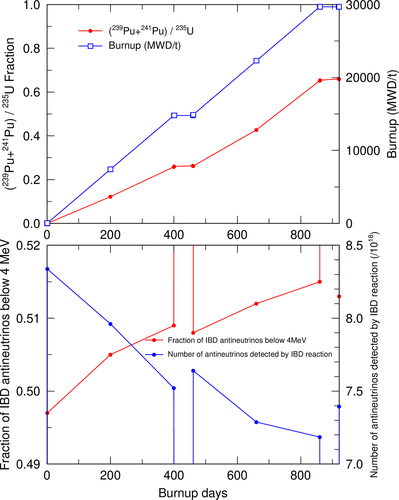
For a more realistic discussion, we assume a cycle of 400 days of operation and 60 days of shutdown, assuming the fuel composition of Mihama-3. In this calculation, fuel replacement during the shutdown period is not considered. Following the above discussion, we investigated how the burnup and fissile fraction to
changes with the burnup days, and how the number of antineutrinos detected by the IBD reaction and the
index change with the increase in the burnup days. They are results for the cases where nuclear fuel is not replaced during the reactor shutdown period. If, however, the nuclear fuel is dislocated during the shutdown period, and new fuel is loaded, the number of antineutrinos and the
index recovers their initial values at the begining of the 2 nd cycle, which are big changes. We can detect such change of ‘undeclared’ change of nuclear fuel if it happens by monitoring antineutrinos, either by the number or by the
index, which makes this method a ‘novel’ technique of nuclear safeguards.
shows that the fissile fraction of to
increases during reactor operation, as
is accumulated inside the reactor. The change in this fraction is very small during the shutdown. The
index increases during reactor operation and approaches unity during the reactor is shut down. On the other hand, the number of antineutrinos detected by the IBD reaction decreases during reactor operation and is two orders of magnitude smaller during shutdown.
Figure 12. The top panel shows the relationship between the burnup (blue line, right axis) and the Pu fissile fraction (red line, left axis) as functions of the burnup day for a cycle of 400 days of operation and 60 days of shutdown, assuming the fuel composition of Mihama-3. The bottom panel shows the relationship between the burnup day and the number of antineutrinos detected by IBD reaction (blue line, right axis), and the fraction of antineutrinos with energy below index, red line, left axis).
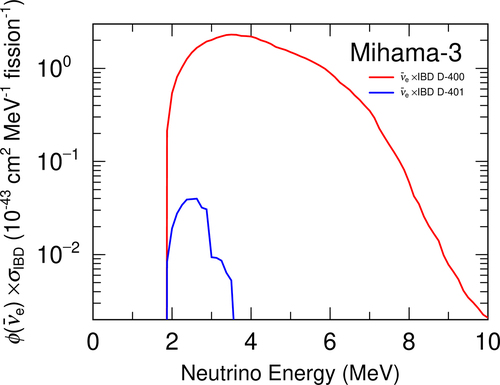
Next, we investigated the difference in the energy spectra of anti-electron neutrinos detected by the IBD reaction during the operation (400th day) and shutdown (401st day) of the reactor to verify the possibility of distinguishing the operating status using the probe proposed here. As shown in , antineutrinos with energies up to are detected during operation, while antineutrinos with energies up to
are emitted after one day of shutdown. This means that almost all of the antineutrinos in the shutdown state have energies below
, so the fraction of anti-electron neutrinos below 4
detected by the IBD reaction approaches unity. This is because beta decay occurs mainly in nuclei with long half-lives and small
values during the shutdown, and as a result, the position of the peak of the energy spectrum moves to the low-energy side. Thus, we can easily estimate the reactor operation status by observing the IBD spectrum. Furthermore, we can derive the fuel utilization and approximate composition of nuclear fuel when we simultaneously use the new probe and the results of ORLIBJ40.
Figure 13. Energy spectra of antineutrinos detected by the IBD reaction on 400th day of a continuous operation (last day of the operation) shown by a red curve and on 401st day, after the first day of a shutdown period shown by the blue curve.
We have shown that the newly proposed parameter (the ratio) can be used to monitor nuclear reactors in light water reactors. Next, to verify whether the same method can be applied to fast reactors, we performed burning calculations using the ORLIBJ40 code, as before. Then, we obtained the number and energy spectrum of anti-electron neutrinos emitted from fission products. Based on those results, we investigated the relationship between reactor neutrinos and the operating status and fuel composition of the reactor.
The results of the calculation assuming continuous operation for 600 days with the initial fuel composition (see ) are shown in , excluding day 0, to investigate the behavior of the parameters with the increase in burn-up days after the start of operation. shows the relationship between the burn-up days and burn-up (blue line, right vertical axis), the ratio of fissile to
(red line, left vertical axis) in the upper panel; and the relationship between the burn-up days and the number of anti-electron neutrinos detected by the IBD reaction (blue line, right vertical axis), and the
index in the lower panel.
Figure 14. Top panel: burnup (blue line, right axis) and the ratio of fissile to
(red line, left axis) in a fast reactor as function of burnup days assuming a continuous operation for 600 days; bottom panel: number of antineutrinos detected by the IBD reaction (blue line, right axis), and the fraction of antineutrinos with energy below
(red line, left axis) as functions of burnup days.
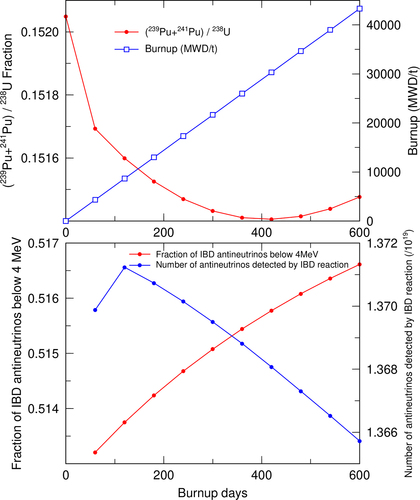
Table 2. Initial fuel composition of a standard fast reactor.
The number of antineutrinos is increasing once and then decreasing. In the case of fast reactors, unlike the results of light water reactors, the behavior of the number of antineutrinos after IBD and the ratio of to
is more complex than in light water reactors.
In conclusion, the procedure verified in this study can be applied to fast reactors to confirm the operating status, but it is considered to be more difficult than in light water reactors to identify the internal fuel composition. This is because the behavior of each parameter becomes complex due to the complexity of the initial fuel composition, and the change in the number of antineutrinos with the increase in burn-up days is small. The situation in MOX light water reactors with -containing initial loaded fuel is also expected to be similar to that in fast reactors.
5. Conclusion
Antineutrinos being produced in a reactor core can be used to monitor the operating status of the reactor from the outside. Currently, the Inverse Beta Decay (IBD) process is expected as a means of detecting them. In this paper, we developed a calculation method for reactor neutrino generation and evaluated the use of nuclear data in this calculation, examining its applicability to remote reactor monitoring. As for the research methodology, we first calculated the neutrino spectra from each fission product (FP) using the gross theory of decay and databased them. We then compared the experimental data with simplified calculations based on
to verify their validity. Next, we calculated the energy spectra after the IBD reaction to simulate the spectra in neutrino detectors. We discussed the methodology to identify the dependence on the fission nuclides that serve as neutrino sources. Finally, we performed burnup calculations using ORLIBJ40 based on the initial fuel composition and power of both a light-water reactor and a fast breeder reactor. We determined the burnup and fissile ratio as functions of burnup days. Simultaneously, based on the resulting FP compositions, we conducted summation calculations. We calculated the time variation of the number of reactor neutrinos observed in the IBD reaction and the proportion of neutrinos below
and examined their correlation. We also discussed the applicability of this calculation to remote monitoring of reactors.
As a result, in the calculation of reactor neutrino generation, it was found that specific nuclides such as , and
dominate the contribution to the overall spectrum above
. When comparing the calculation results among the three libraries, JENDL-5, JEFF-3.3, and ENDF/B-VIII, differences arise above
. At higher energies, nuclides with large
values but small fission yields make up a significant portion, and the discrepancies in yield between libraries are substantial. On the other hand, in long-term irradiation, we found that nuclides with small
values and long half-lives accumulate, influencing the low-energy region of neutrino counts and neutrino spectra. The dissipated energy by neutrinos from the reactor was approximately
higher than the value in JENDL-5. Furthermore, in the calculation simulating the energy spectrum detected through the IBD reaction, we identified the dependence of fission nuclides on the proportion of antineutrinos with energy below
. This method could be employed to assess fuel composition. In the evaluation of the feasibility of applying this to remote monitoring of reactors, we found that for a light-water reactor equivalent to the Mihama-3 reactor using new uranium fuel, it is theoretically possible to roughly estimate the operational status, fuel composition and burnup level of the reactor based on the observed values of reactor neutrino emission and the proportion below
. However, for a fast breeder reactor, we concluded that while it is possible to assess the operational status, determining the fuel composition is challenging.
Recently, the Coherent Elastic Neutrino-Nucleus Scattering () [Citation20] emerged as a novel and viable process applicable to monitoring reactors which has more than a hundred times larger cross-section than the IBD process. In a year or two, a fully novel cryogenictype
detector, which is much more compact than the IBD detectors, will be installed and tested in a French power site with two
PWRs [Citation21]. The cryogenic
detector, which is free from any energy threshold as in the IBD one, may possibly open a new horizon of remote monitoring of reactor operation although it is still now in its infancy. We are sure that a similar procedure in this paper is applicable for the
detectors, and we need there to re-examine all the processes given in section 3 taking careful attention to the antineutrinos with energy below
where the current IBD detectors have no sensitivity.
Disclosure statement
No potential conflict of interest was reported by the author(s).
References
- Iwamoto O, Iwamoto N, Kunieda S, et al. Japanese evaluated nuclear data library version 5: JENDL5. J Nucl Sci Tech. 2023;60(1):1. doi: 10.1080/00223131.2022.2141903
- Araki T, Enomoto S, Furuno K, et al. Experimental investigation of geologically produced antineutrinos with KamLAND. Nature. 2005;436(7050):499–503. doi: 10.1038/nature03980
- Bay Collaboration D, Balantekin, A., Band, H. Measurement of the reactor antineutrino flux and spectrum at Daya Bay. Phys Rev Lett. 2016;116(6):061801. doi: 10.1103/PhysRevLett.116.061801
- Yoon S, Seo H, Atif Z, et al. Measurement of reactor antineutrino flux and spectrum at RENO. Phys Rev D. 2021;104(11):L111301. doi: 10.1103/PhysRevD.104.L111301
- Takahashi K, Yamada M. Gross theory of nuclear β-decay. Prog Theor Phys. 1969;41(6):1470–1503. doi: 10.1143/PTP.41.1470
- Yoshida T, Tachibana T, Hagura N et al. Composition, decomposition and analysis of reactor antineutrino and electron spectra based on gross theory of β-decay and summation method. Prog Nucl Energy. 2016;88:175–182. doi: 10.1016/j.pnucene.2015.12.012
- Yoshida T, Tachibana T, Okumura S, et al. Spectral anomaly of reactor antineutrinos based on theoretical energy spectra. Phys Rev C. 2018;98(4):041303(R. doi: 10.1103/PhysRevC.98.041303
- Plompen AJM, Cabellos O, Saint Jeanet C D, et al. The joint evaluated fission and fusion nuclear data library, JEFF-3.3. Euro Phys J A. 2020;56(7):181. doi: 10.1140/epja/s10050-020-00141-9
- Brown DA, Chadwick MB, Capote R, et al. ENDF/B-VIII.0: the 8th major release of the nuclear reaction data library with CIELO-project cross Sections, new standards and thermal scattering data. Nucl Data Sheets. 2018;148:1–142. doi: 10.1016/j.nds.2018.02.001
- Shibata K, Iwamoto O, Nakagawa T, et al. JENDL-4.0: a new library for nuclear science and engineering. J Nucl Sci Tech. 2011;48(1):1. doi: 10.1080/18811248.2011.9711675
- Schreckenbach K, Colvin G, Gelletly W, et al. Determination of the antineutrino spectrum from 235U thermal neutron fission products up to 9.5MeV. Phys Lett B. 1985;160(4):325–330. doi: 10.1016/0370-2693(85)91337-1
- Haag N, Gütlein A, Hofmann M, et al. Experimental Determination of the antineutrino spectrum of the fission products of U 238. Phys Rev Lett. 2014 Mar;112(12):122501. doi: 10.1103/PhysRevLett.112.122501
- Huber P. Determination of antineutrino spectra from nuclear reactors. Phys Rev C. 2011;84(2):024617. doi: 10.1103/PhysRevC.84.024617
- Hahn AA, Schreckenbach K, Gelletly W, et al. Antineutrino spectra from 241Pu and 239Pu thermal neutron fission products. Phys Lett B. 1989;218(3):365–368. doi: 10.1016/0370-2693(89)91598-0
- von Feilitzsch F, Hahn AA, Schreckenbach K. Experimental beta-spectra from 239Pu and 235U thermal neutron fission products and their correlated antineutrino spectra. Phys Lett B. 1982;118(1):162–166. doi: 10.1016/0370-2693(82)90622-0
- Mueller TA, Lhuillier D, Fallot M, et al. Improved predictions of reactor antineutrino spectra. Phys Rev C. 2011 May;83(5):054615. doi: 10.1103/PhysRevC.83.054615
- Strumia A, Vissani F. Precise quasielastic neutrino/nucleon cross section. Phys Lett B. 2003;564(1–2):42–54. doi: 10.1016/S0370-2693(03)00616-6
- Okumura K, Sugino K, Kojima K, et al. Set of ORIGEN2 cross section libraries based on JENDL-4.0; ORLIBJ40. 2013; JAEA-Data/Code 2012–032.
- Dissolution Study Group in the Department of Chemistry. Dissolution Studies of Spent Nuclear Fuels. Tokai Research Establishment, Japan Atomic Research Institute. JAERI-M 91-010. 1991.
- Akimov D, Albert JB, An P, et al. Observation of coherent elastic neutrino-nucleus scattering. Science. 2017;357(6356):1123–1126. doi: 10.1126/science.aao0990
- Angloher G, Ardellier-Desages F, Bento A, et al. Exploring $\hbox {CE}\nu \hbox {NS}$ with NUCLEUS at the Chooz nuclear power plant. Eur Phys J C. 2019;79(12):1018. doi: 10.1140/epjc/s10052-019-7454-4