
 ?Mathematical formulae have been encoded as MathML and are displayed in this HTML version using MathJax in order to improve their display. Uncheck the box to turn MathJax off. This feature requires Javascript. Click on a formula to zoom.
Abstract
The main purpose of the study was the development of the Sensory Processing Sensitivity Questionnaire (SPSQ), designed to measure Sensory Processing Sensitivity, defined as a person’s sensitivity to subtle stimuli, the depth with which these stimuli are processed, and its impact on emotional reactivity. The item pool generated for the development of the SPSQ consisted of 60 items. After exploratory factor analysis, 43 items remained, divided into six specific factors: (1) Sensory Sensitivity to Subtle Internal and External Stimuli, (2) Emotional and Physiological Reactivity, (3) Sensory Discomfort, (4) Sensory Comfort, (5) Social-Affective Sensitivity, and (6) Esthetic Sensitivity. Confirmatory factor analysis indicated that a higher-order bi-factor model consisting of two higher-order factors (a positive and negative dimension), a general sensitivity factor and six specific factors had the best fit. Strong positive associations were found between Emotional and Physiological Reactivity, the negative higher-order dimension, and Neuroticism; the same holds for the association between Esthetic Sensitivity, the positive higher-order dimension, and Openness. Emotional and Physiological Reactivity and the negative higher-order dimension showed clear associations with clinical outcomes. The relationships between the SPSQ and similar scales – the Highly Sensitive Person Scale and part of the Adult Temperament Questionnaire – were in the expected direction.
Introduction
According to Evans and Rothbart (Citation2008, p. 109) the term sensitivity has multiple meanings: “In everyday language, sensitivity can refer to neuroticism/negative emotionality (‘Don’t be so sensitive.’), sensitivity concerning the needs of others, sensitivity related to imagination, aesthetics, and the arts, and general sensory sensitivity.” This description closely resembles the different meanings the noun ‘sensitivity’ has according to the Cambridge dictionary of English language: (a) an ability to understand what other people need, and be helpful and kind to them; (b) the quality of being easily upset by the things people say or do; (c) having a strong physical reaction to something; and (d) the ability to record small changes. In their review article, Aron et al. (Citation2012) distinguish between four key aspects of a general trait of (sensory) sensitivity, namely (a) behavioral inhibition, i.e. being reflective, and taking more time to process sensory stimuli before taking action; (b) sensitivity to (mostly subtle) sensory stimuli; (c) depth of processing of sensory stimuli; and (d) emotional or physiological reactivity. As to the interrelation between these four characteristics, which according to Aron et al. are at the core of high sensory processing sensitivity, it is assumed that being more aware of (subtle) sensory (internal as well as external) stimuli, being more reflective, and processing these stimuli more profoundly, (potentially) leads to higher emotional and physiological reactivity.
In their analysis of adult temperament data, Evans and Rothbart (Citation2007) made a distinction between sensory discomfort (as part of negative affect, reflecting unpleasant affect) resulting from sensory stimulation (i.e. visual, auditory, tactile, or olfactory-gustatory stimulation), and sensory sensitivity (also called orienting sensitivity). Within the concept of sensory (or orienting) sensitivity, they distinguished between neutral perceptual sensitivity (awareness of low intensity internal and external stimuli), affective perceptual sensitivity (awareness of the emotional valence or tone of a broad range of stimuli such as music, colors, pictures, or facial expressions), and associative sensitivity (spontaneous thoughts or images that are not directly triggered by anything happening in the environment). As neutral perceptual sensitivity is related to both internal and external stimuli, a further distinction can be made between a higher awareness of (or sensitivity to) internal bodily sensations, also called bodily awareness (Mehling et al., Citation2009) on the one hand, and subjective sensitivity to different types of external sensory stimuli such as light, smells, heat, and cold (Dixon et al., Citation2016) on the other hand. Furthermore, in addition to esthetic sensitivity, social sensitivity can be distinguished within the dimension of affective perceptual sensitivity (Evans & Rothbart, Citation2007).
To measure differences in sensory processing sensitivity (SPS), Aron and Aron constructed the 27-item Highly Sensitive Person Scale (HSPS); their initial analyses showed that the items of the HSPS reflect a single factor. Subsequent studies resulted however in a variety of factor solutions, ranging from 1 to 5 factors (Konrad & Herzberg, Citation2017), with the most frequently found solution being a three-factor structure, consisting of ‘Esthetic Sensitivity’, ‘Low Sensory Threshold’, and ‘Ease of Excitation’ (Smolewska et al., Citation2006). A comparison of the description of the concept of SPS by Aron et al. (Citation2012) but also by Evans and Rothbart (Citation2007), and the content of the HSPS, which was developed to measure this concept, reveals that the focus of the HSPS is mainly on the more negative aspects of SPS, namely the display of strong physiological and emotional responses to high-intensity stimuli and the need to withdraw when one is confronted with too many stimuli at the same time. Items related to a higher sensitivity to subtle stimuli, as well as items reflecting sensitivity to the emotional valence of stimuli are however scarce. In line with this, Greven et al. (Citation2019) also point out that, with the exception of the Esthetic Sensitivity dimension, the vast majority of HSPS items are negatively formulated items, reflecting the negative consequences of a deeper processing of sensory stimuli. According to these authors, this implies that the HSPS is insufficient to cover the various aspects of high sensitivity, especially in people without mental health problems or psychopathology.
The present study consists of two sub-studies. The aim of Study 1 (main study) was to develop (step 1) and validate (step 2) a questionnaire, the Sensory Processing Sensitivity Questionnaire (SPSQ), that maps not only negative but also a broad range of positive aspects of Sensory Processing Sensitivity (SPS). The purpose of Study 2 was to investigate how the newly developed questionnaire relates to existing questionnaires that also measure Environmental Sensitivity, more specifically the Highly Sensitive Person Scale (HSPS) and (a number of subscales of) the Adult Temperament Questionnaire (ATQ).
Study 1 (main study)
Step 1: Development of the sensory processing sensitivity questionnaire (SPSQ): structure and item generation
When developing the SPSQ, the aim was to measure a broader spectrum of both positive and negative dimensions of SPS. Based on the theoretical and empirical literature, the following dimensions were used as a basis for the development of this more comprehensive questionnaire: (1) Emotional and physiological reactivity, (2) Sensory discomfort, (3) Sensitivity to (mostly subtle) sensory stimuli, including low intensity internal and external stimuli, (4) Affective sensitivity consisting of esthetic sensitivity, social-affective sensitivity, and associative sensitivity, and (5) Sensory comfort, the positive counterpart of Sensory Discomfort.
The following dimensions were (hypothetically) considered to be negative dimensions of high sensitivity:
(1) Emotional and Physiological reactivity
To measure emotional and physiological reactivity, the eight items with the highest loading on the ‘Ease of Excitation' subscale of the Dutch version of the HSPS (De Gucht, Wilderjans, Garcia, & Maes, manuscript submitted for publication) were included. An additional, newly formulated item, representing increased susceptibility to stress, was added (number of items: 9).
(2) Sensory discomfort
Regarding Sensory Discomfort, the six items from the corresponding subscale of the ATQ (Evans & Rothbart, Citation2007) were included, together with four items of the HSPS measuring the dimension Low Sensory Threshold (Smolewska et al., Citation2006). (number of items: 10)
The following dimensions were (hypothetically) considered to be positive dimensions of high sensitivity:
(3) Sensitivity to (subtle) sensory stimuli, consisting of (a) internal (bodily) stimuli and (b) external stimuli
With respect to (a), sensitivity to internal, bodily stimuli, a number of questionnaires have been developed that tapped in a more generic way into different aspects related to awareness of internal bodily sensations and processes. Two of these measures were found to have adequate psychometric properties (see Mehling et al., Citation2009 for a review), namely the Body Awareness Questionnaire (Shields et al., Citation1989) and the Body Consciousness Scale (Miller et al., Citation1981). Upon closer inspection, only the Body Consciousness Scale (Miller et al., Citation1981), and more specifically one of its subscales, called ‘Private Body Consciousness’, concerns subjective awareness of and attention to normal bodily sensations and changes in bodily states. As we were primarily interested in a brief measure that nevertheless adequately covers sensitivity to a number of subtle bodily sensations, we decided to only include this subscale, consisting of five items in our item pool. Two items from the Highly Sensitive Person Scale (HSPS) (Aron & Aron, Citation1997) concerning sensitivity to pain and to the effects of caffeine, were also added. (number of items: 7)
Regarding (b), perceptual sensitivity to subtle external stimuli, a 6-item subscale of the Adult Temperament Questionnaire (ATQ; Evans & Rothbart, Citation2007) that specifically focuses on sensitivity to subtle visual, auditory, tactile, and gustatory-olfactory stimuli was included in the item pool. In addition, one item from the HSPS (Aron & Aron, Citation1997), aimed explicitly at awareness of subtleties in the environment, was also included. Finally, two items from the Sensory Hypersensitivity Scale developed by Dixon et al. (Citation2016), measuring sensitivity to heat and cold, were also included. (number of items: 9)
(4) Affective sensitivity, consisting of (a) Esthetic, (b) Social-affective, and (c) Associative sensitivity.
Regarding (a), Esthetic Sensitivity, the Affective Sensitivity subscale of the ATQ (Evans & Rothbart, Citation2007) consisting of five items, was included, supplemented by four items of the HSPS (Aron & Aron, Citation1997) that also pertain to the dimension of esthetic sensitivity. (number of items: 9)
With respect to (b), Social-affective Sensitivity, the six items comprised in the corresponding subscale of the ATQ (Evans & Rothbart, Citation2007) were included; to this an HSPS item was added that also measures a social aspect of sensitivity (number of items: 7)
Finally, to cover (c), Associative Sensitivity, two items from the ATQ (Evans & Rothbart, Citation2007) were included in our item pool.
(5) Sensory comfort or pleasure
As the positive counterpart of Sensory Discomfort was not covered by any of the afore-mentioned questionnaires, a new scale was developed, focusing on sensory comfort (pleasure) related to perceptual, esthetic, and social stimuli (number of items: 7).
The items of the ATQ and HSPS were retrieved from the validated Dutch version of these questionnaires (Hartman et al., Citation2001; De Gucht, Wilderjans, Garcia, & Maes, manuscript submitted for publication). The items from the Private Body Consciousness Scale (Miller et al., Citation1981) and Sensory Hypersensitivity Scale developed by Dixon et al. (Citation2016), were translated into Dutch making use of translation and back translation.
The item pool generated for the development and validation of the SPSQ ultimately consisted of a total of 60 items. In the appendix you can find an overview of these items, the concept they were hypothesized to measure, and the scale from which the item originated or whether it was a newly formulated item.
The response categories for answering the different statements were based on the categories used for the HSPS; respondents had to indicate for each statement to what extent this statement applied to them on a seven-point scale (1 = Not at all, …, 7 = Completely).
Step 2: Validation of the sensory processing sensitivity questionnaire
Methods
In order to validate the newly developed SPSQ, data were collected in a large sample of the general population. To examine convergent, discriminant, and concurrent validity, a number of additional measurement instruments were included in the study (described under 'measures').
Subjects
The inclusion criteria for participating in the validation study were being 18 years of age or older and having a good command of the Dutch language. The participants were recruited by means of advertisements on the social media of two Dutch online magazines and by distributing flyers in supermarkets, gyms, fitness centers, pharmacies, and general practices. The information that was included in the flyers and calls for participation in the study on social media was entitled ‘Sensitive? Quickly aroused? Or not at all?’ and stated that the purpose of the study was to better understand the concept of environmental sensitivity and to look at the differences that exist between people who are more sensitive to environmental stimuli and those who are less sensitive to these stimuli. In addition, an interview with the first author for a Dutch news website (NU.nl), containing a direct link to the survey, also contributed to data collection. At the time data were collected, NU.nl was the largest Dutch news website in terms of audience (Verenigde Internet Exploitanten, n.d.). It is a general news website that focuses on a wide range of subjects, namely political and economic news, sports, media and culture. The interview itself was mainly intended to explain the concept of Sensory Processing Sensitivity and to dispel a number of misconceptions on the subject.
After reading the information letter and signing the informed consent, participants could click a link to the online survey (Qualtrics). The study protocol was approved by the ethics committee of the Institute of Psychology of Leiden University (approval number: CEP17-0523/213). Data are available from the first author upon reasonable request.
In total 13,158 subjects from the general population started filling in the questionnaire between March 2018 and April 2019. Respondents who did not sign the informed consent, did not complete all the SPSQ items, completed the questionnaire faster than nine minutes, or had little or no variation in responses were excluded. The analyses were performed using the remaining 10,291 valid responses. This number of participants yields an excellent power for conducting the Exploratory Factor Analysis (EFA), Confirmatory Factor Analysis (CFA) and Structural Equation Modeling (SEM) analyses (Wolf et al., Citation2013). Respondents were on average 41.63 years old (range 18-87; SD = 12.76); 63.3% were female (n = 6,515). Detailed demographic information of the sample is presented in .
Table 1. Demographics in the exploratory, confirmatory and total sample.
Additional measures
The Big Five Inventory (BFI) was used to measure Big Five personality dimensions (McCrae & Costa, Citation1987). The BFI consists of 44 statements, each one preceded by: “I see myself as someone who … worries a lot” (Neuroticism), “…is talkative” (Extraversion), “…does a thorough job” (Conscientiousness), “…is helpful and unselfish with others” (Agreeableness), and “…likes to reflect, play with ideas” (Openness). Statements are rated on a scale from 1 (strongly disagree) to 5 (strongly agree). The Dutch BFI was shown to have good psychometric properties (Denissen et al., Citation2008). In the current sample, Cronbach’s alpha was .85 for Neuroticism; .81 for Extraversion; .77 for Conscientiousness; .71 for Agreeableness; and .80 for Openness.
Fatigue was measured using the Multidimensional Fatigue Inventory (MFI). The MFI is a self-report measure that consists of five scales, namely General Fatigue, Physical Fatigue, Reduced Activity, Reduced Motivation and Mental Fatigue. For the purpose of the study, only the dimension General Fatigue, consisting of four items, was used. The items are scored on a 5-point Likert scale, ranging from ‘yes, that is true' to ‘no, that is not true'. Validity and reliability of the scale were found to be satisfactory to good (Smets et al., Citation1995). Higher scores represent higher fatigue levels. Cronbach’s alpha was .84 in the present study.
The Patient Health Questionnaire-15 (PHQ-15) was used to assess the presence and severity of 15 physical complaints such as stomach pain or dizziness (Kroenke et al., Citation2002). Subjects are asked to rate the severity of these symptoms in the last four weeks using a 3-point Likert scale ranging from ‘not bothered at all’ to ‘bothered a lot’. A higher score is indicative of more physical complaints. The internal consistency and validity of the PHQ-15 was found to be good (Kroenke et al., Citation2002). In the current study, Cronbach’s alpha was .78.
The Patient Health Questionnaire-9 (PHQ-9) was used to assess depressive complaints. Each of the nine items of the PHQ-9 corresponds to one of the diagnostic criteria for Major Depression according to the DSM-V. Respondents have to indicate how often, over the past two weeks, they suffered from each of these depressive symptoms on a 4-point scale ranging from 'not at all' to 'almost every day'. The PHQ-9 is a valid and reliable measure of depression severity (Kroenke et al., Citation2001).
Anxiety was measured using the Generalized Anxiety Disorder −7 (GAD-7), consisting of seven items representing different symptoms of generalized anxiety. Respondents have to indicate to what extent they suffered from each of these symptoms in the past two weeks, using a 4-point scale ranging from 'not at all' to 'nearly every day'. The GAD-7 has good validity and reliability (Spitzer et al., Citation2006). In the present study, Cronbach’s alpha was .85 for the PHQ-9 and .89 for the GAD-7.
Statistical analysis
To determine (and confirm) the dimensionality and factorial structure of the initial SPSQ pool of 60 items, Exploratory Factor Analysis (EFA) and Confirmatory Factor Analysis (CFA) were performed respectively. In order to ensure independence of the EFA preceding the CFA analysis (e.g. see Fokkema & Greiff, Citation2017), the overall sample (N = 10,291) was randomly split in two subsamples, called an exploratory (n = 5,147) and a confirmatory subsample (n = 5,144). A two sample t-test and an (adjusted-Fisher) exact test (Lydersen et al., Citation2009), showed that the randomization procedure was successful for age, t(10,267) = −0.13, p = .90, and gender (p = .64).
EFA was conducted on the initial item pool, using the exploratory sample. The number of factors to extract was determined by Parallel Analysis and Velicer’s MAP test (Hayton et al., Citation2004; Horn, Citation1965). An oblique rotation method (oblimin) was used to interpret the loadings of the EFA solution. To investigate the variance of each item accounted for by the extracted factors, communalities were inspected. Subsequently, items were omitted if an item displayed either (a) low communality (h2i < .20), and (b) one or more high cross-loadings (> .32), or (c) all (absolute) loadings under .32 (Tabachnick & Fidell, Citation2001). Items were excluded step-by-step and after an item was deleted, the EFA (with rotation) was refitted to the remaining items.
The factorial structure resulting from the EFA was subsequently evaluated by CFA using the confirmatory sample, fitting a first-order CFA model. In this configuration, the factors were allowed to correlate as the EFA is based on an oblique rotation. Two additional nested hierarchical models were tested: (1) A bifactor model was fit to investigate whether the latent structure of the SPSQ reflects a general SPS factor next to the specific factors identified by EFA (see above), and (2) a higher-order bifactor model consisting of two higher-order factors representing a positive and negative dimension of SPS on top of the general SPS factor, and the specific factors. Furthermore, we calculated Cronbach’s alphas on the total sample as the measure of internal consistency reliability.
As Mardia’s test (Mardia & Zemroch, Citation1975) rejected multivariate normality of the total item set and considering the ordinal nature of the data, Weighted Least Squares Means and Variance adjusted (WLSMV) estimation was used as the appropriate estimator of the models. A comparison between the three models was based on a number of fit indices. As the χ2 goodness-of-fit test and the χ2-difference LR-ratio test are sensitive to sample size (Marsh et al., Citation1988), models were also compared on the Comparative Fit Index (CFI), the Root Mean Square Error of Approximation (RMSEA) and the Standardized Root Mean Square Residual (SRMR) as absolute measures of fit. For the incremental fit index, |ΔCFI| > .01 was chosen as a marker for a substantial difference in model fit between the two nested models (Chen, Citation2007). The relationships between items and factors within each model were evaluated by inspecting the sign, magnitude and statistical significance of the standardized loadings (λ). In the first-order CFA model, this information was used to investigate the factorial structure obtained with EFA within the confirmatory sample. The fit and loadings in the bifactor model were assessed to evaluate whether items contributed to their specific first-order factor and the general SPS factor simultaneously. In addition, the higher-order bifactor model investigated if a distinction can be made between a positive and negative dimension of SPS while controlling for a general factor and specific first-order factors.
Following the confirmatory analysis, the SPSQ (sub)scale scores were calculated by summing the relevant items. With respect to discriminant and convergent validity, the correlations of SPSQ (sub)scale scores with the Big Five Personality factors were computed and inspected in the total sample. Concurrent validity was established by examining bivariate correlations between the SPSQ (sub)scales on the one hand and a number of clinical variables (measuring fatigue, physical complaints, depression, and anxiety) on the other hand. In addition, the proportion of explained variance of these clinical outcomes by the SPSQ scales was examined by calculating the (multiple) R-squared (R2) based on a series of regression models. Measurement invariance was tested across gender, living situation, highest completed education, and employment status, as metric and scalar equivalence should be tenable to be able to compare sum scores (Van de Schoot et al., Citation2012). A substantial change in model fit was considered when CFI decreased by more than .010, SRMR increased by .030 (for metric invariance) or .015 (for scalar invariance), and RMSEA increased by .015 (Chen, Citation2007). Provided that measurement invariance can be established, the cross-sectional scale scores of the SPSQ were compared across the measured sociodemographic groups. In accordance with Cohen (Citation1988), we used the R-squared and Eta-squared as measures of effect size and considered values of .02, .13 and .26 as ‘small’, ‘medium’ and ‘large’, respectively.
Data analysis was conducted using R version 4.0.2 (R Core Team, Citation2020); latent variable modeling/SEM was performed using the package ‘lavaan’ (Rosseel, Citation2012).
Results
Factor structure of the SPSQ scale
The Kaiser-Meyer-Olkin (KMO) Measure of Sample Adequacy (MSA) was .96, indicating that it is justified to perform Exploratory Factor Analysis (Kaiser, 1974). Of the initial item pool, 17 items were deleted due to low communalities, weak loadings or high cross-loadings (see the appendix for details). Parallel analysis on the remaining 43 items indicated a six-factor solution which explained 46.6% of the total variance (scree-plot presented in the supplement materials). Velicer’s MAP test indicated a solution with five factors (MAP = .00592), closely followed by a solution with six factors (MAP = .00589). Although from a statistical perspective both the five- and six-factor solution were acceptable, the six-factor solution was preferred on substantive grounds (i.e. factor interpretation)Footnote1.
An overview of the standardized loadings, communalities, and MSA for each item, as well as the Variance Accounted For (VAF) by each factor of the final EFA solution is presented in . Of the eight original dimensions (described in step 1), only six were retained. In particular, the items measuring sensitivity to subtle external and internal sensory stimuli (SES and SIS, see the appendix), loaded on one factor (instead of two separate factors), labeled Sensory Sensitivity to Subtle Internal and External Stimuli (SIES, 6 items); Associative Sensitivity collapsed with the Social-Affective factor (SAS, 8 items). The remaining factors were Esthetic Sensitivity (AS, 5 items), Sensory Discomfort (SD, 8 items), its positive counterpart Sensory Comfort (SC, 5 items) and Emotional and Physiological Reactivity (EPR, 11 items).
Table 2. Standardized loadings and communalities of the exploratory factor analysis on 43 items extracting 6 factors (after oblique rotation) in the exploratory sample (N = 5,147).
Confirming the factorial structure with CFA
A correlated six factor structure consisting of 43 items was evaluated by CFA (see ). The CFI was acceptable, though at the lower boundaries of adequacy, and both SRMR (< .08) and RMSEA (< .06) indicated a good model fit (Hu & Bentler, Citation1999). All factor loadings were above a magnitude of .42 and significant. The mean loadings were highest for SD ( = .74, range = .55-.86), followed by AS (
= .74, range = .65-.80), SAS (
= .73, range = .65-.80), EPR (
= .72, range = .47-.84), SIES (
= .61, range = .54-.69) and SC (
= .55, range = .42-.75). The magnitude of the factor loadings of items adopted from the (translated) HSPS (
= .73, range = .47-.86) and ATQ (
= .72, range = .55-.82) were similar in strength.
Table 3. Fit indices for a six factor CFA, a bifactor, and a higher-order bifactor model in the confirmatory sample (N = 5,144).
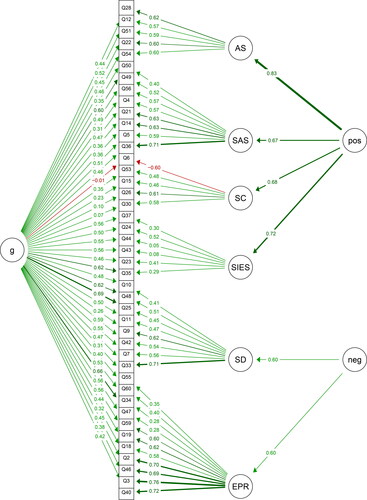
In the bifactor model, the goodness-of-fit decreased (ΔCFI = −.02; ΔSRMR = .010; ΔRMSEA = .011) compared to the 6-factor CFA model. To find out if the SPSQ consists not only of a general sensitivity factor and specific factors that each map a different aspect of Sensory Processing Sensitivity, but also of clearly distinguishable higher-order positive and negative dimensions, a higher-order bi-factor model was also tested. The higher-order bifactor model () shows favorable fit indices compared to the 6-factor model and bifactor model (see ). In the higher-order bifactor model, the positive standardized loadings of the factors EPR and SD (λ = .60) on the negative dimension of SPS were significant; loadings of the factors SIES (λ = .72), SC (λ = .68), SAS (λ = .67) and AS (λ= .83) were significant on the positive dimension of SPS. All standardized paths between the separate items and the general factor were significant ( = .46, min = .10, max = .69), except for two items of Sensory Comfort (item 30 “I can really enjoy a relaxing activity.” and the reversely stated item 6 “I find it hard to enjoy small or subtle things.”). Except for SIES, the standardized paths between the separate items and their specific factor were significant (|
| = .56, min = .28, max = .76). For the factor SIES, significant loadings were found for items 23, 24, 35 and 37 conveying an awareness of subtle external stimuli (e.g. “I often notice faint odors.”); for items measuring awareness of bodily sensations and processes (e.g. “I often feel my heart beating.”) loadings were lower, but still significant (items 43 and 44).
Figure 1. Standardized path coefficients of the higher-order bifactor model, including negative and positive aspect SPSQ in the confirmatory sample (N = 5144).
Note: SIES = Sensory Sensitivity to Subtle Internal and External Stimuli, EPR = Emotional and Physiological Reactivity, SD = Sensory Discomfort, SC = Sensory Comfort/Pleasure, SAS = Social-Affective Sensitivity, AS = Esthetic Sensitivity, g = general (SPSQ) factor, NEG = negative dimension of the SPSQ, POS = positive dimension of the SPSQ. Higher-order loadings on SD and EPR were constrained to be equal to avoid identification issues.
Reliability and convergent, discriminant and concurrent validity
In (Panel A), the mean, standard deviation and the internal consistency reliability of the scale scores are presented. The Cronbach’s alphas were good to excellent for all specific factors (α = .75−.90), with the exception of Sensory Comfort for which the internal consistency was lower (α = .62). The internal consistency of the positive dimension of the SPSQ (sum score of SIES, SC, SAS, AS) and the negative dimension of the SPSQ (sum score of EPR and SD) as well as the total scale score were excellent (α = .90−.93).
Table 4. Summary statistics, product-moment correlations with personality measures and between SPSQ (subscales).
To evaluate convergent and discriminant validity, the correlation matrix was checked for strong correlations between the SPSQ and Big-5 personality traits (, Panel B). The highest correlations were found between Emotional and Physiological Reactivity and Neuroticism (.70) on the one hand, and Esthetic Sensitivity and Openness (.60) on the other hand. Moderate correlations were found for Sensory Discomfort (Neuroticism); Emotional and Physiological Reactivity (Introversion); Sensory Sensitivity to Subtle Internal and External Stimuli, Sensory Comfort, and Social-Affective Sensitivity (Openness); and Sensory Comfort (Agreeableness). Conscientiousness was weakly correlated with each of the specific SPSQ factors and the SPSQ total score. The SPSQ total correlated most strongly with Neuroticism and Openness (.41 and .37, respectively). Neuroticism was mainly correlated with the negative dimension of the SPSQ (.58) and Openness with the positive dimension of the SPSQ (.53).
With respect to the inter-scale correlations (, Panel C), the subscale Sensory Sensitivity to Subtle Internal and External Stimuli had a strong positive relationship with the other subscales (with correlations around .50), except for Sensory Comfort (.24). Furthermore, strong positive correlations between Esthetic Sensitivity and Social-Affective Sensitivity (.61) and Emotional and Physiological Reactivity and Sensory Discomfort (.57) were found. Correlations between scales within the positive and negative dimensions of the SPSQ were moderate to large (.24−.61).
To address concurrent validity, correlations of the SPSQ with fatigue, physical complaints, depression, and anxiety are presented in . Emotional and Physiological Reactivity, the extent to which people are easily overwhelmed by sensory stimuli, showed the most prominent correlations with clinical outcomes (.38−.52). Sensory Sensitivity to Subtle Internal and External Stimuli and Sensory Discomfort showed a moderate relationship with physical complaints (.36 and .39, respectively). Sensory Comfort was negatively correlated with fatigue, physical symptoms, depressive complaints and anxiety (-.25 − -.10). The total SPSQ had moderate positive correlations with clinical outcomes (.26 − .39). The negative dimension of the SPSQ was more strongly related to clinical outcomes (all rs > .30) than the positive dimension of the SPSQ (all rs < .30).
Table 5. Concurrent validity: Bivariate correlations, standardized regression coefficients and explained variance of the relationships between (multiple) SPSQ subscales and clinical outcomes.
For each of the clinical outcomes, the total variance explained by the six specific SPSQ scale scores was substantially higher (ranging from a medium effect-size for Fatigue to a large effect-size for Anxiety; R2 =.17 −.33) than the variance explained by the positive and negative dimensions of the SPSQ (R2 = .13 −.21), which, in turn, was higher than the variance explained by the SPSQ total score (R2 = .07 −.16). These differences are especially large for psychological outcomes (Depression and Anxiety).Footnote2
Associations between the SPSQ and sociodemographic variables
Measurement invariance was tested across the sociodemographic groups. The results () show evidence for configural invariance as the models showed an acceptable fit (CFI > .90). For each of the sociodemographic groups, no substantial change in model fit was found when consecutively constraining the loadings (metric invariance) and item intercepts (scalar invariance) as the change in CFI, SRMR or RMSEA did not exceed the criteria suggested by Chen (Citation2007). This result indicates that composite scale scores across groups can be validly compared as metric and scalar measurement invariance was tenable. Subsequently, the associations between on the one hand the SPSQ total score, its subscales and higher-order (positive and negative) dimensions and on the other hand the socio-demographic variables were examined (see ). For gender, small effect sizes were found for SIES, EPR, SC, SAS, AS and the positive higher-order dimension; medium effect sizes were found for SD, the negative higher-order dimension, and the total score, with women scoring higher than men. Negligible effect sizes were found for living situation and highest completed education. Small effect sizes were found for employment status, where the highest sample means were found for the category 'homemaker'.
Table 6. Testing for measurement invariance across demographic groups (N = 10,291).
Table 7. Summary statistics for the subscales of the SPSQ, the two higher order dimensions, and the total score, broken down for the different subcategories of each of the sociodemographic variables. (N = 10,291).
Study 2
Methods
To investigate how the newly developed questionnaire relates to existing questionnaires that also measure (aspects of) Sensory Processing Sensitivity, a second sample from the general population was collected.
Subjects
The inclusion criteria were identical to Study 1. Study participants were recruited through invites to participate in the study posted on Facebook and LinkedIn. The information letter stated that the goal of the study was to compare different questionnaires that measure Environmental Sensitivity or similar temperamental characteristics. After reading the information letter and signing the informed consent, participants could click a link to the online survey (Qualtrics). The study protocol was approved by the ethics committee of the Institute of Psychology of Leiden University (approval number: 2021-07-13-V.M.J. de Gucht-V2-3305). Data are available from the first author upon reasonable request.
In total 1,001 subjects from the general population started filling in the questionnaire between July and September 2021. Respondents who did not sign the informed consent, did not complete all the SPSQ items, completed the questionnaire faster than seven minutes, or had little or no variation in responses were excluded. The analyses were performed using the remaining 814 valid responses. Respondents were on average 46.8 years old (range 18-78; SD = 10.83); 89.0% were female.
Measures
In addition to the SPSQ, respondents also completed the Highly Sensitive Person Scale and part of the Adult Temperament Questionnaire.
The highly sensitive person scale (HSPS)
The HSPS (Aron & Aron, Citation1997) measures high sensitivity and consists of 27 items evaluated on a 7-point scale (1= ‘not at all’, …, and 7= ‘extremely’). Example items are “Are you easily overwhelmed by strong sensory input?” and “Do you seem to be aware of subtleties in your environment?”. For the present study, the validated Dutch version of the HSPS was used (De Gucht, Wilderjans, Garcia, & Maes, manuscript submitted for publication). Both the total score of the HSPS and the scores on the three subscales Esthetic Sensitivity (AES), Low Sensory Threshold (LST), and Ease of Excitation (EOE) were taken into account (Smolewska et al., Citation2006). In the current study, the Cronbach’s alpha was .91 for the total score and varied between .72 (AES) and .84 (EOE) for the subscales.
The adult temperament questionnaire (ATQ)
The ATQ (Evans & Rothbart, Citation2007) is a self-report questionnaire measuring temperament in a broad sense and includes general constructs such as effortful control, negative affect, extraversion/surgency, orienting sensitivity, and affiliativeness. For the purpose of the present study, we used the Dutch version of the questionnaire (Hartman et al., Citation2001) and we only included the subscales related to Sensory Processing Sensitivity, namely Orienting Sensitivity (23 items), consisting of Affective Perceptual Sensitivity (11 items, e.g. “I tend to notice emotional aspects of paintings and pictures.” (esthetic) and “I am rarely aware of the moods of people around me.” (social)), Neutral Perceptual Sensitivity (six items, e.g. “I rarely notice the color of people’s eyes.”) and Associative Sensitivity (six items, e.g. “When I am resting with my eyes closed, I sometimes see visual images.”). In addition, the subscale Discomfort (six items, e.g. “I’m often bothered by light that is too bright.”) was included.
Respondents had to indicate for each statement to what extent this statement applied to them on a seven-point scale (1 = Not at all, …, 7 = Completely). In the present study, the Cronbach’s alphas ranged from .61 (Associative Sensitivity) to .86 (Orienting Sensitivity).
Statistical analyses
The higher-order bifactor model of Study 1 was fit to the data of Study 2 to confirm its factorial structure. Subsequently, bivariate correlations were calculated to examine the strength of the associations between the newly developed SPSQ and its subscales on the one hand, and the (subscales of the) HSPS (Aron & Aron, Citation1997; Smolewska et al., Citation2006) and five (sub)scales of the ATQ (Evans & Rothbart, Citation2007) on the other hand. The correlations were tested using z-transformed tests proposed by Zimmerman et al. (Citation2003), to correct for item-overlap.
Results
The fit of the higher-order bifactor model was similar to the findings in Study 1, χ2(812) = 2445.3, p < .001; CFI = .943; SRMR = .050; RMSEA = .050, 95% CI [.047, .052]. Strong correlations were found between the total SPSQ and the (subscales of the) HSPS (r = .66-.79). The total HSPS scale, as well as the subscales Ease of Excitation (EOE) and Low Sensory Threshold (LST), had strong correlations with the EPR, SD and the negative higher-order dimension of the SPSQ (r = .49-.83); moderate to strong correlations were found with AS, SAS, SIES and the positive dimension (r = .27-.52). Sensory Comfort had a moderate association with the esthetic (AES) HSPS subscale (r = .34), a weak association with the HSPS total (r = .13) and negligible associations with LST and EOE (r = .07 and r =.06 respectively). The esthetic subscale of the HSPS was strongly correlated with Esthetic Sensitivity (AS) of the SPSQ (r = .66) as well as the positive higher-order dimension of the SPSQ (r = .74).
The total SPSQ had strong correlations with the ATQ subscales (r = .61-.73) with the exception of Associative Sensitivity (r = .44). Orienting sensitivity as well as its subscales Affective Perceptual Sensitivity and Neutral Perceptual Sensitivity had strong correlations with SIES, SAS and AS (r = .50-.87), as well as the positive dimension of the SPSQ (r = .70-.86). The Discomfort scale of the ATQ was strongly related to EPR, SD and the negative dimension of the SPSQ (r = .52-.97); no correlation was found with the SC scale of the SPSQ (r = −.01, ns). An overview of the correlations is presented in .
Table 8. Associations between the Sensory Processing Sensitivity Questionnaire (SPSQ), Highly Sensitive Person Scale (HSPS) and the Adult Temperament Questionnaire (ATQ), N = 814.
General discussion
The purpose of the present study was twofold, namely (1) the development and validation of a more comprehensive questionnaire to measure Sensory Processing Sensitivity (SPS), the Sensory Processing Sensitivity Questionnaire (SPSQ) and (2) comparing the newly developed questionnaire to existing instruments that also measure Environmental Sensitivity.
The original item pool generated for the development of the SPSQ consisted of 60 items. After exploratory factor analysis, 43 items remained, divided into six specific factors. On substantive grounds, these factors were labeled as (1) Sensory Sensitivity to Subtle Internal and External Stimuli (SIES), (2) Emotional and Physiological Reactivity (EPR), (3) Sensory Discomfort (SD), (4) Sensory Comfort (SC), (5) Social-Affective Sensitivity (SAS), and (6) Esthetic Sensitivity (AS). Subsequent confirmatory analysis revealed that a higher-order bifactor model consisting of two higher-order factors (a positive and a negative dimension), in addition to a general sensitivity factor and six specific factors fits the data best. With respect to the higher-order factors, four factors load on the positive dimension (SIES, SC, SAS and AS) whereas two factors (EPR and SD) load on the negative dimension.
Regarding convergent and discriminant validity, the strongest associations were found between Emotional and Physiological Reactivity and Neuroticism on the one hand, and Esthetic Sensitivity and Openness on the other hand. The SPSQ total score has a similarly strong relationship with Neuroticism and Openness respectively, which is consistent with earlier findings using the HSPS. In their review, Greven et al. (Citation2019) concluded that empirical studies showed a positive relationship between SPS and both Neuroticism and Openness, as well as a negative relationship with Extraversion. A meta-analysis by Lionetti et al. (Citation2019) found only significant associations between SPS and Neuroticism and Openness. The latter suggests that these associations may be the most stable and consistent ones. Our analyses showed that within the concept of SPS, it is possible not only to distinguish between a number of specific factors, each representing a different aspect of SPS, but also a clear distinction can be made between a positive and a negative dimension of SPS. As might be expected, the positive dimension shows the strongest correlation with Openness, while the negative dimension is most strongly related to Neuroticism.
Concerning concurrent validity, both Emotional and Physiological Reactivity and the negative dimension of the SPSQ show clear associations with all clinical outcomes (physical complaints, fatigue, anxiety and depression), in contrast to the positive dimension of the SPSQ which shows a weak link with each of these outcomes. The total variance of these clinical outcomes that can be explained based on the six different factors is not only superior to the variance explained by the total SPSQ score, but also to the variance explained by the two higher-order dimensions. The discrepancy between the variance explained by the six different factors and the total score is greatest for anxiety and depression, i.e. for psychological distress. This finding points at the importance, both for scientific research and clinical practice, of using not only the total SPSQ score, or the higher-order dimensions, but also the six specific scales. Failure to do so would result in a significant loss of information.
Sample means show higher averages for women than for men on the SPSQ total, the two higher-order dimensions, and the six subscales. This gender difference with respect to SPS was also found in other studies using the HSPS (Benham, Citation2006; Chacon et al., Citation2021; Konrad & Herzberg, Citation2017). In the current study, the differences are largest for the SPSQ total, the negative higher-order dimension, and SD, as part of the negative SPSQ dimension. The differences are smaller for the positive higher-order dimension and the four specific subscales associated with this dimension. This difference between men and women regarding the negative and positive aspects of SPS was also found by Konrad and Herzberg (Citation2017), but not by Chacon et al. (Citation2021).
Regarding the relationship between the SPSQ and existing questionnaires that also measure (aspects of) SPS, a strong relationship is found between the total score of the SPSQ and the total score of the HSPS. In addition, the positive higher-order dimension of the SPSQ and the SPSQ subscales associated with this higher-order dimension show a strong relationship with the positive subscale of the HSPS (AES) as well as with the Orienting Sensitivity scale of the ATQ and its subscales. The same applies to the negative higher-order dimension of the SPSQ and the SPSQ subscales associated with this higher-order dimension on the one hand and the negative subscales of the HSPS (EOE and LST) and the Discomfort scale of the ATQ on the other hand. Although the exact magnitude of the correlations should be interpreted with some caution due to item overlap, it can be concluded that the links between the SPSQ and existing questionnaires are in the expected direction. In comparison with existing questionnaires, the SPSQ offers however the advantage that more aspects of SPS are measured, and that the focus is not only on the negative but also on the positive characteristics of Sensory Processing Sensitivity.
Strengths and limitations
One of the major strengths of the present research is the large general population samples that were available to carry out both Study 1 (the main study) and Study 2. These sample sizes provided excellent power for conducting the analyses necessary to develop and validate the SPSQ, to ensure factor replicability, even within more complex models (Kyriazos, Citation2018) such as the higher-order bifactor configuration, and to allow for reliable estimates of population correlations. The inclusion of questionnaires regarding personality traits and clinical outcomes has allowed us to obtain a clearer and especially a more differentiated picture of the links between SPS, generic personality factors, and psychological and physical distress. However, since SPS and clinical outcomes were measured at the same time, no inferences can be made regarding causality. Is high sensitivity a factor that makes people more sensitive to the development of psychological and physical complaints, is the presence of such complaints conducive to increased SPS, or is there another (latent) factor underlying both SPS and psychological and physical distress, a factor that could explain why SPS and distress are related?
This question brings us to a limitation of the study, namely the fact that only cross-sectional data were collected, so that the predictive validity of the specific factors of the SPSQ and its higher-order dimensions could not be investigated. Additionally, the generalizability of the results to the general population at large may be somewhat limited by gender imbalance. A counter-argument that mitigates this limitation is the fact that both Study 1 and Study 2 were done in large samples from the general population, in contrast to previous studies that have largely been done in student populations. The few studies that were conducted in the general population usually had very small samples, or showed a similar or even greater imbalance in the ratio of men to women (Booth et al., Citation2015; Ershova et al., Citation2018; Evans & Rothbart, Citation2008; Grimen & Diseth, Citation2016; Konrad & Herzberg, Citation2017; Lionetti et al., Citation2018; Liss et al., Citation2008; Meyer et al., Citation2005; Sengul-Inal & Sümer, Citation2020; Smolewska et al., Citation2006; Sobocko & Zelenski, Citation2015).
The information, both regarding the purpose of the study and the concept of Sensory Processing Sensitivity (SPS), included in the call for participation in the study, may have contributed to selection bias. More specifically, it is likely that people who are interested in the subject were more inclined to fill in the questionnaire. In addition, it is also possible that some of the people interested in the concept recognized themselves in (some aspects of) SPS and therefore scored higher on average on (certain items or sub-scales of) the SPSQ, which may have led to response bias. Similarly, responses may have been influenced by social desirability (or social response bias) since it is known that self-report studies regarding personality traits are (or can be) susceptible to social desirability bias. Since the information letter for the potential respondents emphasized that being more or less sensitive to environmental stimuli is neither good nor bad and that both have advantages and disadvantages, and since the respondents could fill out the questionnaire anonymously, it can however be assumed that social desirability played only a limited role in this study. Nevertheless, for future research in this domain, it would be recommendable to add a measure of social desirability to the survey.
Finally, the development of the SPSQ was based on the definition of the concept of Sensory Processing Sensitivity (SPS) as reported by Aron et al. (Citation2012) and Evans and Rothbart (Citation2007, Citation2008) and the dimensions they distinguished. Despite the fact that the SPSQ allows for measuring more aspects of the concept as it has been defined so far, and in that way adds to our understanding of SPS, the core nature of the concept as such, still remains to be identified. In order to further unravel this concept, it is necessary to uncover the underlying mechanisms of (high) SPS, an undertaking that is necessary but goes beyond what was feasible in the current study.
Suggestions for future research and (clinical) practice
Previous findings, based upon the Highly Sensitive Person Scale suggest that people can be classified into sensitivity groups along a continuum (Lionetti et al., Citation2018). The development of cutoff points for the SPSQ scale scores (total score as well as the six specific scale scores) could benefit clinicians and researchers in guiding their interpretation of individual or group scores. In addition to this, the development of a short form of the SPSQ would facilitate the inclusion of the questionnaire in more extensive surveys, both in clinical practice and intervention research. It would also be valuable, in both cross-sectional research (concurrent validity) and longitudinal research (predictive validity), to look not only at the associations between the (factors and dimensions of the) SPSQ and clinical outcomes but also at the associations with more positive outcomes. In this context, one might consider variables such as resilience, quality of life, and overall satisfaction with life. Furthermore, as Konrad and Herzberg (Citation2017) pointed out, some items derived from the HSPS and included in the SPSQ are multifaceted, asking in one and the same item about the (over)sensitivity to several, clearly different sensory impressions (e.g., smells, flavors, music, art). Splitting these markedly distinct sensory impressions into different items may contribute to a greater homogeneity within the subscales, which in turn may have positive effects on the internal consistency reliability of these subscales.
Finally, future research with the SPSQ could also focus on the theoretical foundations of SPS, in two different but complementary ways. First, whereas sensitivity to environmental influences was initially considered a factor that makes people more vulnerable to (physical and psychological) distress, more recent theories and models assume that sensitive individuals respond more strongly to both positive and negative stimuli. One of these theories is Differential Susceptibility (Belsky & Pluess, Citation2009). As the SPSQ was developed with the aim of identifying both the positive and negative aspects of SPS, it may be interesting to test the SPSQ in terms of differential susceptibility. A possible way of doing this is to form four groups on the basis of the SPSQ, namely (a) a group that scores high on the positive dimension and medium to low on the negative dimension, (b) a group that scores high on the negative dimension and medium to low on the positive dimension, (c) a group that scores high on both dimensions, and (d) a group that scores low on both dimensions. An experimental design can be used to investigate whether these four groups respond differently to negative versus positive stimuli.
Secondly, previous fMRI studies have shown that respondents who score high on SPS (measured using the Highly Sensitive Person Scale) are characterized by increased activation of brain areas involved in higher-order visual processing and attention (Jagiellowicz et al., Citation2011), the integration of sensory stimuli, awareness and empathy (Acevedo et al., Citation2014), as well as memory, emotion and reflection (Acevedo et al., Citation2017). Although these studies have contributed significantly to our understanding of the neural mechanisms that may underlie the increased cognitive and emotional processing of sensory information, which is typical of high SPS, it is still unclear what the core feature of SPS is. Future fMRI studies, making use of the SPSQ, and distinguishing between the four sensitivity groups described above, may shed more light on the key mechanisms underlying SPS at baseline and during interaction with positive and negative stimuli.
In terms of clinical practice, the SPSQ offers the opportunity to gain insight not only into the extent to which clients are easily overwhelmed by sensory stimuli, but also the degree to which they are quick to notice subtle environmental stimuli, the emotional valence of various stimuli (music, art, but also people's verbal and non-verbal communication) as well as the depth with which they process these stimuli. This, in turn, not only offers starting points for interventions aimed at coping better with a multitude of (high-intensity) stimuli, but also for interventions focusing on the positive aspects of high sensitivity, helping people to see these aspects as strengths that they can further develop and thus contributing to a better person-environment fit in various (e.g., professional) settings.
In their 2018 article, de Villiers, Lionetti and Pluess hypothesize vantage sensitivity, the proclivity of people to benefit disproportionately from positive features of environmental experiences, to be one of the factors that may explain why some individuals gain more from psychotherapy than others. Sensory Processing Sensitivity is put forward as the most obvious candidate to measure vantage sensitivity. Although the above can certainly make a valuable contribution to the discussion of who benefits most from psychotherapy and why, the question remains which aspects of SPS contribute most to this differential responsiveness to psychological interventions. As vantage sensitivity is considered to be "the bright side" - or, in other words - "the positive side" of environmental susceptibility, the SPSQ offers the opportunity to explore this question further as it includes a broader set of positive aspects of SPS.
A number of psychiatric disorders are associated with increased sensitivity to stimuli. One example is Autism Spectrum Disorder (ASD) (Acevedo et al., Citation2018).
The Diagnostic and Statistical Manual of Mental Disorders − 5 (DSM-5, American Psychiatric Association, Citation2013) mentions, however, both hypersensitivity and hyposensitivity to environmental stimuli as diagnostic criteria of ASD. Attention to detail is a symptom of autism, but so is a lack of sensitivity to interpersonal subtleties, subtleties in communication or interaction with others. A previous study (Liss et al., Citation2008) showed that the negative dimensions of the HSPS (the subscales ‘Ease of Excitation’ and ‘Low Sensory Threshold’) were related to symptoms of autism. The positive dimension of the HSPS (the ‘Esthetic Sensitivity’ subscale) was positively related to 'attention to detail' but negatively to communication skills. The use of the SPSQ in persons with ASD could allow us to get a more detailed and differentiated picture of SPS in this patient population. The central questions are "On which positive and negative dimensions does this population score higher/the same/lower than the general population?" and "To what extent does this more differentiated picture of hyper- and hyposensitivity provide us with tools for psychological interventions in this population?".
Conclusion
The SPSQ is a comprehensive questionnaire that measures a wide range of dimensions of SPS and has very good psychometric qualities. This opens up several interesting perspectives for the future, both clinically and in terms of research.
Supplemental Material
Download MS Word (214 KB)Notes
1 To check whether item omission due to high cross-loadings had an impact on the number of factors found, the EFA was re-run including items 16, 27, 38, 45, 52 and 57 (for a description see the appendix). Both the parallel analysis and Velicer’s MAP test resulted in the same number of factors to retain. Velicer’s MAP test indicated a solution with five factors (MAP = .00526), closely followed by a solution with six factors (MAP = .00533); parallel analysis again indicated a 6-factor solution.
2 To test whether the effect of the SPSQ scales on the clinical outcomes is homogeneous across the measured demographic groups, additional models were fit including interaction effects. For age, gender, living situation, education and employment, the additional variance explained by the interaction terms was negligible (all ΔR² ≤ .005).
References
- Acevedo, B. P., Aron, E. N., Aron, A., Sangster, M. D., Collins, N., & Brown, L. (2014). The highly sensitive brain: an fMRI study of sensory processing sensitivity and response to others' emotions. Brain and Behavior, 4(4), 580–594. https://doi.org/10.1002/brb3.242
- Acevedo, B. P., Aron, E. N., Pospos, S., & Jessen, D. (2018). The functional highly sensitive brain: a review of the brain circuits underlying sensory processing sensitivity and seemingly related disorders. Philosophical Transactions of the Royal Society of London Biological Sciences, 373, 1744. https://doi.org/10.1098/rstb.2017.0161
- Acevedo, B. P., Jagiellowicz, J., Aron, E. N., Aron, A., & Marhenke, R. (2017). Sensory processing sensitivity and childhood quality’s effects on neural responses to emotional stimuli. Clinical Neuropsychiatry: Journal of Treatment Evaluation, 14, 359–373.
- American Psychiatric Association. (2013). Diagnostic and statistical manual of mental disorders (5th ed.). https://doi.org/10.1176/appi.books.9780890425596
- Aron, E. N., & Aron, A. (1997). Sensory-processing sensitivity and its relation to introversion and emotionality. Journal of Personality and Social Psychology, 73(2), 345–368. doi:10.1037/0022-3514.73.2.345
- Aron, E. N., Aron, A., & Jagiellowicz, J. (2012). Sensory processing sensitivity: A review in the light of the evolution of biological responsivity. Personality and Social Psychology Review: An Official Journal of the Society for Personality and Social Psychology, Inc, 16(3), 262–282. https://doi.org/10.1177/1088868311434213
- Belsky, J., & Pluess, M. (2009). Beyond diathesis stress: differential susceptibility to environmental influences. Psychological Bulletin, 135(6), 885–908. https://doi.org/10.1037/a0017376
- Benham, G. (2006). The highly sensitive person: Stress and physical symptom reports. Personality and Individual Differences, 40(7), 1433–1440. https://doi.org/10.1016/j.paid.2005.11.021
- Booth, C., Standage, H., & Fox, E. (2015). Sensory-processing sensitivity moderates the association between childhood experiences and adult life satisfaction. Personality and Individual Differences, 87, 24–29. https://doi.org/10.1016/j.paid.2015.07.020
- Chacon, A., Perez-Chacon, M., Borda-Mas, M., Avargues-Navarro, M. L., & Lopez-Jimenez, A. M. (2021). Cross-cultural adaptation and validation of the Highly Sensitive Person Scale the adult Spanish population (HSPS-S). Psychology Research and Behavior Management, 14, 1041–1052. https://doi.org/10.2147/PRBM.S321277
- Chen, F. F. (2007). Sensitivity of goodness of fit indexes to lack of measurement invariance. Structural Equation Modeling: a Multidisciplinary Journal, 14(3), 464–504. https://doi.org/10.1080/10705510701301834
- Cohen, J. (1988). Statistical power analysis for the behavioral sciences (2nd ed.). Lawrence Erlbaum Associates, Publishers.
- Denissen, J. J., Geenen, R., van Aken, M. A., Gosling, S. D., & Potter, J. (2008). Development and validation of a Dutch translation of the Big Five Inventory (BFI). Journal of Personality Assessment, 90(2), 152–157. https://doi.org/10.1080/00223890701845229
- Dixon, E. A., Benham, G., Sturgeon, J. A., Mackey, S., Johnson, K. A., & Younger, J. (2016). Development of the Sensory Hypersensitivity Scale (SHS): a self-report tool for assessing sensitivity to sensory stimuli. Journal of Behavioral Medicine, 39(3), 537–550. https://doi.org/10.1007/s10865-016-9720-3
- Ershova, R. V., Yarmotz, E. V., Koryagina, T. M., Semeniak, I. V., Shlyakhta, D. A., & Tarnow, E. (2018). A psychometric evaluation of the highly sensitive person scale: the components of sensory-processing sensitivity. Electronic Journal of General Medicine, 15(6), em96. https://doi.org/10.29333/ejgm/100634
- Evans, D. E., & Rothbart, M. (2007). Developing a model for adult temperament. Journal of Research in Personality, 41(4), 868–888. https://doi.org/10.1016/j.jrp.2006.11.002
- Evans, D. E., & Rothbart, M. K. (2008). Temperamental sensitivity: Two constructs or one? Personality and Individual Differences, 44(1), 108–118. https://doi.org/10.1016/j.paid.2007.07.016
- Fokkema, M., & Greiff, S. (2017). How performing PCA and CFA on the same data equals trouble. European Journal of Psychological Assessment, 33(6), 399–402. https://doi.org/10.1027/1015-5759/a000460
- Greven, C. U., Lionetti, F., Booth, C., Aron, E. N., Fox, E., Schendan, H. E., Pluess, M., Bruining, H., Acevedo, B., Bijttebier, P., & Homberg, J. (2019). Sensory processing sensitivity in the context of environmental sensitivity: a critical review and development of research agenda. Neuroscience and Biobehavioral Reviews, 98, 287–305. https://doi.org/10.1016/j.neubiorev.2019.01.009
- Grimen, H. L., & Diseth, A. (2016). Sensory processing sensitivity: Factors of the highly sensitive Person Scale and their relationships to personality and subjective health complaints. Perceptual and Motor Skills, 123, 667. https://doi.org/10.1177/0031512516666114
- Hartman, C., Majdandzic, M., Rothbart, M. (2001). Dutch version of the Adult Temperament Questionnaire (ATQ). http://research.bowdoin.edu/rothbart-temperament-questionnaires/files/2016/06/ATQ-dutch.doc
- Hayton, J. C., Allen, D. G., & Scarpello, V. (2004). Factor retention decisions in exploratory factor analysis: A tutorial on parallel analysis. Organizational Research Methods, 7(2), 191–205. https://doi.org/10.1177/1094428104263675
- Horn, J. L. (1965). A rationale and test for the number of factors in factor analysis. Psychometrika, 30(2), 179–185. https://doi.org/10.1007/BF02289447
- Hu, L. T., & Bentler, P. M. (1999). Cutoff criteria for fit indexes in covariance structure analysis: Conventional criteria versus new alternatives. Structural Equation Modeling: A Multidisciplinary Journal, 6(1), 1–55. [Database] https://doi.org/10.1080/10705519909540118
- Jagiellowicz, J., Xu, X., Aron, A., Aron, E. N., Cao, G., Feng, T., & Weng, X. (2011). The trait of sensory processing sensitivity and neural responses to changes in visual scenes. Social Cognitive and Affective Neuroscience, 6(1), 38–47. https://doi.org/10.1093/scan/nsq001
- Kaiser, H. F. (1974). An index of factorial simplicity. Psychometrika, 39(1), 31–36. https://doi.org/10.1007/BF02291575
- Konrad, S., & Herzberg, P. Y. (2017). Psychometric properties and validation of a German High Sensitive Person Scale (HSPS-G). European Journal of Psychological Assessment, 3, 124–135. https://doi.org/10.1027/1015-5759/a000411
- Kroenke, K., Spitzer, R. L., & Williams, J. B. W. (2001). The PHQ-9: validity of a brief depression severity measure. Journal of General Internal Medicine, 16(9), 606–613. https://doi.org/10.1046/j.1525-1497.2001.016009606.x
- Kroenke, K., Spitzer, R. L., & Williams, J. B. W. (2002). The PHQ-15: Validity of a new measure for evaluating the severity of somatic symptoms. Psychosomatic Medicine, 64(2), 258–266. https://doi.org/10.1097/00006842-200203000-00008
- Kyriazos, T. A. (2018). Applied psychometrics: sample size and sample power considerations in factor analysis (EFA, CFA) and SEM in general. Psychology, 9(8), 2207–2230. https://doi.org/10.4236/psych.2018.98126
- Lionetti, F., Aron, A., Aron, E. N., Burns, G. L., Jagiellowicz, J., & Pluess, M. (2018). Dandelions, tulips and orchids: evidence for the existence of low-sensitive, medium-sensitive and high-sensitive individuals. Translational Psychiatry, 8(1), 24. https://doi.org/10.1038/s41398-017-0090-6
- Lionetti, F., Pastore, M., Moscardino, U., Nocentini, A., Pluess, K., & Pluess, M. (2019). Sensory processing sensitivity and its association with personality traits and affect: A meta-analysis. Journal of Research in Personality, 81, 138–152. https://doi.org/10.1016/j.jrp.2019.05.013
- Liss, M., Mailloux, J., & Erchull, M. J. (2008). The relationships between sensory processing sensitivity, alexithymia, autism, depression, and anxiety. Personality and Individual Differences, 107, 247–255. https://doi.org/10.1016/j.paid.2008.04.009
- Lydersen, S., Fagerland, M. W., & Laake, P. (2009). Recommended tests for association in 2 x 2 tables. Statistics in Medicine, 28(7), 1159–1175. https://doi.org/10.1002/sim.3531
- Mardia, K. V., & Zemroch, P. J. (1975). Algorithm AS 84: Measures of multivariate skewness and kurtosis. Journal of the Royal Statistical Society. Series C (Applied Statistics), 24(2), 262–265. https://doi.org/10.2307/2346576
- Marsh, H. W., Balla, J. R., & McDonald, R. P. (1988). Goodness-of-fit indexes in confirmatory factor analysis: The effect of sample size. Psychological Bulletin, 103(3), 391–410. https://doi.org/10.1037/0033-2909.103.3.391
- McCrae, R. R., & Costa Jr, P. T. (1987). Validation of the five-factor model of personality across instruments and observers. Journal of Personality and Social Psychology, 52(1), 81–90. doi:10.1037/0022-3514.52.1.81
- Mehling, W. E., Gopisetty, V., Daubenmier, J., Price, C. J., Hecht, F. M., & Stewart, A. (2009). Body awareness: construct and self-report measures. PLoS One, 4(5), e5614. https://doi.org/10.1371/journal.pone.0005614
- Meyer, B., Ajchenbrenner, M., & Bowles, D. P. (2005). Sensory sensitivity, attachment experiences, and rejection responses among adults with borderline and avoidant features. Journal of Personality Disorders, 19(6), 641–658. https://doi.org/10.1521/pedi.2005.19.6.641
- Miller, L. C., Murphy, R., & Buss, A. H. (1981). Consciousness of body: Private and public. Journal of Personality and Social Psychology, 41(2), 397–406. https://doi.org/10.1037/0022-3514.41.2.397
- R Core Team. (2020). R: A language and environment for statistical computing. Vienna, Austria: R Foundation for Statistical Computing. Retrieved from https://www.r-project/.
- Rosseel, Y. (2012). lavaan: An R Package for Structural Equation Modeling. Journal of Statistical Software, 48(2), 1–36. https://doi.org/10.18637/jss.v048.i02
- Sengul-Inal, G., & Sümer, N. (2020). Exploring the multidimensional structure of sensory processing sensitivity in Turkish samples. Current Psychology, 39, 194–206. https://doi.org/10.1007/s12144-017-9751-0
- Shields, S. A., Mallory, M. E., & Simon, A. (1989). The Body Awareness Questionnaire: Reliability and validity. Journal of Personality Assessment, 53(4), 802–815. https://doi.org/10.1207/s15327752jpa5304_16
- Smets, E. M. A., Garssen, B., Bonke, B., & de Haes, J. C. J. M. (1995). The Multidimensional Fatigue Inventory (MFI). Psychometric qualities of an instrument to assess fatigue. Journal of Psychosomatic Research, 39(3), 315–325. doi: https://doi.org/10.1016/0022-3999(94)00125-O
- Smolewska, K. A., McCabe, S. B., & Woody, E. Z. (2006). A psychometric evaluation of the Highly Sensitive Person Scale: The components of sensory-processing sensitivity and their relation to the BIS/BAS and “Big Five.” Personality and Individual Differences, 40(6), 1269–1279. https://doi.org/10.1016/j.paid.2005.09.022
- Sobocko, K., & Zelenski, J. M. (2015). Trait sensory processing sensitivity and subjective well-being: distinctive associations for different aspects of sensitivity. Personality and Individual Differences, 83, 44–49. https://doi.org/10.1016/j.paid.2015.03.045
- Spitzer, R. L., Kroenke, K., Williams, J. B. W., & Löwe, B. (2006). A brief measure for assessing Generalized Anxiety disorder: The GAD-7. Archives of Internal Medicine, 166(10), 1092–1097. https://doi.org/10.1001/archinte.166.10.1092
- Tabachnick, B. G., & Fidell, L. S. (2001). SAS for windows workbook for Tabachnick and Fidell using multivariate statistics. Allyn and Bacon.
- Van de Schoot, R., Lugtig, P., & Hox, J. (2012). A checklist for testing measurement invariance. European Journal of Developmental Psychology, 9(4), 486–492. https://doi.org/10.1080/17405629.2012.686740
- Verenigde Internet Exploitanten (VINEX). (n.d). NOBO top 50 feb 2019. Retrieved September 1, 2021, from https://vinex.nl/wp-content/uploads/2021/03/NOBO-Top-50-feb-2019.pdf).
- Wolf, E. J., Harrington, K. M., Clark, S. L., & Miller, M. W. (2013). Sample size requirements for structural equation models: An evaluation of power, bias, and solution propriety. Educational and Psychological Measurement, 73(6), 913–934. https://doi.org/10.1177/0013164413495237
- Zimmerman, D. W., Zumbo, B. D., & Williams, R. H. (2003). Bias in estimation and hypothesis testing of correlation. Psicológica, 24(1), 133–158.
Appendix.
The sensory processing sensitivity questionnaire
Overview items initially included in the Sensory Processing Sensitivity Questionnaire (SPSQ)