
ABSTRACT
This paper introduces a novel dataset on working-time regulation for 197 territories between 1789 and 2010 to document how working hours have become globally standardised through public policy. Descriptive analysis shows that working-time reforms are global in scope, rare events, sizable once undertaken and tend to reduce hours. Democracies were historically more likely than autocracies to regulate hours, but this is not the case now, and there has never been a large gap in the content of their regulations. Whereas independent states always regulated hours to a greater extent, over half of all dependent states just prior to decolonisation regulated hours with more generous regulations than independent states. Based on these patterns, the paper first makes a methodological plea for more long-term historical studies and, second, sketches two possible explanatory frameworks for working-time reforms. One highlights shocks to the powerbase of antiregulation coalitions; the other highlights international normative change.
Introduction
The working-time blindspot
Working hours have changed radically since hunter-gatherers, from agrarian to industrial societies starting in the early 19th century and continuing today. The move to farming from hunting-gathering increased the hours of work from between 3 and 4 to around 10 to 12 per day (Bowles, Citation2011). With the advent of industrialisation and the ‘industrious revolution’ changing agricultural work patterns, demand for longer work hours and labour discipline intensified (Thompson, Citation1967, pp. 56–97), as seen in the comparative statistics of industrialised nations. Data from the 1870s indicated a working week of 57 to 72 hr (Huberman & Minns, Citation2007, p. 542). Leisure was not only generally restricted but also unequally distributed.
With increasing labour discipline, harsh working conditions and unequal life expectancy, the gap between hours desired and hours worked increased, fuelling demands for social reform (Burgoon & Baxandall, Citation2004). Regulation to curb excessive work hours was a primary demand of social reformers and working-class organisations (Rasmussen & Knutsen, Citation2023). For example, although Karl Marx never mentioned welfare benefits, he focused long tracts of Das Kapital on working-time regulation.
Given its importance – for both political reform and workers’ quality of life – the ‘apparent blindspot to the hours question’, as Cross (Citation1984, p. 195) described 38 years ago, still stands tall in public policy studies.Footnote1 Although there may be many causes for this blindspot, one suspect is the absence of a comparative dataset on working-time regulations.
Recently, impressive data-collection efforts have instead been undertaken for welfare programs (Ferrarini et al., Citation2013; Grünewald, Citation2021; Knutsen & Rasmussen, Citation2018; Pallage et al., Citation2013; Schmitt et al., Citation2015). These datasets allow studies of welfare-state determinants to provide ‘go-to’ sources for historical policy reforms. Recently, an impressive effort was undertaken to construct the ‘CBR Labour Regulation Index’, covering a host of labour-market regulations, including working time. The CBR covers 117 nonsocialist countries from 1970 to 2013 (Adams et al., Citation2017). Nevertheless, we know from existing studies of working-time regulation that this leaves out substantial reform periods starting in the 19th century (Brooke, Citation1898; Huberman, Citation2012; Huberman & Minns, Citation2007; Messenger et al., Citation2007).Footnote2 We also know from public policy studies that early steps can have profound impacts on later reform possibilities (e.g. Pierson, Citation2000; for a review, see; Béland & Schlager, Citation2019) and that public policy tends to be path-dependent, rarely changing (Baumgartner et al., Citation2009, Citation2017; Pierson, Citation2000; Streeck & Thelen, Citation2005). If we want to understand the long-term causes and effects of working-time regulation, our data collection must go further back in time (Møller, Citation2021).
The paper presents the working time dataset (WTD) on manually coded working-time regulations for industrial workers between 1789 and 2010 in 197 polities.Footnote3 The WTD is unparalleled in scope. It captures 1,147 reform events among 26,000 country-year observations for more polities over a longer time than alternative datasets. The data contain information on central regulations, such as normal work hours, maximum work hours and overtime remuneration. Country-specific information is provided in Appendix A1.
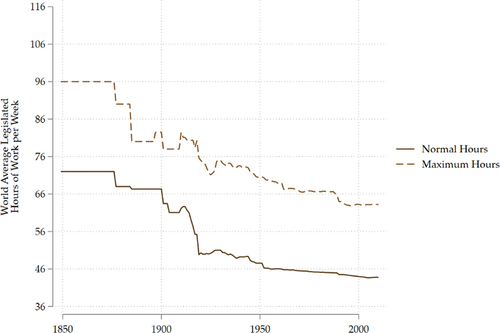
The WTD reveals that working time underwent a transformative standardisation process throughout the world. Mapping the development of normal weekly hours from 1848 to 2010 shows a substantial increase in countries that regulated work hours. shows the percentage of countries that regulated hours and overtime, and shows the average normal and maximum work hours (per week) for all countries regulating hours. The global averages show a substantial change in states’ tendencies to regulate hours and their content, with work hours trending downwards and overtime compensation upwards. This paper uses WTD to identify patterns of reforms scope (global, regional or local), timing, convergence tendency, size (incremental or stable punctuated by transformative reform) and relation to regime structure (electoral democracy or autocracy; independent or dependent states). All factors highlight aspects relevant for further theorising the origins of working-time reform and identify puzzles for future research.
Figure 1. Share of countries that regulated work hours and overtime.
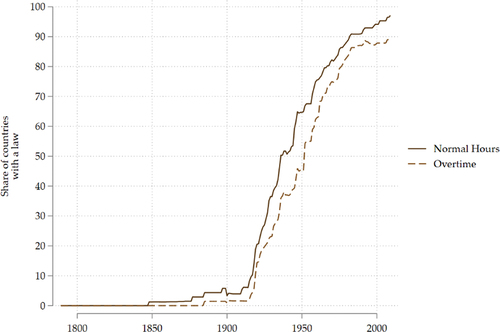
Figure 2. Average regulated normal and maximum work hours.
The conclusion drawn from these investigations is that working-time regulation was, from its beginning, a global phenomenon, with countries in all corners of the world regulating hours by the 1920s. Reforms tend to be rare but sizable once undertaken. Patterns of change are, therefore, consistent with the punctuated equilibrium theory (PET) and not incremental path dependency (explained in the next section). Convergence around lower normal hours also has been substantial since the 1960s. However, those that initially had lower hours still have lower hours than those that did not, implying conditional convergence.
Furthermore, reforms were undertaken in autocracies and democracies, in dependent and independent states, with perhaps surprisingly little divergence in regulatory content. To explain these patterns, two explanatory frameworks are presented to be tested in future studies. One highlights global and regional shocks to the powerbase of state and private employers, and the other that international and regional organisations and events cause idea and norm changes.
Regulating hours of work
Working-time regulation is policy that sets the rules for when and how labour can be employed. Restrictions on working time can come from two types of social policy. Indirect regulations are policies that end up curbing working time, although their primary aim is quite different. For example, old-age pensions protect against income loss but also indirectly increase leisure by providing a possible exit from the labour market. Direct policies are those primarily intended to increase leisure time. The WTD covers only direct policies but can be combined with other datasets, such as the SPAW (Knutsen & Rasmussen, Citation2018) or PENLEG databases (Grünewald, Citation2021), for a more complete picture of how social policy shapes actual work (Burgoon & Baxandall, Citation2004).
The WTD focuses on the legal definition of the working week length. Therefore, it provides data on normal hours of work, the contractually obliged hours a worker can or must work in a specific period (e.g. day, week or year). It secondly encompasses maximum hours of work, the total number of hours an employee can work in a week, combining normal and overtime hours. Whereas normal hours capture the likely on-average workweek, maximum hours refer to the number of hours an average worker can be engaged to work. The third measure within the WTD database is overtime remuneration, the percentage increase in wages per hour for overtime. Hours worked after normal and before maximum hours are defined as overtime. This measure is meant to capture the employers’ costs and the employees’ benefits for working overtime. Together, the three measures provide a general overview of the availability and cost of using labour as regulated through working-time laws.
Methods and sources
Sources and general coding approach
No single data source type covers labour regulation for all independent and dependent polities in the world from 1789 to 2010. Thus, unlike for the seminal alternative CRB dataset, the WTD could not rely on a single major source, such as the International Labour Organization’s (ILO) NATLEX legal database. Here information became available only starting in the 1970s, too late for the scope of the WTD. Therefore, the WTD utilised a host of common and novel data sources according to region and period. A complete list is provided in Appendix B.
Because the WTD relied on a combination of sources, a criterion was needed to establish a hierarchy of sources and determine which information was to be believed in cases of disagreement. The WTD adopts a common principle from historical research: preferring sources closest to the primary legal document over those more distant from the document (Kjelstadli, Citation1992). In practise, this means national legal sources (law databases, etc.) were given precedent over most reports provided by international organisations.
This section provides a brief overview of which sources are used for which periods and regions. For Scandinavia, Pacific, Commonwealth, African and Anglo-Saxon polities, the WTD relied on online law databases. For the period up to the 20th century, the WTD used contemporary observers’ descriptions of the historical development of factory legislation, including Brooke’s (Citation1898) comprehensive report and tables on early working-time laws (see also Frankel, Citation1924; Magnusson, Citation1919). Various reports issued by the U.S. Bureau of Labor Statistics, for example, on the 10-hr workday were also used. In addition, the periodical, ‘Monthly Labor Review’ (1915–present), was used to track African and Latin American developments.
The ILO available sources started in 1919; the annual ‘Legislative Series’, which translates labour legislation up to the 1990s into English, was then used to verify existing legislation and track changes up to the 1980s when lack of funding slowly killed the series. Reports such as the ‘Hours of Work’ ILO series and their historical sections on previous developments were used to verify the regulations of new ILO members. In addition, the WTD used subject-, country- and region-specific entries in the ‘International Labour Review’ (1920–present), together with the ILO legal databases, NATLEX and Travail, to track changes in labour and working-hour laws from the 1980s onwards. These are used in tandem with national legal databases to track recent changes.
Issues associated with coding national-level regulations
Working-time regulations, like regulations in general, differ for various groups in different ways over time and between countries. Great Britain between 1800 and 1940 illustrates how regulations can substantially differ for occupational groups and genders in the same polity. More specifically, shows how the normal-hours score would change if we investigated regulations for various worker categories or genders.
Figure 3. Example impact of model assumptions on final data.
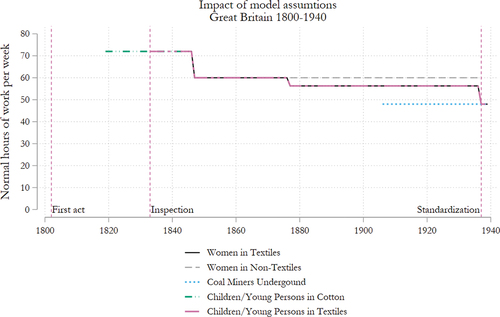
The first act (in 1802) set hours for apprentices at 72 per week but did not regulate hours beyond apprentices. The 1819 Factory Act extended the 72-hr regulation to children – but only to those in cotton factories and not all textiles. Children’s work hours in factories were set at 72.0 in 1833 and then fell to 60.0 in 1847 and 56.3 in 1877. Hours for women in textiles were regulated at 72.0 in 1844, 60.0 in 1847 and 56.3 from 1877 until 1937 when the 48-hr week was standardised (with some exceptions). In 1906, coal miners working underground (in hazardous conditions) received the 8-hr day. Thus, about 12 million British workers had achieved the 8-hr day before its international breakthrough (1917–1923). This nicely illustrates how assumptions about a worker’s age or gender affect the end data depending on which regulation is coded.
To create a homogenous measure of working-time regulation, it is necessary to construct a model worker with a set of specific characteristics.Footnote4 The model worker in the WTD dataset is a male manual-wage dayworker aged 40 years, employed in a mid-sized manufacturing firm as of the month of September. The firm supplies private and public agencies, and the manual work is nonhazardous. The worker is a national of the country where he works and a member of that nation’s dominant religious or ethnic group. He is per definition a formal sector worker.Footnote5
The choice of gender follows from the fact that nearly all laws regulating hours for men also cover women, whereas the opposite tends not to be true. Furthermore, because laws applying to adults also cover children or teens, the WTD only coded rules that apply to adults. Regulations also can differ depending on the worker’s ethnicity or religion. Thus, I coded the regulations in place for the dominant or most populous group. In colonial dependencies, this would be what colonial laws defined as natives. The choice of a dayworker reflects the fact that most workers work during the day. This choice is important (as discussed later) because the definition of nightwork is sometimes used to demarcate maximum working time for most workers, and nightworkers’ work falls under different rules for overtime compensation and normal hours.
Regulations can also differ by industry and sector, with rural and agricultural work less likely to be regulated or included under labour codes or general working-time laws. Furthermore, commercial and industrial workers can have their own rules; similarly, manual and intellectual employees can come under their own regulations. Because the rules for industrial manual dayworkers tend to converge with those for commercial workers (with industrial workers being more numerous), and rural workers are less likely to be regulated under any scheme, the model worker is placed in an industry – specifically, manufacturing.Footnote6
Social policy tends to specify different regulations for small and large firms. However, for the model worker, working time laws rarely make size-specific regulations. In cases where they do, it is usually in association with the implementation speed – smaller firms having more time to adjust. The WTD resolves this by coding only regulations in force for midsized firms, as defined by the relevant legislation.
The impact of these model choices can be seen in the British case. During the period outlined in , Britain had no working-time regulation for male workers in general, in manufacturing or in textiles. Britain, therefore, was coded in the WTD as not regulating hours. This should underline the importance of the choice of model-worker. However, it is also important to highlight that most of these distinctions become less important over time, as increasing work standardisation between sectors leads to adopting more general labour codes for employees.
There were several more coding issues in addition to model worker assumptions. The first is the problem of legacy legislation. Some social policy datasets ignore legacy legislation and instead code regulation following the first law under the new polity. However, upon becoming independent, most territories inherit the previous legislation in force. For example, when the Baltic countries became independent, Estonia started with factory inspections as regulated by the 1882 Russian Act and a weekly limit of 67.30 hr as set out in the 1897 Russian Factory Act. Estonia’s first national legislation in 1925 introduced a 36-hr rest period, and a 1931 act set normal work hours to 48. However, the Russian Act did not apply to Finland, which regulated hours only for children. Thus, Finland became independent without legacy legislation. One of the great benefits of the WTD is that it painstakingly investigated which countries emerged with what kind of legacy legislation.
A second issue was that of Federal states, representing a special challenge for country-level datasets. Because substate-level regulation may diverge substantially, researchers have tended to aggregate state-level regulation to a figure that represents the average level of default regulation in the polity. For example, the CBR dataset (Adams et al., Citation2017, p. 3) in these cases codes the ‘law for the commercially or industrially dominant subunit of that state (the unit where the most significant firms are based), or, failing that, the federal-level law, or in appropriate cases, a mixture of the two’. The main issue with this approach is that we do not know what the score truly reflects – federal, substate or a combination. The WTD dataset follows a different route, coding only legislation that applies throughout the territory (e.g. federal). The WTD, therefore, has the benefit of providing users with a clear understanding of what the final scores reflect. At the same time, the CBR approach is more encompassing in that more federal states will be classified as providing some level of working-time regulation. Again, all measurement strategies for difficult problems usually result in trade-offs, and each researcher must evaluate how these trade-offs shape their results.
With these considerations in mind, classifying normal work hours is straightforward because it was often outlined in the legislation. Sometimes countries regulated hours by day instead of week. In these cases, normal weekly hours is calculated by multiplying daily hours by the number of workdays (which varies over time and between countries, depending on regulations mandating weekly rest days). In cases with no working-time law, a reference category value of 96 hr per week is assigned (justified by assuming workers are granted at least 8 hr rest each day). Users can easily recode these observations to fit their needs.
To calculate maximum work hours per week, one needs to add the number of allowed overtime hours to normal hours. Overtime can be limited in various ways, with limits issued per day, week or year. Because the maximum working time reported here is weekly, daily and yearly limits needed to be translated to weekly maximums. The preferred route was to use daily limits (excluding rest days/hr). The WTD assumes that average overtime allowances are used to maximise work in a specific week. For example, the Finnish 1965 Working Time Act allowed 20 hr overtime in a 2-week period, which in the coding here is assumed to be taken in 1 week (e.g. 47 normal hours becomes a weekly maximum of 67 hr). In countries that regulate hours by day, the number of rest days is important. If rest days could be averaged away from a specific week, I classified a country as not having a rest day in a week the worker works the maximum time allowed. For example, the Dutch East Indies’ working-hour regulations of 1931 specified a normal working day of 9 hr, allowing 2 additional hr of overtime and only 2 rest days per month. The country score would therefore be 11 hr for 7 days/week = 77 hr maximum.
Not all countries directly regulate or limit overtime by, for example, defining a maximum workweek to be averaged over a year. In these cases, calculating a weekly overtime limit was not straightforward, and I used daily and weekly rest requirements to calculate the maximum hours (daily rest between shifts and hr/day rest per week). Maximum hours were then given by subtracting rest hours from total hours. For example, the 2007 Afghan Labour Code forbid overtime above the normal working week of 40 hr, but this 40-hr limit was to be averaged over a year. With no daily, weekly or monthly limits on overtime work, the WTD coded the country in question by using rest requirements. Therefore, Afghanistan is assigned a 78-hr maximum work week (13-hr workdays to allow for the required 11 hr of sleep, 1 rest/prayer hr, and Friday as the rest day of the week).
When no rest periods are specified in the law – beyond perhaps a weekly rest requirement – the definition of nightwork was used to ascertain how many hours a dayworker could work before becoming a night worker. For example, the Dahomey (Benin) Labour Code of 1967 defined nightwork as taking place between 2100 and 0500, meaning the model dayworker would have at least 8 hr of rest per day. However, a few countries do not define even nightwork and provide no regulations on the other factors mentioned. In these cases, the WTD simply assumed a minimum of 8 hr rest per day and combined these with rest days to calculate the minimum rest for a week.
It is also important to repeat that the maximum weekly hours reported in some instances are not possible beyond a week. For example, the Greek 70-hr work week is possible in only one week, given the yearly restriction of 120 overtime hr per year. Similarly, the Hungarian Labour Code of 1953 allowed 8 to 12 hr overtime, leading to 56 to 60 hr of overtime possible in a week but only once a month. Conditions such as these highlight that maximum hours captures the possible long hours labourers can find themselves working in a limited period.
Overtime remuneration, the percentage increase in hourly wages during the first hour of overtime, was the most straightforward aspect to code. Still, countries differ in how they regulate overtime compensation: Some countries do not allow overtime to be compensated by increased pay but instead by additional rest. The 1984 Labour Code of Cuba is an example. Others allow for both types of compensation, with employers or employees deciding what kind of compensation they prefer. In these instances, it is assumed that workers/employers decided to pay overtime compensation instead of accruing leave time. The percentage increase here refers only to the first hour of overtime. In other words, possible overtime compensation is higher than the data show.
Another concern is the tendency for states to simply require overtime to be compensated at higher wages, leaving the particulars to be specified by other means. Compensation could be anything − 1%, 50% or even 200%. However, because the minimum increase possible is 1%, these cases are coded as overtime leading to a 1% increase, as a conservative response. Data users should test whether their results could be influenced by this coding decision and exclude or recode these observations.
Results
Regulated and actual working hours
How well do the data on regulated work hours track actual worked hours for formal workers? This is a question that both speaks to the validity of the WTD, whether said measures are implemented, and leads to a change in behaviour (Ronconi, Citation2019).Footnote7 Using historical data available from 66 countries (Feenstra et al., Citation2015; Huberman & Minns, Citation2007), presents bivariate correlations between actual worked hours on average per year and regulation measures. Briefly summarised, over half the variation in worked hours could be accounted for by normal hours, with declines in correlation strength for maximum hours and overtime remuneration. Interestingly, there was a strong fit between overtime remuneration and normal hours, whereas maximum hours correlated similarly with regulated hours as with worked hours.
Table 1. Correlations between three measures of working-time regulation and actual worked hours per worker in 66 countries, 1870–2010.
Moving to a regression framework, shows results from regressing actual worked hours with the regulation measures. These estimates are, of course, meant only as an approximate validation, first cross-sectionally and then over time. The cross-sectional results indicate the extent to which working-time regulations can account for prior and current levels of work hours, whereas the models with fixed effects show how well reform changes led to corresponding changes in hours worked.
Table 2. Ordinary least squares regression on average working hours per worker with working-time regulation measures for 66 countries, 1870–2010.
Interestingly, focusing on variation over time by including fixed country effects increased the size of the normal working-time coefficient: The t-value increased from 6.5 to 9.70. A 1.0-standard-deviation increase in regulated normal hours resulted in about a 1.0-standard-deviation change in worked hours. Rerunning Model 2 without the normal hour variable indicated that the variable accounted for 0.48 points of the R2 (0.72) in the model. The same occurred for maximum hours but was more pronounced: The coefficient more than doubled, and the t-value increased from 1.93 to 3.66 once country effects were included. A 1.0-standard-deviation increase in maximum hours resulted in about a 0.5-standard-deviation increase in worked hours. There was also a significant negative correlation between overtime remuneration and actual worked hours. The coefficient tripled in size when including country fixed effects, with a 1.0-standard-deviation increase in compensation corresponding to just under a 1.0-standard-deviation change in worked hours. In other words, changes in regulations corresponded strongly to moderately with changes in worked hours over time.Footnote8
Reforms usually come in packages, especially with first laws setting out new rules for normal, maximum and overtime hours. Models 7 through 9, therefore, provided a horserace test, pitting each variable against the others. These results indicated that normal hours were the primary determinant, the only coefficient reaching statistical significance.
Importantly, although normal hours are reformed quite often, overtime remuneration tends to stay the same. Thus, the results in Model 9 could have resulted from only a few independent overtime compensation reforms compared to normal hours. Furthermore, as shown in , many countries mandated only increased overtime payment, leaving collective agreements to set the specific rate. Rerunning Model 6 and excluding countries with this framework increased the size of the overtime compensation coefficient, indicating that measurement bias might have driven down the results.
To what extent is the measure of working time from the WTD congruent with normal hours regulation from the CBR dataset (Adams et al., Citation2017)? It is important to highlight that we should expect some level of disagreement. In addition to previously noted factors (model worker assumptions, legacy legislation, federal states), the CBR has features that might create score differences reflecting methodological choices on different trade-offs or aims.
First, the WTD captures legislative changes only at their time of enactment, whereas the CBR captures them at their implementation date. The WTD adopted this approach because it often is unclear when legislation is, in fact, implemented or the extent it is uniformly implemented throughout the polity in question.
Second, the CBR combines collective-bargaining outcomes with legislative regulations to create their measure of normal hours. The WTD does not, primarily because it is a measure of direct state action through legislation. Additionally, it is currently not possible to collect historical data on collective-bargaining results outside of a few selected countries or time points.Footnote9
Absence of collective bargaining results is most likely to bias results upwards, with the WTD indicating longer-than-actual work hours especially in two cases (Messenger et al., Citation2007, p. 37). For countries that lack legislative frameworks and leave this to encompassing collective bargaining (e.g. Denmark), the WTD scores will be biased upwards. The same is likely in countries that regulate hours through law but with a high degree of institutionalized collective bargaining, allowing extensive modifications to work for most workers. Norway is such an example, where hours are regulated to 40 hr. by law, but collective bargaining sets this to 37.5 hr. In this case, however, legislation still plays an important role in shaping the options for bargaining between actors and securing nonunionized sectors. In many historical instances in Europe, collective bargaining inspired and facilitated legislative changes (Messenger et al., Citation2007, p. 10).
With these points in mind, both measures correlated with worked hours at a similar level (CBR at 0.61, and WTD at 0.67). The CBR and WTD measures correlated at 0.78, signalling a strong level of correspondence in country-year rankings.Footnote10 Excluding Western countries, which tend to regulate hours by collective agreement, the correlation increased to 0.86, indicating that country-rank differences reflected collective-bargaining results.
One concern could be that the above pattern of lower regulated hours to actual hours is achieved at the cost of increasing informal work by increasing labour costs in the formal sector (e.g. Botero et al., Citation2004). By combining harmonized ILO (2023) data on the proportion of informal employment with WTD data, one could undertake an initial investigation. Correlating normal hours with the informal employment share does not indicate any significant relationship (results presented in table . in appendix). This holds when considering that more wealthy countries also tend to have both lower hours and informal sectors through controlling for GDP (log).
Did formal sector regulations affect the prevalence of long hours for informal workers? For example, if regulations raise the reference points for negotiations in the informal sector, regulations for labour standards could also shape conditions in the informal sector. Using the same ILO data, the results how that the prevalence of long hours (share of workers working 49+ hours; ILO, 2023) is higher for countries that have higher regulated hours, also in country fixed-effects specifications. This correlation is not robust to controlling for GDP, with the coefficient having the expected sign but becoming insignificant (results presented in table . in appendix).. Although unrobust, the results provide preliminary evidence that informal workers also benefit from formal regulations.
In summary, the validity of the WTD data is reinforced by being significantly and substantially associated with lower working hours and highly correlated with alternative measures of working-time regulation. Given space limitations, the paper will now elaborate and concentrate on the development of regulated normal hours because this turned out to be the most important measure in the tests.
Patterns of working-time regulation
Prior to 1900, only a few countries in the world regulated normal hours. shows these countries by year and region, and shows the regional average normal work hours per year for territories that regulate normal hours. In Appendix A2, similar figures are presented for overtime and maximum hours ().
Figure 4. Working-time regulation development. (a) Development of share of countries with a Law regulating normal work hours by world Region.(b) Average normal work hours development for countries regulating working time by world Region.
In 1848, France started the movement to regulate hours; Switzerland (1877), Austria (1885) and the Russian Empire (1897) followed. In 1899, only 16% of Western Europe and North America regulated hours, with average normal hours standing at 67. New Zealand spearheaded the 8-hr day with the Factory Act of 1901. First regulations were enacted also in northern Africa and Latin America, with Uruguay adopting an 8-hr day in 1915 and Panama the year after.
A massive breakthrough came in the turbulent and transformative years of 1917 to 1923. The share of countries regulating working hours rose from 9% in 1916 to 24% in 1923. In Western and Eastern Europe, shares stood at 62% and 75%, respectively. Regulated hours among Western countries ended at 48 with the region’s embrace of the long-demanded 8-hr day. However, maximum hours at a regional average of 65 allowed much longer days. Likewise, overtime compensation, if regulated at all, remained at low levels. Comparatively low overtime remuneration characterised Western states throughout the 20th century.
Eastern Europe quickly overtook Western countries in regulating working time during the post-Versailles age, but states that inherited the Russian Factory Act had high normal hours. The 48-hr week was only slowly adopted. Following 1945, the Soviet sphere did not reduce hours to the extent Western countries did; several major states even increased hours during the 1980s in response to low growth rates. However, overtime was compensated at comparatively high levels with strict rules limiting overtime. Following the breakup of the Soviet Union, its states reformed the Soviet labour code and reduced normal hours to 40, allowing 8 hr additional overtime but leaving overtime remuneration unchanged.
The 1930s saw the full-scale adoption of the 48-hr week in Latin Africa, but few new reforms of similar scale followed. Latin American countries remain at 48 hr today. However, even if standing still on normal hours, overtime compensation increased decisively: Latin America became the first world region with an average overtime compensation of 50%.
Native labour codes spread hour regulations through Asia and Africa starting in the 1920s, but maximum hours and overtime compensation tended to remain unregulated. In 1945, 45% of territories in sub-Saharan Africa regulated hours, with a regional average of 49. By the 1950s, the sub-Sahara had lower regulated hours than did Latin America, driven mostly by its adoption of the 40-hr week.
The 40-hr week originated among the Western nations of New Zealand, France and Italy, making a short retreat as war legislation reintroduced long work hours. Most Western nations were slow to adopt the 40-hr week despite its origination in this region. Not until the late 2000s did the Western average stand at around 40 hr.
During the 1970s, Caribbean states – many of which just began regulating working time – started to push work hours below 48. Normal hours would end at 44. By 2010, 80 states in the region regulated hours, with the regional average overtime compensation around 40%.
In 2010, the average world country had a regulated work week of 44 hr, a decisive change from the 62-hr week of 100 years earlier. It makes sense to talk of three groups of countries: a front composed of a small group of Western industrialised countries at around 38 hr, the middle-ground countries at around 40 to 44 hr and the rest at around 48 hr. In the latter group, Latin American countries remained overrepresented. Compensation for overtime also became more likely, with a 50% increase in hourly wages being the most common. Most countries still allowed for long work hours by using overtime, with a country average maximum work week of 60 hr – a decisive break from the 82-hr condition a century prior.
These descriptive data show that working-time regulation was, from its beginning, a global phenomenon, with countries in all corners of the world regulating hours by the 1920s. They also indicate the lock-in effects of early legislation, by which whole regions such as Latin America made only small reforms from initial regulations. This raises the question of whether such persistence precludes global convergence in working time.
Convergence in normal hours
To what extent did countries converge or diverge over time? Convergence takes place when we observe a narrowing in differences between countries (Schmitt & Starke, Citation2011). We can measure convergence by comparing the variation of normal hours at two points in time. If statistical measures of dispersion, such as the standard deviation, have declined, countries have become more similar – indicating convergence. A Levene test for equality of variance was used to ascertain whether this change was significant, for example, if the decline in dispersion contributed to significant differences in the variance over time (Starke et al., Citation2010).
This is done in for each of the tree measures. The table shows a general trend of initial increasing divergence as working-time regulations were enacted at different paces and generosities for the various world regions documented, a trend that continued until the 1950s. Countries tended to converge after 1960, with the standard deviation declining from a top-point in 1950 of 23.35 to 9.64 in 2010. Therefore, to a remarkable extent, countries converged in normal hours in 2010. A Levene test revealed that we could reject the null hypothesis assuming variance homogeneity (p < 0.000) if we compare 1960 with 2010. The extent of this convergence was revealed by taking the long-term view, allowing us to identify periods of increasing dissimilarity and similarity.
Table 3. Degrees of convergence and divergence as indicated by standard Deviations for countries regulating working time, 1890–2010.
We now consider two central scope conditions present in public policy theories: first, whether they are autocratic or democratic; second, whether they are independent. If, for example, regulations are common in autocratic and dependent states, we need a theoretical framework that moves beyond the politics of public policy under democracy.
Democracies and autocracies
Did democracies regulate hours and have relatively lower work hours compared to autocracies? Using the polyarchy measure of electoral democracy from the V-dem dataset (Coppedge et al., Citation2021), ranging from 0 to 1, with 1 being fully democratic, I classify countries as democratic if polyarchy > 0.5. plots the share of countries that regulate hours, and plots average normal hours both by political regime from 1910 until 2010. One important thing to keep in mind is that sample composition changes over time, with countries moving from autocracy to democracy (or back).
Figure 5. Working-time regulation development for democracies and autocracies. (a) Development of share of countries with a Law regulating normal work hours by Political Regime. (b) Average normal work hours development for countries regulating working time by Political Regime.
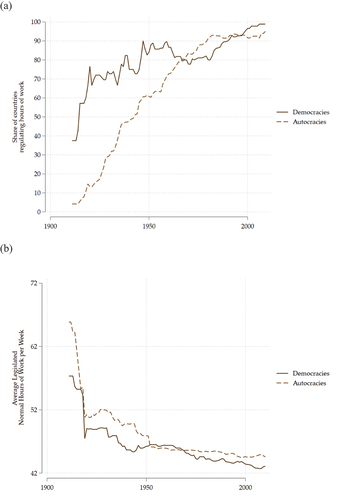
Two main conclusions can be drawn from these figures. First, democracies tended to be substantially more likely to regulate hours. This difference was especially striking during the 1920s and 30s. Nevertheless, autocracies narrowed this gap over time, and by the 1950s, regimes closely matched. During the decolonisation of the 1960s, new democracies with British colonial heritage (less likely to regulate hours for men) proved less likely to regulate hours after independence, whereas autocracies generally did. By 1967, a greater share of autocracies than democracies regulated hours. Entering the 1990s until today, democracies and autocracies were equally likely to regulate hours.
Although differences in the likelihood of regulating hours ended up trivial, this could be accompanied by democracies providing greater leisure than autocracies. shows that this was not the case over the long term. Initially, democracies had substantially lower hours, with an hour differential of 8. This gap was effectively closed by the immense reform wave in democracies and autocracies from 1917 to 1920. The gap reappeared with democracies continuing (with some exceptions) to lower hours starting in the 1930s as a likely response to the Depression. This gap amounted, however, to only 4 hr at most. However, following the Second World War, the gap sharply closed in the early 1950s with reforms in the Soviet sphere and French colonies. On average, autocracies then had lower hours than democracies, if only by 0.4 hours. This lasted until 1969/70, when democracies on average reduced hours to 1 or 2 below autocracies – a difference that remains to this day.
Independent and dependent polities
The next scope factor investigated was independent states, with presenting the share of independent and dependent polities regulating hours between 1910 to the end of decolonisation in 1970.Footnote11 By the end of 1920, only a handful of colonies regulated hours (for men), a substantial difference to the 40% of independent states that did. The 1920s witnessed a spread of labour regulations to the dependents, going up to 6% in 1922 when British Asiatic dependencies introduced regulation. By the end of that decade, the number rose to 21% as some French and Dutch and all Portuguese colonial possessions regulated hours. Whereas close to 80% of independent polities had regulated hours 3 decades later, the same number had risen to half of all dependent polities. What is striking from these results is the high degree to which dependencies, polities controlled by a foreign polity over which they had little influence, in fact regulated hours prior to decolonisation.
Figure 6. Working-time regulation development for dependent and independent states. (a) Development of share of countries with a Law regulating normal work hours by sovereignty Status. (b) Average normal work hours development for countries regulating working time by sovereignty Status.
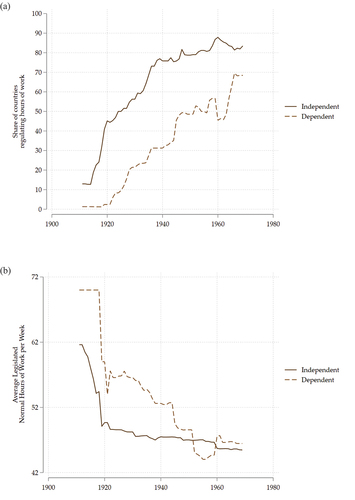
Were independent polities more likely than dependent polities to provide more leisure for their workers? Initially, yes; over time, no. presents the average regulated normal work hours for those that regulate hours per sovereignty status. Clearly, regulations in colonies and other dependencies initially substantially trailed those of independent states. Whereas independent states introduced the 48-hr laws between 1917 and 1922, dependent states specified 70 to 50 hr workweeks.
This initial distance was slowly reduced during the late 1920s and 1930s, with the first 48- and 40-hr laws introduced in North Africa and Indochina. Then things happened quickly. The 48-hr week became the norm in French continental Africa in 1945/6, substantially narrowing the gap between dependent and independent to only a few hours. Most striking, following the French code de travail extending the 40-hr week to all major dependencies from 1952 and similar developments in Belgian dependencies in 1957, dependent states, on average, had more generous regulation than independent states for normal hours. In tandem, the political regime and sovereignty descriptive findings clearly indicate the need revisit the underlying theoretical assumptions of public policy, usually formulated to explain politics in independent democracies. This point will be revisited in the conclusion.
Policy persistence and reform patterns
The previous sections documented a regional-dependent persistence in working-time regulation and a subsequent strong tendency for convergence. This raises the question first of whether convergence allows for the claim that working-time policy was characterised by strong path dependency and, second, if working time is path-dependent, what pattern do reforms follow?
To study the degree of path dependency, one can correlate previous decades of regulation on later years, with higher associations indicating stronger levels of persistence: specifically, using Spearman’s rank correlation to investigate whether country rank in normal hours in 1890 (and subsequent decades) corresponded with country rank in 2010. If persistence was high, we should expect rank-order correlations to be positive, with the coefficient size interpreted based on the number of years we are comparing prior to 2010.
shows a substantial rank-order correlation (0.33) as early as 1920. A correlation of 0.30 is not commonly used to signify strong associations. However, considering the 90-yr time lag discussed here, 0.30 indicates a substantial level of persistence. Contemporaneous regulations between 1950 and 1960 can predict about half of the country rankings in 2010 (60–50 yr later), and those of the 1980s can predict about two-thirds. In short, correlational findings show a clear and common pattern of working-time regulation persistence. The pattern of reform persistence found in the data-presentation section is therefore shown to be a general pattern of persistence also when using a correlation framework. The second question concerns the kind of path dependency that working time exhibits. Two major versions of the path-dependency argument have been prevalent in the social policy literature: Pierson’s (Citation2000) new institutionalist approach – an incremental change that, over time, can cumulatively lead to transformative change (Streeck & Thelen, Citation2005) or PET, in which public policy is characterised by significant periods of stability punctuated by transformative change (Baumgartner et al., Citation2017). The incrementalism perspective predicts that overall reform changes should follow a normal distribution (even if the tendency of reform is positive or negative; see Jensen, Citation2009, pp. 293–294, for an easy-to-understand introduction). On the other hand, the PET perspective predicts a leptokurtic distribution and that autocracies should experience more leptokurtic reform patterns than democracies (Baumgartner et al., Citation2017).
Table 4. Rank-order correlations between regulations in place each decade and 2010.
Because approaches have diverging implications for the likely causes of policy reform and could inform wider theoretical discussion, making it important to document reform patterns, I return to this in the Conclusion.
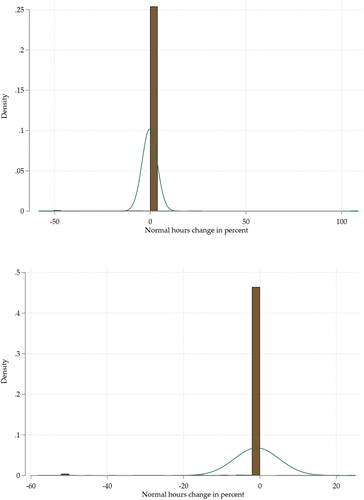
The results in align with the predicted distribution of a PET. The L-kurtosis scores above 0.1226 indicated a leptokurtic distribution in line with PET and against the incrementalism assumption of normal Gaussian distribution. To ascertain whether assigning 96 hr to countries without regulation biased the comparison, results are also shown for countries that regulated hours only. In addition, I disaggregate the L-kurtosis scores by regime because PET predicts higher leptokurtic distributions in autocracies than democracies (Baumgartner et al., Citation2017). shows the L-kurtosis scores per sample conditions (see also Appendix A3, and for a visual inspection test). All distributions are clearly leptokurtic, in line with the PET prediction. However, reform patterns were not substantially more leptokurtic in autocratic regimes, especially when comparing only regimes regulating hours. Working-time reforms were clearly path-dependent, following a punctuated development pattern with no large differences between political regimes. In the Conclusion, these various insights provided by the WTD are drawn into a coherent whole.
Table 5. L-Kurtosis scores for percentage change in normal hours compared to normal distribution.
Conclusion: implications for theory and future investigations
In facing the challenge of the working-time blindspot, this paper presents a new, manually coded, global dataset on working-time regulations since the 19th century. It allows the exploration of working-time reforms on a temporal and spatial scope never before undertaken, informing further theory-building and puzzles.
Working-time reforms are global in scope, rare but sizable once undertaken and tend to reduce and not increase work hours. Whereas latecomers are catching up on early reformers, the latter still have lower hours than latecomers today. Although democracies were historically more likely to regulate hours, this is not the case now. There has also never been a large gap in the content of regulations between autocracies or democracies, and differences have narrowed over time. Similar results are found for independent and dependent countries.Footnote12
These findings point to potential building blocks and insights valuable to understanding working-time reforms between the 19th and 21st centuries: first, the need for historical long-term studies; second, two possible explanatory frameworks consistent with the findings.
Methodological point
Considering the timing of reforms and that working time is strongly path-dependent, an historical approach is invaluable to understanding the impact and origins of current working-time regimes (cf. Møller, Citation2021). Most importantly, current regulations in, say 2010 May 2001have been put in place 50 to 60 years prior. Thus, whatever correlates with high or low working time in 2010 is unlikely to be what caused the adoption of those regulations in the 1950s or 1960s. Instead, supporters of those regulations in the 1960s may have become antagonists in 2010. Therefore, researchers should adopt a long-term perspective to explain working-time regulations.
Theory testing using the WTD data is, however, likely to be most advantageous when triangulated with additional micro-historical studies (Capoccia & Ziblatt, Citation2010). Here, the WTD data can be used to identify important reform periods in empires, regions and countries, allowing researchers to delve deeper into decisive reform episodes using qualitative and quantitative research strategies.
Explanatory frameworks
A theoretical framework is needed to understand how a starting point could be the close fit between the PET prediction pattern of long-term policy stability punctuated by transformative reforms and the reform pattern for working time. The PET argues that democracies, through various mechanisms, are more open to new information and have greater incentives to act on new information. Autocracies are more isolated from information updating, given the lack of an empowered opposition. Therefore, they see greater periods of stability and more massive changes in policy once the dam breaks (Baumgartner et al., Citation2017). However, this did not appear to be the case in this study. Instead, the prediction for autocracies aligned more with democracies. Further, theories that built on democracy or sovereignty as a scope condition or explanatory factor failed to predict the extensive reforms in autocratic and dependent regimes or the generous convergence between the groups.
I argue that a more fruitful starting point could be the global and regional nature of working-time reforms while recognising their reform patterns. Furthermore, a more policy-orientated perspective is needed. I contend that working-time reforms face greater hurdles than other reforms because they limit the economic gains certain public and private employers extract (Compston, Citation2001; Emmenegger & Marx, Citation2011; Kinderman, Citation2005; Paster, Citation2013; Rasmussen & Knutsen, Citation2023). Relevant groups are autocratic state leaders and their bureaucracies, landlords, colonial governors and private employers in general. This means that working-time regulation must contend with the strong antireform coalitions, whose specific compositions change in time and place, that are likely present in autocracies and democracies.
Some might argue that such a social-group theory of working-time reform would counter the reform patterns uncovered here because institutional struggles between social groups should lead to incremental changes (Jensen, Citation2009, p. 298; Pierson, Citation2000). Suppose we instead argue that these groups’ power is likely to be displaced only by powerful global and regional shocks displacing their policy control for a short time. In that case, we start to understand why we would see long periods of stability punctuated by radical reform. For example, Rasmussen and Knutsen (Citation2023) documented that the Bolshevik revolution played such a role, displacing the elites’ powerbase with strong preferences for unregulated labour markets outside of Russia (see also Paster, Citation2013). However, one could find additional major shocks, such as the world wars (Emmenegger & Marx, Citation2011; Obinger & Schmitt, Citation2020; Obinger et al., Citation2018; Scheidel, Citation2017) or other socialist revolutions (Sant’anna & Weller, Citation2020) that played similar roles (Castles, Citation2010).
An alternative interpretation of the social-group theory of working-time reform could emerge by opening the broad category of ‘employer’, distinguishing between employers more or less likely to bear the cost of high regulations (Kennard, Citation2020; Mares, Citation2003). Such employers could see regulations as advantageous, in that they would make it harder for other firms to compete. Progressive employers could ally with unions to work for reduced hours in their sector (Swenson, Citation2002), and support for regulations could emerge from a coalition of workers and employers. To the extent that employers could coordinate within international sectors, they could work to push regulations in several countries simultaneously.
A second group of theoretical explanations that also align with the characteristics observed in working-time reforms highlights norms and policy ideas. Instead of powerful groups inhibiting reforms, stability comes from relatively stable policy ideas and norms of what constitutes correct or legitimate labour standards (Béland & Cox, Citation2016; Béland, Citation2009; Hall, Citation1993). Radical global reform becomes possible with the adoption of new international labour standards (Koliev, Citation2022; Schmitt et al., Citation2015; Strang & Chang, Citation1993), norm change related to mass warfare (Scheve & Stasavage, Citation2016; Walter & Emmenegger, Citation2022) or policy change in model countries that others emulate (Obinger et al., Citation2013), leading to cascades of reforms on a regional or global scale.
Both perspectives might be fruitful starting points for understanding working-time reform. Certainly, there are other possible frameworks, and more work is clearly needed. A puzzle left for the community of scholars to theorise is what explains the major convergence in normal hours and, by extension, how this process took place without displacing the countries’ relative rank order over time. I hope the WTD allows future investigations into this and other puzzles.
Acknowledgment
For comments on an earlier version of this project, I am grateful to Carsten Jensen, Øyvind S. Skorge, Carl Henrik Knutsen and Tore Wig. Assistance from Donna Mandis Magnani and Vilde Stuvøy Heggen is gratefully acknowledged. Part of this paper was written on free espresso provided by Kampen Kaffe Oslo.
Disclosure statement
No potential conflict of interest was reported by the author.
Additional information
Funding
Notes on contributors
Magnus B. Rasmussen
Magnus B. Rasmussen is an Associate Professor of Political Science at University of South Eastern Norway (USN). His new short-book, Reforming to Survive: The Bolshevik Origins of Social Policies, is available from Cambridge University Press. His other research examines regime and party politics concerning welfare state development and is featured in journals such as World Politics, Comparative Political Studies, Journal of Comparative Politics, British Journal of Political Science, Politics and Society, and Social Science History.
Notes
1. Instead, seminal studies on working time have focused on actual work hours. For example, Golden (Citation1998), Burgoon and Baxandall (Citation2004), Huberman and Minns (Citation2007) and Burgoon and Raess (Citation2009, Citation2011) provide valuable insights on institutional, party and economic correlates of hours worked. Unfortunately, hours worked are only an indirect proxy for working-time regulation; it changes because of a host of other policy changes or labour-market factors. Therefore, we need data on regulations to clearly link political factors to working-hour policy.
2. Given the CBR’s breadth of data on a host of aspects, this is not surprising. Limitations must always be undertaken to make any data project possible. Following, I show that CBR and WTD provide highly correlated measures of working time.
3. This dataset has been used in two empirical studies to-date, Rasmussen and Knutsen (Citation2023) and Rasmussen (Citation2023).
4. The CBR dataset uses an alternative but equally valid approach. Adams et al. (Citation2017, p. 3) wrote, ‘Where different standards are set for different groups of workers, such as white-collar and blue-collar workers, the dataset codes for the minimal or less protective standards’. In general, CBR’s approach is to code the default applicable rule. Compared to the WTD, the problem with this solution is that it is uncertain which groups of employees or gender the final score may be referring. Its strength is in always coding the most applicable regulation.
5. This excludes a substantial part of workers around the world in the informal sector, who are relatively more ‘exposed than workers in formal employment to … to excessive hours of work’ (ILO, Citation2018, p. 64).
6. In the case of different rules for manufacturing industries, textile firm rules were coded.
7. However, reverse causality could also be present. It could be that unions and employers reduce hours through collective bargaining so that policymakers can push through legislation at little cost. In other words, these models do not rule out issues of reverse causality and should be interpreted as validity tests, not proving the importance of regulations vis-à-vis collective bargaining.
8. Congruence between WTD regulations and actual hours worked is likely shaped by wider institutions frameworks, such as the presence, strength and purview of labour inspectors and penal reactions for violations. Additional historical data-collection on these aspects remains an important pending task.
9. Instead, cross-sections for specific time points (e.g. 1919, 1928, 1968) could be assembled from ILO sources. For modern periods, datasets such as EIRO or CBR could be consulted and combined with the WTD to provide country-year data.
10. The CBR measures normal hours on a 0–1 scale. A limit of 35 hr or less scores 1, and a limit of 50 hr or more or no limit scores 0 between 1970 (or 1990s) and 2013. To gauge comparability, rank-order correlations between the two measures of normal hours were used.
11. To define an independent state, I used the v2svindep variable from V-dem (Coppedge et al., Citation2021), which classifies a polity as independent if it (a) has a relatively autonomous administration over some territory, and (b) the local actors or the state it depends upon considered it a distinct entity.
12. These differences would be even smaller if the model worker had been a woman because British dependencies, many of which did not regulate hours for men, tended to regulate hours for women (ILO, Citation1939).
References
- Adams, Z., Bishop, L., & Deakin, S. (2017). CBR labour regulation index ( Dataset of 117 countries). University of Cambridge Centre for Business Research.
- Baumgartner, F. R., Breunig, C., Green‐Pedersen, C., Jones, B. D., Mortensen, P. B., Nuytemans, M., & Walgrave, S. (2009). Punctuated equilibrium in comparative perspective. American Journal of Political Science, 53(3), 603–620. https://doi.org/10.1111/j.1540-5907.2009.00389.x
- Baumgartner, F. R., Carammia, M., Epp, D. A., Noble, B., Rey, B., & Yildirim, T. M. (2017). Budgetary change in authoritarian and democratic regimes. Journal of European Public Policy, 24(6), 792–808. https://doi.org/10.1080/13501763.2017.1296482
- Béland, D. (2009). Ideas, institutions, and policy change. Journal of European Public Policy, 16(5), 701–718. https://doi.org/10.1080/13501760902983382
- Béland, D., & Cox, R. H. (2016). Ideas as coalition magnets: Coalition building, policy entrepreneurs, and power relations. Journal of European Public Policy, 23(3), 428–445. https://doi.org/10.1080/13501763.2015.1115533
- Béland, D., & Schlager, E. (2019). Varieties of policy feedback research: Looking backward, moving forward. Policy Studies Journal, 47(2), 184–205. https://doi.org/10.1111/psj.12340
- Botero, J. C., Djankov, S., Porta, R. L., Lopez de Silanes, F., & Shleifer, A. (2004). The regulation of labor. The Quarterly Journal of Economics, 119(4), 1339–1382. https://doi.org/10.1162/0033553042476215
- Bowles, S. (2011). Cultivation of cereals by the first farmers was not more productive than foraging. Proceedings of the National Academy of Sciences, 108(12), 4760–4765. https://doi.org/10.1073/pnas.1010733108
- Brooke, E. (1898). A tabulation of the factory laws of European countries. Grant Richards.
- Burgoon, B., & Baxandall, P. (2004). Three worlds of working time: The partisan and welfare politics of work hours in industrialized countries. Politics & Society, 32(4), 439–473. https://doi.org/10.1177/0032329204269983
- Burgoon, B., & Raess, D. (2009). Globalization and working time: Working hours and flexibility in Germany. Politics & Society, 37(4), 554–575. https://doi.org/10.1177/0032329209349224
- Burgoon, B., & Raess, D. (2011). Does the global economy mean more sweat? Trade, investment, migration and working hours in Europe. Socio-Economic Review, 9(4), 699–727. https://doi.org/10.1093/ser/mwr007
- Capoccia, G., & Ziblatt, D. (2010). The historical turn in democratization studies: A new research agenda for Europe and beyond. Comparative Political Studies, 43(8–9), 931–968. https://doi.org/10.1177/0010414010370431
- Castles, F. G. (2010). Black swans and elephants on the move: The impact of emergencies on the welfare state. Journal of European Social Policy, 20(2), 91–101. https://doi.org/10.1177/0958928709358793
- Compston, H. (2001). Social partnership, welfare state regimes and working time in Europe. In B. Ebbinghaus & P. Manow (Eds.), Comparing welfare capitalism: Social policy and political economy in Europe, Japan and the USA (pp. 125–145). Routledge.
- Coppedge, M., Gerring, J., Knutsen, C. H., Lindberg, S. I., Teorell, J., Altman, D., Bernhard, M., Cornell, A., Fish, M. S., Gastaldi, L., Gjerløw, H., Glynn, A., Hicken, A., Lührmann, A., Maerz, S. F., Marquardt, K. M., McMann, K. M., Mechkova, V., Paxton, P. … Ziblatt, D. (2021). V-Dem Codebook V12. https://www.v-dem.net/static/website/img/refs/codebookv12.pdf
- Cross, G. S. (1984). The quest for leisure: Reassessing the eight-hour day in France. Journal of Social History, 18(2), 195–216. https://doi.org/10.1353/jsh/18.2.195
- Emmenegger, P., & Marx, P. (2011). Business and the development of job security regulations: The case of Germany. Socio-Economic Review, 9(4), 729–756. https://doi.org/10.1093/ser/mwr013
- Feenstra, R. C., Inklaar, R., & Timmer, M. P. (2015). The next generation of the Penn world table. American Economic Review, 105(10), 3150–3182. https://doi.org/10.1257/aer.20130954
- Ferrarini, T., Nelson, K., Korpi, W., & Palme, J. (2013). Social citizenship rights and social insurance replacement rate validity: Pitfalls and possibilities. Journal of European Public Policy, 20(9), 1251–1266. https://doi.org/10.1080/13501763.2013.822907
- Frankel, E. (1924). The eight-hour day in Germany. Journal of Political Economy, 32(3), 315–334. https://doi.org/10.1086/253598
- Golden, L. (1998). Working time and the impact of policy institutions: Reforming the overtime hours law and regulation. Review of Social Economy, 56(4), 522–541. https://doi.org/10.1080/00346769800000048
- Grünewald, A. (2021). From benefits and beneficiaries: The historical origins of old-age pensions from a political regime perspective. Comparative Political Studies, 54(8), 1424–1458. https://doi.org/10.1177/0010414021989763
- Hall, P. A. (1993). Policy paradigms, social learning, and the state: The case of economic policymaking in Britain. Comparative Politics, 25(3), 275–296. https://doi.org/10.2307/422246
- Huberman, M. (2012). Odd couple: International trade and labor standards in history. Yale University Press.
- Huberman, M., & Minns, C. (2007). The times they are not changin’: Days and hours of work in old and new worlds, 1870–2000. Explorations in Economic History, 44(4), 538–567. https://doi.org/10.1016/j.eeh.2007.03.002
- International Labour Organization [ILO]. (1939) . The law and women’s work: A contribution to the study of the status of women. International Labour Office.
- International Labour Organization [ILO]. (2018) . Women and men in the informal economy: A statistical picture. International Labour Office.
- International Labour Organization [ILO]. (2023). ILO Modelled Estimates Database, ILOSTAT [ database]. https://ilostat.ilo.org/data/
- Jensen, C. (2009). Policy punctuations in mature welfare states. Journal of Public Policy, 29(3), 287–303. https://doi.org/10.1017/S0143814X09990080
- Kennard, A. (2020). The enemy of my enemy: When firms support climate change regulation. International Organization, 74(2), 187–221. https://doi.org/10.1017/S0020818320000107
- Kinderman, D. (2005). Pressure from without, subversion from within: The two-pronged German employer offensive. Comparative European Politics, 3(4), 432–463. https://doi.org/10.1057/palgrave.cep.6110064
- Kjelstadli, K. (1992). Fortida er ikke hva den en gang var. En innføring i historiefaget [The past is not what it once was: An introduction to the subject of history]. Universitetsforlaget.
- Knutsen, C. H., & Rasmussen, M. B. (2018). The autocratic welfare state resource distribution, credible commitments and political survival. Comparative Political Studies, 51(5), 659–695. https://doi.org/10.1177/0010414017710265
- Koliev, F. (2022). Promoting international labour standards: The ILO and national labour regulations. The British Journal of Politics and International Relations, 24(2), 361–380. https://doi.org/10.1177/13691481211027513
- Magnusson, L. (1919). Hours of labor in foreign countries. The ANNALS of the American Academy of Political and Social Science, 83(1), 202–232. https://doi.org/10.1177/000271621908300116
- Mares, I. (2003). The politics of social risk: Business and welfare state development. Cambridge University Press.
- Messenger, J. C., Lee, S., & McCann, D. (2007). Working time around the world: Trends in working hours, laws, and policies in a global comparative perspective. Routledge.
- Møller, J. (2021). Reading history forward. PS: Political Science & Politics, 54(2), 249–253. https://doi.org/10.1017/S104909652000092X
- Obinger, H., Petersen, K., & Starke, P. (2018). Warfare and welfare: Military conflict and welfare state development in western countries. Oxford University Press.
- Obinger, H., & Schmitt, C. (2020). World war and welfare legislation in Western countries. Journal of European Social Policy, 30(3), 261–274. https://doi.org/10.1177/0958928719892852
- Obinger, H., Schmitt, C., & Starke, P. (2013). Policy diffusion and policy transfer in comparative welfare state research. Social Policy & Administration, 47(1), 111–129. https://doi.org/10.1111/spol.12003
- Pallage, S., Scruggs, L., & Zimmermann, C. (2013). Measuring unemployment insurance generosity. Political Analysis, 21(4), 524–549. https://doi.org/10.1093/pan/mpt011
- Paster, T. (2013). Business and welfare state development: Why did employers accept social reforms? World Politics, 65(3), 416–451. https://doi.org/10.1017/S0043887113000117
- Pierson, P. (2000). Increasing returns, path dependence, and the study of politics. American Political Science Review, 94(2), 251–267. https://doi.org/10.2307/2586011
- Rasmussen, M. B. (2023). The Politics of time: The Political origins of working-time regulation. Social Science History, 1–27. Advance online publication. https://doi.org/10.1017/ssh.2023.18
- Rasmussen, M. B., & Knutsen, C. H. (2023). Reforming to survive: The Bolshevik origins of social policies. Cambridge University Press.
- Ronconi, L. (2019). Enforcement of labor regulations in developing countries. IZA World of Labor, 2019, Article 457. 10.1518/5izawol.457
- Sant’anna, A. A., & Weller, L. (2020). The threat of communism during the cold war: A constraint to income inequality? Comparative Politics, 52(3), 359–393. https://doi.org/10.5129/001041519X15615651139989
- Scheidel, W. (2017). The great leveler. Princeton University Press.
- Scheve, K., & Stasavage, D. (2016). Taxing the rich. A history of fiscal fairness in the United States and Europe. Princeton University Press.
- Schmitt, C., Lierse, H., Obinger, H., & Seelkopf, L. (2015). The global emergence of social protection: Explaining social security legislation 1820–2013. Politics & Society, 43(4), 503–524. https://doi.org/10.1177/0032329215602892
- Schmitt, C., & Starke, P. (2011). Explaining convergence of OECD welfare states: A conditional approach. Journal of European Social Policy, 21(2), 120–135. https://doi.org/10.1177/0958928710395049
- Starke, P., Obinger, H., & Castles, F. G. (2010). Convergence towards where: In what ways, if any, are welfare states becoming more similar? Journal of European Public Policy, 15(7), 975–1000. https://doi.org/10.1080/13501760802310397
- Strang, D., & Chang, P. M. Y. (1993). The International Labor Organization and the welfare state: Institutional effects on national welfare spending, 1960–80. International Organization, 47(2), 235–262. https://doi.org/10.1017/S0020818300027934
- Streeck, W., & Thelen, K. (2005). Beyond continuity: Institutional change in advanced political economies. Oxford University Press.
- Swenson, P. (2002). Capitalists against markets: The making of labor markets and welfare states in the United States and Sweden. Oxford University Press.
- Thompson, E. P. (1967). Time, work-discipline, and industrial capitalism. Past & Present, 38(1), 56–97. https://doi.org/10.1093/past/38.1.56
- Walter, A., & Emmenegger, P. (2022). Does war exposure increase support for state penetration? Evidence from a natural experiment. Journal of European Public Policy, 29(5), 652–669. https://doi.org/10.1080/13501763.2021.1992482
Appendix
The working time dataset contains information for more than 200 countries from 1789 to 2010 for maximum hours and overtime remuneration, and 221 for normal hours of work. However, the public dataset is restricted to the 197 countries for which the Varieties of Democracy project provide country codes and ends in 2010. Appendix provides full country-year oversight and country means for normal hours, maximum hours and overtime remuneration.
Appendix and present additional regional averages for maximum hours and overtime remuneration not in the paper proper for space reasons. However, these figures are referenced in the paper and I will not repeat the results here.
Appendix and present histograms over percentage change in normal hours to allow visual inspection of normality or Leptokurtotic. If the distribution follows a Gaussian normal distribution, it should resemble a bell curve with a fairly large bulk of very small changes (some practically zero), a smaller bulk of medium changes and no large changes. A Leptokurtotic distribution is present when the distribution contains more observations at the centre and at extremes than normally distributed observations.
Appendix and provide the regression results for regressing the share of informal workers () and share of informal workers working extreme hours (). Results are interpreted in the text.
Appendix B provide a full overview of the sources used to collect the Working Time Dataset and both are avaliable for download at https://www.magnusbrasmussen.com/research
A1.
Overview for the working time dataset (WTD)
Table A1.1. Start and end year for countries included in WTD.
A2.
Additional illustrative figures for maximum hours and overtime remuneration per world region
Figure A2. A2.1a Development of maximum hours of work. Figure A2.1b development of overtime remuneration for countries regulating working time per world regions.
A3.
Histograms of percentage change in normal hours per week
Figure A3.1a. histogram showing distribution of percentage changes in normal hours per week for whole sample Figure A3.1b histogram showing distribution of percentage changes in normal hours per week for countries with law regulating hours of work.
A4.
Additional regression results on normal hours and informal sector employment (share employed in the informal sector, ILO Citation2023) and informal sector work hours (share workers in the informal sector working at or above 49 hr per week, ILO Citation2023)
Table A4.1. Ordinary least squares regression on share of workers employed in the informal economy (ILO 2023).
Table A4.2. Ordinary least squares regression on share of informal sector workers working at or above 49 hr per week (ILO 2023).