
 ?Mathematical formulae have been encoded as MathML and are displayed in this HTML version using MathJax in order to improve their display. Uncheck the box to turn MathJax off. This feature requires Javascript. Click on a formula to zoom.
Abstract
Protein folding can be described as a downhill process that brings the configuration of a chain of amino acids down to the bottom of a smooth free-energy funnel. Here, we use a recently developed coarse-grained protein model to assess the importance of frustration in the folding free-energy landscape. We compare the landscapes of natural proteins, computationally designed sequences, and structure-based potentials that force the contacts between the amino acids to adopt the native structure. Our results show that the structure-based potentials give a poor representation of the folding free-energy landscape, and that frustration is not just a perturbation over an otherwise perfect downhill folding.
The ‘minimal frustration principle’ (MFP) [Citation1,Citation2] describes protein folding as a downhill sliding process in a low frustration energy landscape (‘funnelled’ shaped) towards the native state. While the validity of MFP has been confirmed for lattice heteropolymers [Citation3–10], in more realistic protein representations, a residual frustration is often observed, which prevents the systematic prediction of the native structure of natural sequences.
Following the MFP, many studies have shown a strong correlation between the topology of the native structure and the folding dynamics. In particular, structure-based potentials (also known as Go-type models [Citation11–13]) have been used to shed light on the underling mechanisms of folding and on the thermodynamic of this process [Citation14–29]. The degree of success of the Go-type models strongly depends on the level of frustration present in the real folding free-energy landscape and also on the accuracy of the target structure used to build the interaction potentials [Citation26]. In this work, we consider a set of protein structures and compute the folding free-energy landscape for their natural sequence, for a designed sequence and for a suitably chosen Go-type potential. For the systematic comparison between the folding of the different systems, the chosen model would need to quantitatively describe the equilibrium folded state of natural and artificial proteins. Unfortunately, protein design, even if only in silico, is still a rather difficult task to be achieved with coarse-grained models and, except few notable examples [Citation30–38], it has been extremely difficult to artificially construct sequences capable of folding in vitro into given target protein structures. This difficulty could explain why, to the best of our knowledge, the folding of Go and designed proteins have not been so far compared. In this regard, we have recently introduced the Caterpillar model [Citation39], which we extended to perform both quantitative protein design and folding [Citation40], making the perfect tool for this study. It is important to stress that, regardless of the accuracy of the model, the comparison between the designed and the Go-like models is valid even if the natural folding landscape of the tested proteins looks different from the one predicted by the Caterpillar model. In fact, the MFP does not make any assumptions on the details of the model used to describe the proteins. This universality suggests that, within each model representation that satisfies the MFP, designed proteins (i.e. that fold to their target structures) should still fold along funnels that are more frustrated compared to the one predicted by ideal structure-based potentials. Hence, quantitatively comparing the folding free-energy landscape of Go-like potentials to designed sequences, is an ideal test to quantify the frustration brought about by a 20-letter alphabet. Moreover, within the scope of this study, the native sequences should be regarded as more frustrated sequences, compared to the computer-generated ones, obtained from an unknown constrained design procedure. In the following, we will show that there is an overlap between the Go and the Caterpillar free energies, but only in a small region of the configurational space and not for all tested proteins. A Caterpillar protein has a backbone, represented by five-atoms, free to rotate around the torsional angles φ1 and φ2, while the side chains are represented as spheres centred on the C
α atoms (see ); all other structural parameters are kept fixed at values taken from the literature [Citation41]. Note that here and in the following, energies are given in units of k
B
T
Ref, where T
Ref is a reference temperature that sets the scale of the interactions, hence all simulation temperatures are given in units of T
Ref. It is important to stress that T
Ref is not necessarily the folding temperature or the environment temperature, but all the energies can be rescaled to have T
Ref matching the physical temperature. Backbone hydrogen bonds are modelled with a 10–12 generalised Lennard-Jones potential using the expression [Citation42]
(1)
(1) where r
OH is the distance between the hydrogen atom of the amide group (NH) and the oxygen atom of the carboxyl group (CO) of the main chain. The θ angles are defined as the one under the arches COH and OHN (see ). We set σ = 2.0 Å, ε
H
= −3.1 k
B
T
Ref, and ν = 2 [Citation42]. The side chain interactions are represented by an effective C
α–C
α sphere–sphere interaction energy given by
(2)
(2) where W = 0.4 Å, r
ij
is the distance between the C
α atoms at the centres of spheres i and j, and r
max = 12 Å is the distance at which E
ij
= ε
ij
/2. The ε
ij
are the elements of a 20 by 20 matrix, previously optimised under the condition that a large number of sequences designed for 125 test proteins are energetically equivalent (including the interactions with the solvent) to the corresponding natural sequences (see Table S1 in [Citation40]). The residue–solvent interaction is modelled as a simple energy penalty towards surfaces exposure of hydrophobic amino acids; the expression has the form
(3)
(3) where Γ(r
ij
) is given in Equation (Equation2
(2)
(2) ), Ω
i
= ∑
j
Γ(r
ij
) and Ω = 21.0 ± 0.5 is the threshold for the number of contacts in the native structure above which the amino acid is considered to be fully buried and the
are taken from the Dolittle hydrophobicity index [Citation43] and are positive for hydrophobic amino acids and negative of the hydrophilic ones. The interaction penalises the exposure (burying) of hydrophobic (hydrophilic) residues above Ω. The formation of sulphur bridges as well as Proline rigid bonds is not included. The total energy of a protein E is then given by
(4)
(4) where α = 0.10 ± 0.01 k
B
T
Ref and E
HOH = 0.015 ± 0.001 are scaling factor necessary to balance the contributions to the total energy.
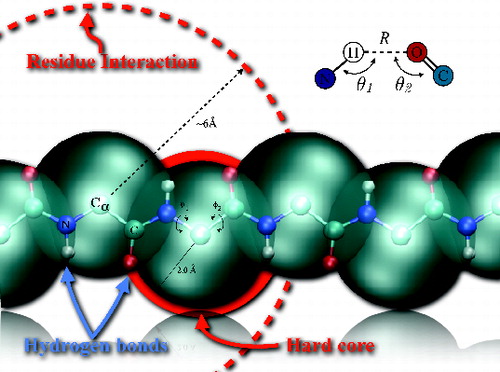
Figure 1. Real-space representation of the five-atoms (N blue, O red, C and C
α light blue and H in white) backbone of the Caterpillar model. The large blue spheres represent the self-avoidance volume that have a radius R
HC
= 2.0 Å of the C
α atoms, while the interaction sphere radius of each residue is represented by the large dashed circle of radius 6 Å(see Equation (Equation2(2)
(2) ) in Methods). The hydogen bond betwen the H and O atoms interact through a generlised 10–12 Lennard-Jones potential tuned with a quadratic orientation term that selects for the alignment of the C, H, O, and N atoms involved in a bond (see top right inset and Equation (Equation1
(1)
(1) )). The backbone fluctuates only around the torsional angles φ1 and φ2.
Here we will show that the Go-type potential is equivalent to the Caterpillar model when describing the folding close to the native structure especially when compared to purposely designed sequences. By contrast, the comparison rapidly and systematically worsens when moving in the configurational space further away from the native state. Hence, although the fluctuations around the native state are reasonably represented, in most cases, the relative weights of the unfolded structures are suppressed, thus overestimating the funnel nature of the landscape. In what follows, we will refer to the Caterpillar model potential as ‘unconstrained’, and to the Go-like potential as ‘constrained’ reflecting the nature of the Go-like potentials that favours the folding towards the native state. In this framework, the folding simulation of the designed and natural sequences will be unconstrained and we will compare the results to the simulation of the constrained scenario based on the Go calculations.
We began our study by considering the list of 15 test proteins used by Coluzza in Ref. [Citation40] for which we already calculated the folding free-energy profile of the native and designed sequences (see Table S4 [Citation40]) and we showed that the native states correspond to the global free-energy minimum. In what follows, we will refer to the test proteins using their protein data bank identities (IDs) (PDB ID), a complete list is in Table S1 in Ref. [Citation40]. These 15 proteins are used as benchmark to test proteins models (from Tsai et al. [Citation44] and from the 9th edition of the well-known Critical Assessment of Techniques for Protein Structure Prediction [Citation45]). Our aim is to compare, within the framework of our model, the folding of these 15 proteins in the scenarios where the interactions between the residues are either natural, optimised through a sequence design or imposed by the native structure with a Go-like potential. Several methods have been proposed to design the sequence of proteins, such that they fold into a specific target conformation [Citation7,Citation46–48], but in this work we are going to use a method recently introduced by Coluzza [Citation39,Citation40], which was proven capable of producing realistic protein sequences for the Caterpillar model. For the constrained simulations, instead we replaced the residue–residue interactions of the Caterpillar model with a structure-based potential taken from the elastic network model [Citation12,Citation13]. Hence, we replaced the 20-letter residue–residue interactions with a harmonic potential centred on the C
α atoms:
(5)
(5) where r is the distance between each pair of residues, r
Native is the distance between the same residues in the native structure, and R
int = 12 Å is the range of the C
α − C
α interactions in the Caterpillar model. Interactions with an effective solvent in Equation (Equation3
(3)
(3) ) are not included during the constrained simulations.
Once we obtained the designed sequences we did proceed to the folding free-energy calculations and we compared the behaviour of unconstrained and constrained proteins. All folding simulations were started from a stretched configuration like in . We then applied a sequence of pivot and crankshaft moves [Citation49], which are accepted or rejected according to a Metropolis-like acceptance criterion. During the simulation, for each protein, the sampled configurations were organised according to two collective variables, namely the distance root mean square displacement (DRMSD) from the native structure, and the number of backbone hydrogen bonds. The DRMSD is a standard collective variable used in the field of protein folding to measure the state of the folding transition. Given a target structure, the DRMSD is defined as
(6)
(6) where
is the distance between spheres i and j, while
is the same distance calculated over the target structure, and N is the chain length. According to Equation (Equation6
(6)
(6) ), DRMSD =0 is possible only when the chain and the target structures are identical. Any structural difference will correspond to larger values of DRMSD, and the larger the value of DRMSD the larger is the number of structures that share the same DRMSD from the target. In order to sample the configurational space, we applied the virtual move parallel tempering biasing scheme to help the simulations to exit local free-energy traps that are very frequent especially in the unconstrained scenario [Citation50].
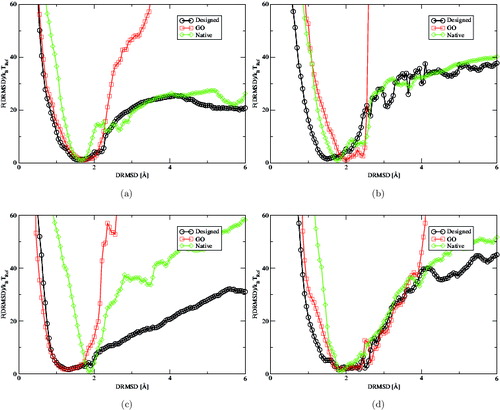
In , we show the free-energy profiles of the 1gab, 1pou, 2l09, and 3boh proteins. The plots show that the degree of accordance between the constrained and unconstrained simulations varies enormously. The striking difference is the low weight of the constrained unfolded configurations (DRMSD > 3 Å) compared to native and designed sequences. In fact, whenever the constrained and unconstrained simulations do match, they do so only in a small region around the global minimum. Altogether, these results suggest that the constrained protein models are not generally capable of describing realistic folding free-energy landscapes, mainly because the frustration inherent to the limited alphabet size is not a small perturbation and it strongly affects the probability of observing a misfolded or unfolded configuration with respect to the native one. This aspect is also confirmed by the frequent agreement between the designed and native profiles. Such an agreement is not observed in all cases, but it is hardly surprising, considering the difference between an evolutionary selection and the design algorithm employed here. However, it is interesting to remark how the folding free-energy profiles corresponding to the natural sequence tend to be always steeper than the designed ones. This feature is, for instance, quite evident for the folding energy profile of 2109 ((c)) and we believe it is due to the approximate interaction of the residues with the solvent, which causes the natural sequences to adopt slightly more compact configurations and overestimates the stability of the folded structures.
Figure 2. Folding free-energy landscape F(DRMSD)/k B T Ref as a function of DRMSD of four trial proteins (PDB IDs chain A of (a) 1gab, (b) 1pou, (c) 2l09, (d) 3obh) at T = 0.6 for (a) and T = 0.8 for the others. All profiles have a global minimum around 1.5 and 2 Å DRMSD with a smooth funnelled shape. This figure represents a showcase of the typical differences observed among constrained and unconstrained simulations. Qualitatively the unconstrained simulations behave similarly even if the designed sequences tend to fold more precisely to the target structure. The constrained model on the other hand does not compare well with the designed unconstrained proteins above DRMSD=2 Å, the only exceptions are 3obh and 3nmd (see ). The main reason for such discrepancy is the effect of the frustration, which is unavoidable when proteins are designed with a 20-letter alphabet.
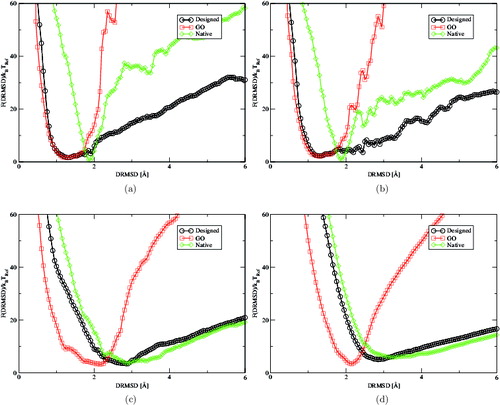
In instead, we compare the folding free energy of 2l09 upon increasing temperature, in reduced units, from T = 0.8 to T = 1.8, at which the unconstrained proteins are unfolded. The figure shows how the steep folded profiles of the natural sequence starts to relax upon increasing temperature, rapidly approaching the profile of the designed 2l09. We did expand our study to include an analysis at intermediate temperatures, mainly because these results already demonstrate that the unconstrained simulations, although quantitatively different, show a qualitatively similar physical behaviour, while the constrained proteins do not even unfold at the highest temperatures. One reason behind such a difference is that the constrained potentials have a lower average energy compared to the unconstrained ones. However, the energy difference is not enough to account for the mismatch, because the shape of the profiles is different even when compared across the simulated temperature range. In other words, even if the energy of the folded constrained proteins is on average 40% lower than the one of the corresponding designed sequence, the Go free-energy profiles are still way off even at more than twice the temperature (results not shown).
Figure 3. Folding free-energy landscape F(DRMSD)/k B T Ref as a function of DRMSD of 2l09 at (a) T = 0.8 (b) T = 1.0 (c) T = 1.4 and (d) T = 1.8. In this figure, we compare the unfolding of the constrained and unconstrained models. At low temperature, the native sequence has a steep profile with a sharp minimum around DRMSD=1.8 Å, caused by the tendency of the natural sequence to form more compact configurations. This effect is probably due to the approximated solvent–residue interactions of the Caterpillar model. The profiles show that upon increasing the temperature, the agreement between the native and designed sequences increase, while the constrained proteins remain folded even at the highest temperature.
Another important point that we took into account is the effect of the sequence alterations on the landscape. A different degree of frustration can be added to the design procedure by additional conditions that reject sequences with unwanted properties. We then considered the sequences produced in Ref. [Citation40] with no amino acids repeats, which we verified could still fold in the target structures. The no-repeat condition for some proteins has a measurable effect on the frustration of the folding process. For instance, in the case of the non-repeating sequence designed for the protein 3nmd (see ), upon increasing temperature, the folding free-energy starts to behave differently compared to the one corresponding to the sequences obtained with the standard design procedure. The 3nmd is a special case because of the particularly simple target structure made of a single long α-helix. In this case, all scenarios show low frustration folding pathways, with folding free-energy profiles of the constrained and unconstrained models overlapping at low temperature. However, even for this ideal scenario, the native sequence, upon increasing temperature at T = 0.8, starts to show a deviation that interestingly is present also for the no-repeat sequence. The message is that different sequences, including natural ones, might have a very different folding landscape with large variations, even if they have the same equilibrium folded configuration; such a variability cannot be captured by constrained models.
Figure 4. Folding free-energy landscape F(DRMSD)/k B T Ref as a function of DRMSD of the designed protein leucine zipper (PDB ID 3nmd). at (a) T = 0.6 and (b) T = 0.8, both temperatures are below the folding one. All profiles have a global minimum very close to the target structure at 0 Å DRMSD with a smooth funnel shape. This particular example was the only case in which we observed a good agreement between the constrained and unconstrained landscapes. The constrained profile (blue triangles) corresponds to the folding of a sequence designed without allowing for amino acids repeats (see Table S6[Citation40]). It is interesting to notice that such sequences tend to behave more like the natural ones upon the increase in temperature.
![Figure 4. Folding free-energy landscape F(DRMSD)/k B T Ref as a function of DRMSD of the designed protein leucine zipper (PDB ID 3nmd). at (a) T = 0.6 and (b) T = 0.8, both temperatures are below the folding one. All profiles have a global minimum very close to the target structure at 0 Å DRMSD with a smooth funnel shape. This particular example was the only case in which we observed a good agreement between the constrained and unconstrained landscapes. The constrained profile (blue triangles) corresponds to the folding of a sequence designed without allowing for amino acids repeats (see Table S6[Citation40]). It is interesting to notice that such sequences tend to behave more like the natural ones upon the increase in temperature.](/cms/asset/436cf9b0-a5d3-4b84-bb6b-2b4f39b7f5f7/tmph_a_1043031_f0004_oc.jpg)
The last observation we make concerns the coarse graining associated to the use of constrained interactions. Since the interactions formalised in Equation (Equation5(5)
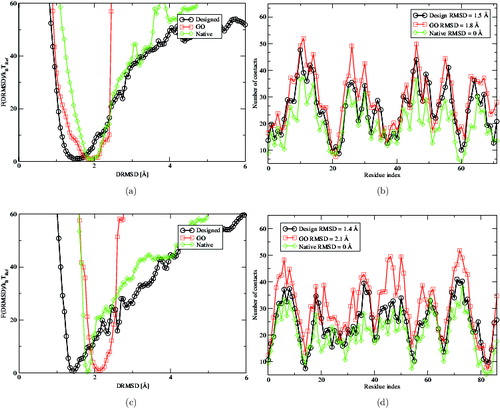
(5) ) are only attractive, the lowest energy configurations will tend to be more compact than natural proteins. In , we show two proteins where this defect of constrained models is particularly evident. The free-energy profiles of the constrained simulations perform significantly worse than the designed sequences, and this is surprising considering that the Go-like systems should correspond to the ideal designed scenario. However, this is true only for highly compact target structures, but this condition is not satisfied by all proteins.
Figure 5. Folding free-energy landscape F(DRMSD)/k B T Ref as a function of DRMSD of the designed 1leb at T = 0.6, and 2kyw at T = 0.8. As for the other simulations, also in this case, all profiles have a global minimum around 1.5 and 2 Å DRMSD with a smooth funnel shape. The constrained simulations perform worse than the designed one and we identified the reason in the tendency of Go potentials to form highly compact configurations that are not always compatible with the native structure. The heterogeneous potential used for the design, thanks to the repulsive nature of some of the interactions, is capable of stabilising slightly more open structures.
According to the MFP, the constrained model should represent the perfect folding landscape and the natural frustration induced by the evolutionary selection process is a perturbation that should not influence the description of the folding process itself. We did put to the test this hypothesis comparing the Caterpillar model to a Go-like protein model. The latter is based on the Caterpillar model itself, where we only replaced the 20-letter alphabet with attractive interactions among the residue in contact with the native structure and null otherwise. In this way, we could perform a fair comparison between optimised and frustration free sequences, regardless of the capacity of the model to describe the folding of real proteins. We compared the folding of Go-like proteins potential and of both natural and designed realistic protein sequences. The results indicated that the un-frustrated folding of Go-like potentials is both quantitatively and qualitatively different to the folding of more natural sequences limited to a 20-letter alphabet. In particular, we observed that during the folding of constrained proteins, the unfolded states are not well represented and the range of agreement with the unconstrained Caterpillar model is usually limited to a very small region of phase space. A good agreement was found only for low temperatures (e.g. for protein 3nmd) and not for all sequences. Finally, the purely attractive nature of Go models is effective only for highly compact target structures, while the frustration inherent to a 20-letter alphabet allows to design sequences even for proteins where the constrained models refold poorly. In conclusion, the frustration present in natural sequences is probably not a perturbation. Hence, in order to properly describe the folding process, a coarse grained model should not rely on a structure-based potential, but instead include a minimum set of molecular features that reduces the frustration of the phase space to the point where the folding of designed proteins is successful. In this way, the MFP is satisfied without imposing artificial constraints that are so strong that they completely distort the folding process. The Caterpillar model is one possible solution and is an ideal starting point to develop, following the same design principles, of more detailed models.
Acknowledgements
We would like to thank Peter van Oostrum, Barbara Capone, Lorenzo Rovigatti, and Christoph Dellago for fruitful discussions and a critical reading of the manuscript. All simulations presented in this paper were carried out on the Vienna Scientific Cluster (VSC).
Disclosure statement
No potential conflict of interest was reported by the author.
Additional information
Funding
References
- J.D. Bryngelson and P.G. Wolynes , Proc. Natl. Acad. Sci. USA 84 , 7524 (1987).
- P.G. Wolynes , W.A. Eaton , and A.R. Fersht , Proc. Natl. Acad. Sci. 109 , 17770 (2012).
- E.I. Shakhnovich and A.M. Gutin , Proc. Natl. Acad. Sci. USA 90 , 7195 (1993).
- A.M. Gutin and E. Shakhnovich , J. Chem. Phys. 98 , 8174 (1993).
- E. Shakhnovich , Phys. Rev. Lett. 72 , 3907 (1994).
- E.I. Shakhnovich and A.M. Gutin , Nature 346 , 773 (1990).
- I. Coluzza , H.G. Muller , and D. Frenkel , Phys. Rev. E 68 , 46703 (2003).
- I. Coluzza and D. Frenkel , Phys. Rev. E 70 , 51917 (2004).
- I. Coluzza and D. Frenkel , Biophys. J. 92 , 1150 (2007).
- S. Abeln and D. Frenkel , PLoS Comput. Biol. 4 , e1000241 (2008).
- N. Go , Ann. Rev. Biophys. Bioeng. 12 , 183 (1983).
- M. Tirion , Phys. Rev. Lett. 77 , 1905 (1996).
- A.R. Atilgan , S.R. Durell , R.L. Jernigan , M.C. Demirel , O. Keskin , and I. Bahar , Biophys. J. 80 , 505 (2001).
- K.W. Plaxco , K.T. Simons , and D. Baker , J. Mol. Biol. 277 , 985 (1998).
- J.E. Ollerenshaw , H. Kaya , H.S. Chan , and L.E. Kay , Proc. Natl Acad. Sci. USA 101 , 14748 (2004).
- V. Tozzini , Curr. Opin. Struct. Biol. 15 , 144 (2005).
- J.I. Sukowska and M. Cieplak , Biophys. J. 95 , 3174 (2008).
- C. Clementi , Curr. Opin. Struct. Biol. 18 , 10 (2008).
- A. Shehu , L.E. Kavraki , and C. Clementi , Proteins 76 , 837 (2009).
- P.C. Whitford , J.K. Noel , S. Gosavi , A. Schug , K.Y. Sanbonmatsu , and J.N. Onuchic , Proteins 75 , 430 (2009).
- M. Larriva , L. Prieto , P. Bruscolini , and A. Rey , Proteins 78 , 73 (2010).
- A. Liwo , S. Odziej , C. Czaplewski , D.S. Kleinerman , P. Blood , and H.A. Scheraga , J. Chem. Theory Comput. 6 , 890 (2010).
- R.D. Hills , L. Lu , and G.A. Voth , PLoS Comput. Biol. 6 , 1 (2010).
- G.R. Bowman , V.A. Voelz , and V.S. Pande , Curr. Opin. Struct. Biol. 21 , 4 (2011).
- H. Krobath , S.G. Estácio , P.F.N. Faísca , and E.I. Shakhnovich , J. Mol. Biol. 422 , 705 (2012).
- S.G. Estácio , C.S. Fernandes , H. Krobath , P.F.N. Faísca , and E.I. Shakhnovich , J. Chem. Phys. 137 , 085102 (2012).
- M.M. Lin and A.H. Zewail , Annalen der Physik 524 , 379 (2012).
- W.G. Noid , J. Chem. Phys. 139 , 090901 (2013).
- J.T. Macdonald , L.A. Kelley , and P.S. Freemont , PLoS ONE 8 , e65770 (2013).
- B.I. Dahiyat and S.L. Mayo , Proc. Natl. Acad. Sci. USA 94 , 10172 (1997).
- J.R. Desjarlais and T.M. Handel , Protein Sci. 4 , 2006 (1995).
- J.R. Desjarlais and T.M. Handel , J. Mol. Biol. 290 , 305 (1999).
- H.W. Hellinga and F.M. Richards , J. Mol. Biol. 222 , 763 (1991).
- R.A. Distasio , O.A. von Lilienfeld , and A. Tkatchenko , Proc. Natl. Acad. Sci. USA 109 , 14791 (2012).
- D. Rothlisberger , O. Khersonsky , A.M. Wollacott , L. Jiang , J. Dechancie , J. Betker , J.L. Gallaher , E.A. Althoff , A. Zanghellini , O. Dym , S. Albeck , K.N. Houk , D.S. Tawfik , and D. Baker , Nature 453 , 190 (2008).
- B.I. Dahiyat , Science 278 , 82 (1997).
- B. Kuhlman , G. Dantas , G.C. Ireton , G. Varani , B.L. Stoddard , and D. Baker , Science 302 , 1364 (2003).
- E.H. Kellogg , O.F. Lange , and D. Baker , J. Phys. Chem. B 116 , 11405 (2012).
- I. Coluzza , PLoS ONE 6 , e20853 (2011).
- I. Coluzza , PLoS ONE 9 , e112852 (2014).
- T.E. Creighton , Proteins: Structures and Molecular Properties (W.H. Freeman, New York, 1993), ISBN 071677030X.
- A. Irbäck , F. Sjunnesson , and S. Wallin , Proc. Natl. Acad. Sci. USA 97 , 13614 (2000).
- J.S. Richardson and D.C. Richardson , in Prediction of Protein Structure and the Principles of Protein Conformation edited by G.D. Fasman (Springer, New York, 1989).
- J. Tsai , R. Bonneau , A.V. Morozov , B. Kuhlman , C.A. Rohl , and D. Baker , Proteins 53 , 76 (2003).
- L.N. Kinch , S. Shi , H. Cheng , Q. Cong , J. Pei , V. Mariani , T. Schwede , and N.V. Grishin , Proteins 79 Suppl 1 , 21 (2011).
- E.I. Shakhnovich and A.M. Gutin , Protein Eng. 6 , 793 (1993).
- J.M. Deutsch and T. Kurosky , Phys. Rev. Lett. 76 , 10 (1995).
- F. Seno , A. Trovato , J. Banavar , and A. Maritan , Phys. Rev. Lett. 100 , 1 (2008).
- D. Frenkel and B. Smit , Understand Molecular Simulations (Academic Press, London/San Diego, 2002).
- I. Coluzza and D. Frenkel , ChemPhysChem 6 , 1779 (2005).