
ABSTRACT
Hierarchical self-assembly underpins much of the diversity of form and function seen in soft systems, yet the pathways by which they achieve their final form are not always straightforward – intermediate steps, kinetic effects and finite sizes of aggregates all influence the self-assembly pathways of these systems. In this paper, we use molecular dynamics simulations of binary mixtures of spheres and ellipsoidal discs to investigate the self-assembly of anisotropic aggregates with internal structures. Through this, the full aggregation pathways of spontaneously chiral, multi-bilayer and multi-layer assemblies have been tracked and characterised via a semi-qualitative analysis. This includes the unambiguous identification of first-, second- and third-generation hierarchical assemblies within a single simulation. Given the significant challenge of tracking full aggregation pathways in experimental systems, our findings strongly support the notion that molecular simulation has much to contribute to improving our understanding of hierarchical self-assembling systems.
GRAPHICAL ABSTRACT
1. Introduction
Many of the self-assembled objects found in nature, particularly those in soft matter and biological systems, comprise hierarchical, inhomogeneous or anisotropic embedded structures. Cells, membranes, fibrils and vesicles can, indeed, be viewed as interacting multi-component entities. It is their embedded structure, achieved through the combined actions of various constituents, that imbues such systems with their mechanical and dynamic properties. In so doing, these multi-component entities take advantage of a range of inhomogeneities and anisotropies that are inaccessible to their single-component kin. Thus, from myelin sheaths wreathing nerve cell axons, to actin cyto-skeletons transporting proteins, to hydrophobic membranes and their aquaporin water channels, required system-wide properties are achieved via the co-operative interplay of multiple structural contributions. Due to their prevalence and utility, soft materials with embedded structure raise numerous questions: how does self-assembly on the molecular scale lead to the emergence of embedded structures on the nano or micro scale; once initiated, how does a substructure stop growing once it has achieved its optimal size and can we learn how to design combinations of molecular interactions and internal structures to create objects with novel mechanical properties ?
From the perspective of a molecular physicist, a key route to capturing and, so, exploiting such behaviours is frustration. This can result either when two components of the energy are mutually exclusive or when there is incompatibility between local interactions and larger scale geometric constraints [Citation1]. As a consequence, the combined effects of, e.g. small packing incommensurabilities and the differential scaling of embedded structures within a complex continuum, can lead to behaviours such as anisotropic growth, dimensional constraint or discontinuous changes in gross structure. For example, Grason has argued, using a continuum description of assemblies of intrinsically chiral threads, that the strong radial dependence of elastic stress in twisted fibres leads to the finite-radius fibre being a distinct state of matter [Citation2].
A further significant issue in such systems is the importance of kinetic effects in their aggregation processes. These are characterised by lag phases, hierarchical self-assembly (including crucial, but temporary, intermediates), anisotropic growth and the absence of biphasic behaviour [Citation3,Citation4]. Due to this broad range of complicating factors, classical nucleation theory can provide a very poor description of these systems: they are not controlled by a simple balance between bulk and surface free energy terms.
A very well-characterised class of aggregates which have embedded structures are the amyloids. These develop through the self-assembly of proteins and peptides, leading to aggregates such as extended fibres, tubules and plaques [Citation5]. The structural hierarchies of amyloids are founded on regularly spaced antiparallel molecular strands which stack into two-dimensional β-sheets. Multi-sheet structures then develop into extended protofilaments (typically, bundles of twisted β-sheets) which can aggregate even further into, e.g. multi-filament fibres [Citation6,Citation7]. The chirality seen at various levels of this aggregation, such as in the twisting of β-sheet ribbons or the inter-twining of filaments, is commonly taken to be be intrinsic (i.e. to have molecular origin) [Citation8] and then to re-present at larger length-scales. While amyloids are notoriously stable against modest changes in conditions, they can be disassembled to their constituent molecules through sonication [Citation9]. This confirms the absence of permanent chemical bonding; despite their structural complexities, amyloid aggregates are stabilised by a balance of contributions from hydrogen bonding, the hydrophobic effect, aromatic and electrostatic interactions [Citation10]. After sonication, re-aggregation (i.e. self-healing) is observable on time-scales ranging from minutes to several hours [Citation9].
Twisted, multi-sheet fibres are, however, far from limited to protein and peptide amyloids. The helical nanofilament (or B4) phase, for example, is exhibited when certain achiral, bent-core mesogens form homochiral domains on cooling [Citation11]. Here, the molecules adopt a handedness (left or right, with equal probability) as they straddle adjacent layers, and act co-operatively to achieve a consistent, supramolecular twist within each nanofilament. The incompatibility of this emergent chirality and conventional smectic structures then leads to formation of a lattice of frustration-controlled, chiral multi-sheet bundles [Citation12]. Alternatively, metal nano-helices and -tubules have been observed through supramolecular self-assembly of metal-cholates [Citation13], and twisted nano-ribbons of multi-layer, semiconductor nano-particles have been achieved via illumination of self-assembled tapes [Citation14]. In the latter system, the size and symmetry of the assembling objects dictate that depletion interactions and higher electrostatic moments likely play significant roles.
While twisted, multi-sheet assemblies are known to arise across this wide range of systems, and be driven by a diversity of non-bonded interactions, details of their growth mechanisms are less clear. Characterisation of amyloids, for example, is largely based on electron and atomic force microscopy of well-established aggregates [Citation9], but their early stage intermediate structures are both too small and too short-lived to be identified by these techniques. Indeed, full molecule-to-aggregate tracking of these fascinating processes is a huge experimental challenge. In this context, here we explore the use of particle-based computer simulation to investigate such behaviours.
For this, we utilise classical molecular dynamics (MD) simulation, rather than any time-scale-accelerating methods, so that the processes encountered are not biased by any assumptions regarding the underlying reaction coordinates. Further, we limit ourselves to generic inter-particle interactions, exploiting the computational efficiency of coarse-graining to access the extended simulation time-scales (tens of millions of MD time-steps) needed to reach steady state. By adopting this approach, and starting from an isotopic state with random translational and rotational distributions, our particle-based simulations are, indeed, able to achieve aggregation of structures which are large enough to be governed by continuum effects, rather than being dominated by the microscopics of molecular packing. Thus, we are able to investigate effects that are inaccessible to both the atomistic simulation [Citation15,Citation16] and experimental [Citation6,Citation9] methods commonly used to study such systems.
The remainder of this paper is organised as follows. In the next section, we describe the coarse-grained molecular model used here – two component systems of spheres and discs based, respectively, on the Lennard-Jones and Gay-Berne interaction potentials. Specifically, we demonstrate how the discotic particles are parameterised such that they have a tendency to stack and form threads while also wanting to micro-phase separate with the spherical particles. We then go on to describe two classes of simulations in which the final formed assemblies are twisted multi-layers with additional embedded thread-like structures. The first of these achieves multi-bilayer (ABA-ABA-ABA) arrangements, whereas the second leads to multi-layers (ABABABA). In addition to presenting these final structures, we describe their full aggregation pathways and, thus, identify the hierarchies of self-assembly involved. Finally, we compare the processes involved in establishing these different structures and draw conclusions.
2. Model and simulation details
In this paper, the self-assembly of multi-sheet aggregates is investigated through MD simulation of spheres and generic, disc-shaped ellipsoidal particles. The interactions between pairs of spheres and pairs of discs are governed by the Lennard-Jones (LJ) and Gay-Berne (GB) potentials, respectively. The GB interaction is a well-established coarse-grained model which generalises the 12-6 form of the LJ interaction to anisotropic particle shapes by incorporating dependence on the particle symmetry axes and the inter-particle vector [Citation17–19]. The unshifted form of the GB interaction potential for two discotic particles, , is given by [Citation19]:
(1) Here,
and
are energy and shape functions which are dependent on the orientations and relative displacement unit vector,
, of the particles. The unit vectors
and
describe the orientations of the interacting particles – here, we associate the short symmetry axis of each ellipsoidal particle with its orientational vector. The inter-particle separation and thickness of the discs are
and
, respectively. Conventional reduced units are used throughout [Citation20], the disc diameter,
, being the basic unit of length and the sphere–sphere well-depth (which is also equal to the disc–disc well-depth) being the basic unit of energy. Analytical expressions for
and
are available throughout the literature [Citation17,Citation19], and so are not reproduced here. A cut and shift approach was used to set all interactions to zero beyond some cut-off separation. A variable cut-off radius approach [Citation21] with
was used for the truncation of the disc–disc and disc–sphere interactions, as described in Appendix. A radial cut-off distance of 0.995 disc diameters was employed for the sphere–sphere interactions [Citation20]. The well-depth of the unshifted LJ potential and its zero-repulsion distance were set to be 1 and 0.345 disc diameters, respectively.
The main anisotropies of the GB potential are characterised by two parameters. The first of these is the shape parameter, κ, which is equal to the particle length-to-breadth ratio. The second is the energy parameter, , which is given by the ratio of the potential well-depth at edge–edge configuration to that in face–face orientation. All systems considered here employ particles which are parameterised to be oblate, or disc-shaped, ellipsoids and to have energetic preference to stack face to face. This evokes the
interaction of the aromatic cores of discotic liquid crystals and, more particularly, lyotropics which exhibit chromonic self-assembly [Citation22]. Two other constants, μ and ν, are used in the calculation of the ε function [Citation17], so that the full potential is commonly characterised in terms of four parameters and written as
. In this paper, all systems have κ=0.345,
and
, but a range of energy anisotropies,
are considered. Similarly, the diameter, d, of the spheres was set to 0.345 disc diameters (i.e. the same as the height of the discs).
The GB potential can either be generalised to the case of non-identical ellipsoids or simplified in the limit that one of the particles is spherical [Citation18]. Here, the latter approach has been used to calculate the disc–sphere interactions, the corresponding shape and energy parameter functions, and
, being dependent on the orientation of the disc (
) and the inter-particle unit vector
. In its most basic form, the disc–sphere potential is cylindrically symmetric with respect to the axis of revolution of the disc, that is, there is no preference around the rim of each disc. Real self-assembling systems, however, may have different characteristics, with localised attractions acting between certain moieties of the molecular building-blocks due, e.g. to the presence of polar side groups [Citation23–25]. To incorporate such behaviour here, the energy parameter function of the disc–sphere interactions has been augmented by the introduction of one or more ‘hot-spot’ regions on the rims of the discs by using a disc–sphere interaction of the form
(2) Here, the superscript hs denotes the hot-spot and
indicates the number of hot-spot regions on the rim of the disc. The energy parameter used to describe each hot-spot is:
(3) where
is a unit vector pointing to the core of each hot-spot region from the centre of its disc,
,
,
and
.
and
are the maximum and minimum values for the Tanh energy parameter given by Equation (Equation3
(3) ). The parameter H sets the extent of the hot-spot and is roughly the percentage of the rim of the disc to which spheres are strongly attracted, while l controls the steepness of the crossover between the hot and cool regions. For the
factor of the disc–sphere interaction, the
parameter (the potential well-depth of the edge–sphere configuration) was chosen to be two, slightly smaller than the disc–disc potential well-depth at the edge–edge configuration (2.63). The corresponding size parameter was then determined by following the Gaussian overlap approach [Citation26], so that
. The disc–sphere energy anisotropy parameter was set to
, that is, the spheres were preferentially attracted to the edges of the discs. The
and
parameters of the Tanh potential were set at 5 and 0.2, respectively, that is, the strength of the disc–sphere interaction in the hot-spot zone was five times stronger than its raw value. This led to the parameters a and b being 2.6 and 2.4, respectively. The cross-over parameter l was set to be 0.1.
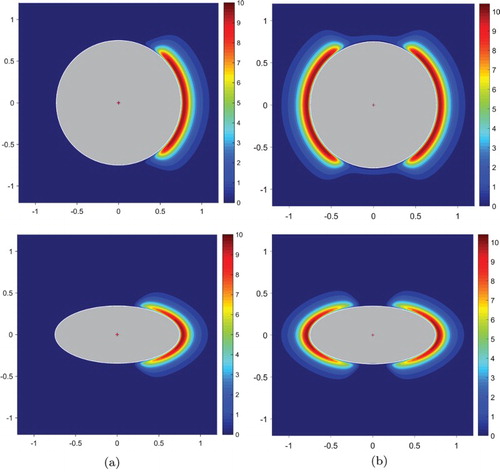
Incorporating hot-spots in the way just described makes the basic discotic building-blocks capable of acting as what we term ‘amphiphilic chromonics’. In this, while retaining the tendency to stack and form threads (as chromonics), they additionally have localised interactions which encourage the microphase-separation and aggregation behaviours associated with amphiphiles. Thus, the disc–sphere systems considered here are able to form a range of assemblies with embedded substructures rather than just the twisted fibres observed in our previous study of aggregating discs [Citation27]. In Section 3.1, we examine systems with a single hot-spot on each disc, whereas in Section 3.2, we investigate the behaviour exhibited by discs with two equal and diametrically opposed hot-spots. Contour plots of these two disc–sphere potentials are shown in Figure .
Figure 1. Contour plots of the disc–sphere interaction potential (absolute value) with (a) one and (b) two hot-spots. In this figure . The upper images show the horizontal symmetry plane (top view) and the lower ones show the vertical symmetry plane (side view). The repulsive region of the potential is shown in grey. (a) H=20, (b)
.
While all of the final structures presented below have clear twist, it is important to note that there are no chiral terms in any of the interactions used in this study. Thus, each observed twist represents a spontaneous symmetry breaking in the finite-sized assembly formed. Left- and right-handed objects have been obtained with equal likelihood on repeat of any particular aggregation simulation.
For each investigated system, the initial configuration was isotropic with random translational and rotational distributions of particles, equilibrated at high temperatures ( 4.5–5). Cooling was then performed to find the highest temperature at which a dominant aggregate formed in the system. The constant-NVT ensemble was employed, by application of the Nosé-Hoover thermostat [Citation28] at a total number density (i.e. the ratio of the number of particles to the volume of the simulation box) of 0.22. The simulations reported here all involved disc and sphere number densities of 0.051 and 0.169, respectively. The numbers of particles used, however, varied between systems and so these are reported below. The equations of particle motion were solved using the NOSQUISH integration algorithm [Citation29]. A time-step of
reduced time units was used for all systems.
3. Results
3.1. Multi-bilayer formation
Here, we report the results of simulations of the aggregation behaviour of single hot-spot discs with d=0.345 spheres. For this, so as to attain aggregates whose behaviours are influenced by continuum elasticity effects, we have performed a small number of extended simulations involving significant numbers of particles.
To this end, we present here semi-qualitative descriptions of three aggregation runs, performed with parameter choices and H:
and H=20;
and H=20 ; and
and H=25. In the first system, 3000 discs and 10,000 spheres were simulated, while the second and third utilised 6000 discs and 20,000 spheres. At high temperatures, all systems were characterised by a dynamic equilibrium involving monomers and multiple small clusters of discs and spheres. Each of these clusters typically involved short threads of discs embedded in a highly mobile blob of spheres. On gradual cooling, for each choice of disc–disc energy anisotropy parameter,
, and hot-spot size, H, such systems consistently achieved large-scale aggregation at a reproducible temperature. Each of these long time-line simulations to steady state consumed several cpu-months, using in-house parallel MD codes on run a multi-core cluster.
For and H=20, a dominant aggregate was observed on cooling to a temperature ofT=2.77. In the early stages of this run, small clusters of spheres and short disc threads were formed, consistent with the steady state behaviour seen at higher temperatures. Figure (a) gives a snapshot of such a cluster. This shows most of the disc hot-spots to be directed towards the spheres, suggesting that the disc–sphere hot-spot interaction had significance even in this level of aggregate. In characterising such clusters, it is informative to follow the nematic orientational order parameter (
) of their constituent discs. This ranges from zero for complete disorder to one for perfect mutual alignment of all discs [Citation30]. For these small clusters, the orientational order parameter fluctuated greatly, confirming that the orientations of the different threads in each cluster were highly mobile. In some cases, the clusters adopted the structure shown in Figure (b), with threads arranged in two orthogonal leaflets and separated by a layer of spheres.
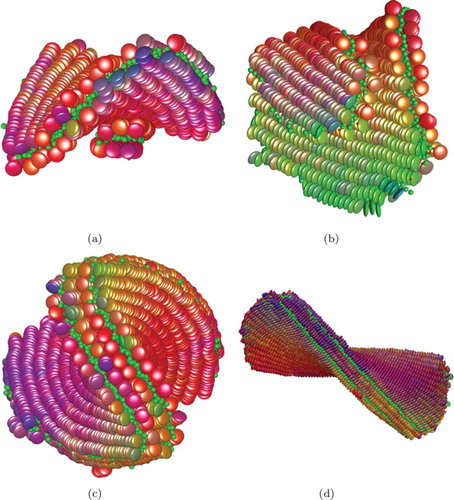
Figure 2. Snapshots of the biggest cluster formed in the system with and H=20 at different numbers of MD steps (written below each figure, with M denoting million). Discs are coloured based on their orientations and spheres are coloured green. Small red spheres indicate the locations of the core of the hot-spot region for each disc, and are used to guide the eye. (a) 3.8 M, (b) 4 M, (c) 6 M, (d) 6.5 M, (e) 8 M, (f) 40 M. (Colour online, B&W in print).
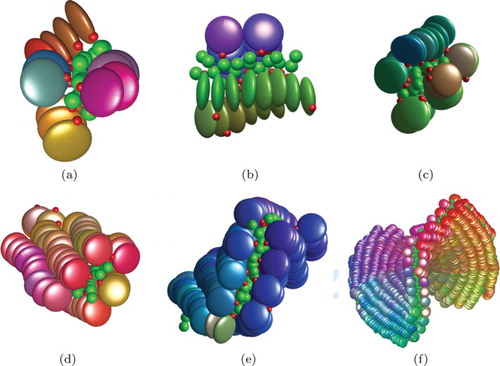
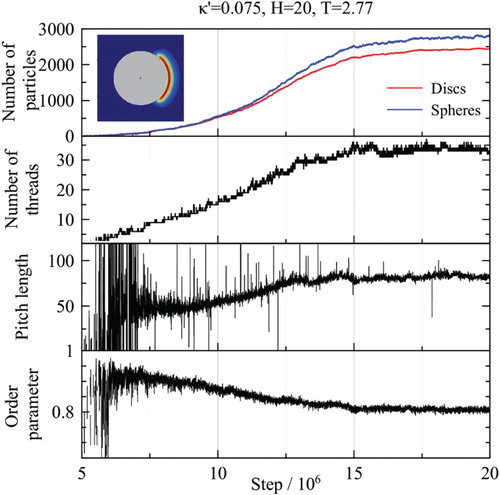
After about 5.5 million MD steps, one of these small clusters grew to the extent that it became a permanent assembly, i.e. it remained identifiable for the remainder of the run. The subsequent behaviour of this developing aggregate is characterised by the property time-lines shown in Figure and the corresponding snapshots of Figure (c)–(f). These show that, as the aggregate acquired increasing numbers of particles (of both types), the initially highly fluctuating orientational order parameter stabilised at a high value of 0.9. At this stage, this aggregate was a bilayer involving two leaflets of nearly parallel threads of discs, sandwiching a thin layer of spheres. Over the following 10M MD time-steps, further steady aggregation, both longitudinal and lateral, resulted in this bilayer growing to comprise over 30 threads of up to 80 discs each. This growth in size was associated with a gradual decrease in orientational order parameter, due to the development of a coherent twist along the developing bilayer ribbon. The chiral pitch of this twist, determined by fitting each disc thread to a helix based on the system director [Citation27], was initially 50 disc diameters but slowly increased to a steady state value of approximately 80 by the end of the growth phase.
Figure 3. Time-lines of different structural observables measured for the largest instantaneous cluster in the system with and H=20 at temperature T=2.77. The disc–sphere potential for this system is shown as an inset.
This chiral pitch, and the corresponding spontaneous helicity of the threads in the bounding leaflets, are clearly apparent from the final snapshot in Figure (f). The emergence of this pitch, despite the absence of any chiral interactions in this simulated system, will be discussed at length in a future publication that systematically relates object-scale twist to particle-scale parameters; here we concentrate on the mechanisms by which multiple sheet-like assemblies form in these systems. Therefore, we simply note that the emergence of twist in these systems is driven by the associated increase in the number of strong interactions between spheres and disc hot-spots. For flat, planar bilayers, the ratio of number of spheres and discs in an aggregate is typically 1.0, whereas for twisted structures, this ratio grows to 1.15–1.25, depending on interaction details. This growth of the sphere/disc ratio is associated with a number of structural modifications (on a range of length-scales), the most obvious of which is the supramolecular twist. At a continuum level, the onset of aggregate-scale twist can be understood from the observation that the two leaflets are slightly askew, their thread axes being rotated by 10–20 degrees about the leaflet normal. Since each leaflet has two very different curvature elasticities (parallel and perpendicular to its threads) these systems can be understood as exploiting the well-known mechanism by which mis-aligned, thread-containing sheets promote negative gaussian curvature [Citation31]. Furthermore, we note that the lengthening of the observed pitch with increase in the width of the twisted bilayer is compatible with notions of associated increases in elastic stress [Citation1]– the overall structure untwists to compensate for the larger bend deformations required of the outer threads.
In corresponding simulations performed with and H=20, no large-scale self-assembly was seen for T=2.57 after 30 M time-steps, whereas a dominant aggregate readily formed at a temperature of T=2.56. A lower aggregation temperature was expected for this system, since increasing
decreases the face–face interaction strength between the discs and, so reduces the tendency to form clusters. Time-lines of key observables for this process are shown in Figure . Again, these are characterised by monotonically growing particle numbers, slow decay in orientational order parameter and gradual increase in the emergent pitch. Unlike Figure , small jumps and gradient changes can be seen in both number of particles curves at 14.7 M time-steps. This signifies an attachment event in which a second small bilayer cluster, containing about 60 discs, became coupled face to face with the existing aggregate – see Figure (a). Once this attachment event had taken place, growth of the parent bilayer slowed markedly, whereas the child bilayer underwent rapid growth. This can be clearly seen from the inset of Figure which shows a time-line of the number of particles in the two outermost leaflets of the now double-bilayer – one a leaflet of the parent bilayer and the other a leaflet of the child. Thus, over a period of 5 M time-steps, the parent's leaflet only grew from 440 discs to 500, whereas the child's grew from 30 to 450. Once both bilayers had reached near parity in size, however, they then grew together. Due to the templating involved in the development of the child bilayer (Figure (b)), the threads in the two adjacent disc leaflets were locally parallel and well interdigitated.
Figure 4. Time-lines of structural observables measured for the growing double-bilayer structure formed in a system with and H=20. The top inset window shows the number of particles in the outermost disc leaflets of the double-bilayer in the period after the parent and child bilayers became coupled. The horizontal axis of this window indicates the MD time-step in millions. The disc–sphere potential for this system is shown as a further inset.
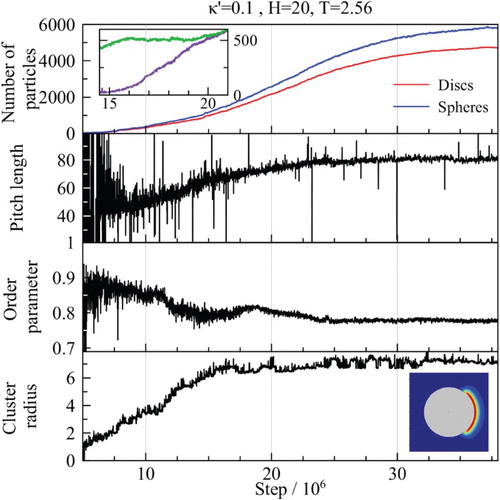
Figure 5. Snapshots of the system with and H=20 forming a double-bilayer by coalescence of two bilayers. (a) Attachment of the child bilayer to the parent at 14.7 M time-steps. (b) The child bilayer growing on top of the parent. (c) and (d) The final formed double-bilayer from two orthogonal views. (a) 14.7 M, (b) 17 M, (c) 38.3 M, (d) 38.3 M
After about 20 M time-steps, a twisted double-bilayer was achieved, with no distinction between its two bilayers. While the width of the resultant twisted ribbon structure saturated at about 16 M time-steps, its length (and total particle numbers) continued to grow for more than double that time. This represents a much greater separation of the saturation points for assembly width and length than that observed for the single bilayer aggregate (recall Figure ). Figure (c,d) shows the fully self-assembled double-bilayer after 38.3 million MD steps. This confirms the final aggregate to be a smoothly twisted ribbon whose threads are straight in the central region but exhibit increasing twist and bend towards the outer limbs. Since all threads in this structure are identical, it is informative to view them as Hookean springs, all with the same stretch, twist and bend elastic constants. From this perspective, it is clear that any further threads adding to the width of this twisted ribbon would be subject to considerable elastic stress.
It is also worthwhile to reflect on the just-described process as an example of hierarchical self-assembly. For this structure, the zeroeth-generation building-blocks are the spheres and the disc particles. Disc threads are first-generation assemblies and bilayers (comprising leaflets of discs sandwiching a layer of spheres) are second generation. The twisted double-bilayer observed here is, therefore, a third-generation hierarchical assembly – it developed through the coupling of two second-generation objects (two initially independent bilayers). It is also interesting that, in order to achieve the highly ordered final structure, the system was required to go through a highly asymmetric intermediate state. Remarkably, when it was in this state, growth of the parent bilayer spontaneously paused while it provided a template for a substantive growth stage of the child. There is no remnant of this intermediate asymmetric state in the final structure.
Finally, in this section, we briefly consider the aggregation behaviour of a system with even weaker face–face interaction between its discs (), but a slightly larger hot-spot size,
. At a temperature of T=2.43, this system formed several clusters, two of which persisted as long-lived objects. These two assemblies were both twisted multi-bilayer ribbons, one comprising four leaflets and the other six (Figure ). As with the
system just described, the growth mechanism of these twisted multi-bilayer objects involved coupling of small bilayer clusters onto the faces of existing and much larger twisted structures. Again, the final third-generation assemblies showed no remnant of the size-disparities that had existed between their contributing bilayers during the growth process – in steady state, all bilayers were equivalent and it was not possible to distinguish between parent and child (or first child and second child).
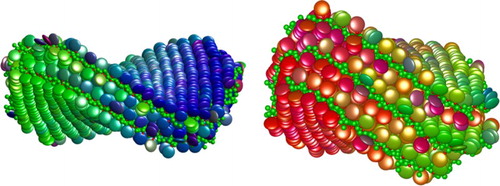
Figure 6. Two twisted multi-bilayer structures formed in a single system with and H=25.
While all of the aggregation temperatures reported in this subsection were consistently observed if simulations were re-run from an alternative starting configuration, the high computational cost of these long aggregation runs means it is not possible, given current computational resource, to provide statistically significant data on the reproducibility of all of the structures described. For the first system considered, which led to a single, twisted bilayer, the form of the final aggregate has proven to be fully reproducible on repeat simulation. However, since the formation mechanism for third-generation aggregates (double- and triple-bilayers) for the second and third systems is contingent on the timely development and adhesion of second-generation objects with inherently small populations, their complete aggregation was not always observed on repeat runs. Thus, on conducting repeat runs, we have seen single- and double-bilayer aggregates as the end-points for , H=20 systems, whereas, for
, H=25 systems, double-bilayers have been observed consistently and triple-bilayers occasionally.
3.2. Multi-layer twisted bundle
As shown in the previous subsection, on cooling from an isotropic fluid mixture, disc–sphere systems utilising the single hot-spot variant of the model shown in Figure (a) form twisted, single or multiple bilayer ribbons. We now, therefore, consider the equivalent behaviour of the double hot-spot version of the potential. Given what was observed with single hot-spots, the primary aim of this was to determine whether the double hot-spot model could achieve an aggregate with coherent chirality and, if so, what its overall structure and growth modes were. To this end, we present the observed behaviour of a mixture of 6000 discs and 20,000 spheres, again with total number density of 0.22. Recalling Equation (Equation2(2) ) for the interaction potential, the double hot-spot model was implemented with two equal, and diametrically opposed, hot-spots on the rim of each disc (
). All simulation input parameters were identical to those used in the previous subsection, the face–face interaction for the disc–disc potential being set at the intermediate value
. The size of the hot-spots was
, as per Figure
On cooling from isotropic, it was found that, at temperature T=3.00, one of the many small clusters that had formed went on to grow into a dominant aggregate. Figure shows a sequence of snapshots taken of this developing system. Figure shows the corresponding observable time-lines. As the number of particles curves show, this cluster, which was initiated after about 1.5 M MD time-steps, grew monotonically and, eventually comprised over 90% of the discs in the system. Thus, the final aggregate obtained here (over 17,000 particles) was larger and the overall aggregation time (10 M time-steps) significantly shorter than those associated with multi-bilayer systems. Also, being based on a second-generation aggregation process, the structure formed was fully reproducible on repeat running from an alternative starting configuration. Even at its earliest stages, the aggregate formed here was clearly different from the bilayers observed previously. Thus, a lamellar arrangement of inter-layered sheets of spheres and parallel threads was apparent even from the earliest snapshot (Figure (a)). While most of discs in this early cluster had their hot-spots adjacent to the sphere layers, some disorder was apparent in the outermost layers.
Figure 7. Configuration snapshots of the multi-layer twisted bundle formed by a double hot-spot disc–sphere mixture system with at temperature T=3.00. All snapshots are viewed along the director calculated for the disc particles. (a) 1.7 M, (b) 2 M, (c) 2.5 M, (d) 3.5 M, (e) 4 M, (f) 4.6 M, (g) 5.5 M, (h) 6.5 M, (i) 8 M.
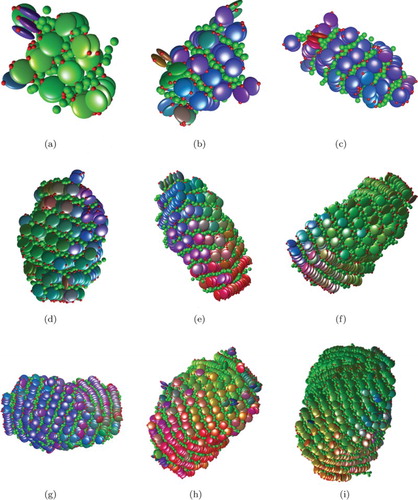
Figure 8. Time-lines of different structural observables measured for the biggest cluster in the double hot-spot disc–sphere mixture system with at temperature T=3.00. A small view of the employed disc–sphere potential was also shown.
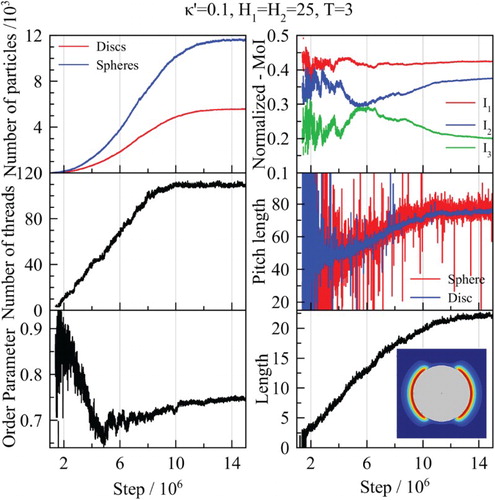
The three distinct growth directions for the assembly of this aggregate were longitudinal (i.e. adding more particles to the thread ends and, so, along the average director of the discs), lateral (i.e. adding more threads to existing layers) and thickness (i.e. adding more layers). Both the configuration snapshots and the moment of inertia data show that, up to 4 M time-steps, aggregate thickness was the strongest growth mode. Thus, of the 14 sphere layers found in the final aggregate, 10 can be seen in the 4M time-step snapshot, even though, by particle number, the assembly process was only 25% complete by this point. Saw-tooth features in the second and third normalised moment of inertia time-lines between 1.5 M and 4 M time-steps correspond, therefore, to the development of additional layers of discs.
This phase of growth, involving relatively rapid addition of layers was, though, also associated with a decrease in the orientational order parameter of the discs in the aggregate (from 0.9 to 0.65). As is apparent from Figure (e), this was due to the threads in successive layers being progressively and coherently twisted with respect to one another. Strikingly, since all of these inter-layer twists had the same handedness, this gave a net chirality to the overall aggregate. In addition to this twisting between thread layers, each layer was itself twisted (i.e. had negative gaussian curvature), in the same way as the bilayer systems described in the previous subsection.
From 4 M time-steps, there was very little further growth by layer addition, but the other two growth modes continued unabated. As a consequence of this progressive thread lengthening and addition of new threads to existing layers, the gross shape of the aggregate fundamentally changed: as is apparent from the eigen-value exchange between the second and third moments of inertia at 4.9 M time-steps, bundle length (rather than thickness) became the primary dimension. The arrest of layer addition, and subsequent development of bundle length and width also enabled the orientational order parameter to recover some of its earlier losses. Pitch length measured about the system director, based on fits to both the central sphere layer and all disc threads, monotonically grew throughout the aggregation up to disc diameters. That it did not change significantly at 4.9 M time-steps confirms that the recovery in order parameter from that point was due to change in primary growth mode and not to any gross changes in structural morphology.
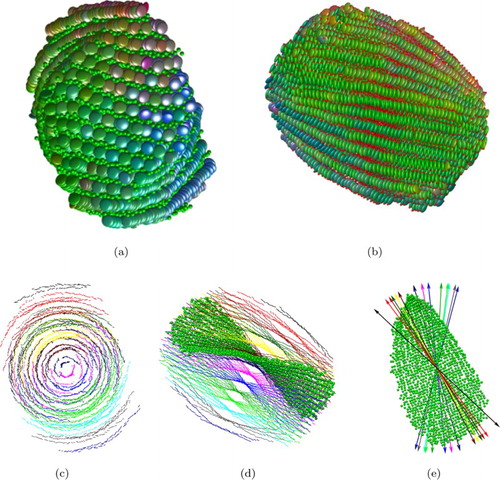
Figure shows a series of snapshots of the final aggregate formed by this system: a remarkable multi-layer, twisted bundle. This comprised 27 well-resolved layers and 110 defect-free threads of discs. The spheres were not static within this structure, however, were found to both diffuse within their layers and exchange with particles from the surrounding bath. From the end view with all particles shown in full, Figure (a), the outermost layers give an initial indication of the overall twist within the structure. Figure (c) shows the same view but uses differently coloured line segments to mark the discs in each layer. This provides direct evidence that, as indicated above, each layer had negative gaussian curvature, that is, both lateral and longitudinal twist. The full resolution (Figure (b)) and simplified (Figure (d)) side views confirm this picture. Finally, Figure (e) provides a plan view of the central twisted layer along with arrows denoting the average directors of all other disc layers. These make it apparent that on traversing the aggregate in a direction perpendicular to the layers (i.e. along the eigenvector associated with the smallest eigenvalue of the orientational order tensor for all discs in the cluster), a third twist was present. The pitch length of this inter-layer twist was of order 100 disc diameters. For this aggregate, the twist along the main director had a left-handed chirality, while those along the two orthogonal axes were both right handed.
Figure 9. Snapshots of the final multi-layer twisted bundle formed in the system with at the step of 17 millions. In parts c and d the short axes of the discs are shown as short line segments, colour coding being used to indicate the different layers. In part e, the director vector of each disc layer was drawn with the same colour that the associated discs were shown in parts c and d, and the object was viewed perpendicular to these vectors. The same sphere layer was shown in parts d and e.
4. Discussion and conclusions
In this paper, we have investigated the ability of MD simulations of coarse-grained particles to achieve the self-assembly of anisotropic aggregates with internal structures. By employing binary mixtures of spheres and ‘chromonic amphiphilic’ disc-shaped particles, with propensities to both stack and micro-phase separate, a range of multi-sheet assemblies have been obtained. In particular, the full aggregation pathways of spontaneously chiral multi-bilayer and multi-layer assemblies have been tracked and characterised via a semi-qualitative analysis. This has included the unambiguous identification of first-, second- and third-generation hierarchical assemblies within a single simulation.
A rich array of behaviours has been captured, thereby illustrating the delicate interplay between competing effects such as packing, relative interaction strengths, elastic stresses and alternative growth modes. For example, despite the absence of any chiral terms in the interaction potentials used, all of the aggregates formed have adopted twists with pitch lengths of up to 100 disc diameters. These pitch lengths have consistently varied smoothly with aggregate size, thereby indicating that the growing assemblies have accessed continuum-level behaviours. Additionally, the relative growth rates of competing modes have been observed to swap over in a manner consistent with Grason's arguments that size-dependent stresses in twisted objects can lead to dimensional constraint [Citation1]. Thus, twist provides a vital mechanism for arresting growth at some target lengths.
Despite the relative simplicity of the particle models used here, the final formed aggregates possess complex internal structures which could have implications for the continuum limit. Firstly, their emergent supramolecular twists would certainly influence any aggregate–aggregate packing processes, particularly the formation of any higher level assemblies. This relates directly to what is seen in amyloids, such as the spontaneous bundling of homochiral protofilaments into long-lived fibres [Citation6]. Further, such twisted ribbons or bundles could promote phase-scale chirality, such as that seen in dispersions of tobacco mosaic virus, or provide sensitive resonances through which system conditions might be characterised. They might, alternatively, promote kinetic trapping, whereby finite aggregates are unable to develop towards stable continuum-limit structures.
It is also apparent that, unlike the case of a homogeneous crystalline solid, the mechanical properties of the various final assemblies formed here are not straightforwardly related to the underpinning interaction potentials. Rather, the elastic constants of, for example, the multi-layer, twisted bundle formed by the double hot-spot system must be emergent. From this perspective, the simulation approach adopted here provides a unique opportunity to gain insight into how molecular-scale parameters – the main inputs available – might be combined to achieve target material properties.
Finally, for all four of the systems simulated here, vital aspects of the self-assembly routes taken are not at all apparent from the final structures obtained. For the multi-bilayer structures, there is no indication that the asymmetric state involving parent and child bilayers was a short-lived but essential intermediate; for the multi-layer bundle structure, it is not apparent that the initial rapid growth of aggregate thickness was crucial in templating the coherent chirality of the subsequent assembly. As noted in the introduction, it is highly challenging to fully trace aggregation pathways in experimental systems, so our findings strongly support the notion that molecular simulation has much to contribute to improving our understanding of hierarchical self-assembling systems. In particular, it is uniquely able to provide insight into intermediate growth mechanisms and, so, identify mechanisms by which to control key bottlenecks or decision points en route to final structure formation.
Disclosure statement
No potential conflict of interest was reported by the authors.
ORCID
Alireza Dastan http://orcid.org/0000-0002-0967-4672
Elisabetta A. Matsumoto http://orcid.org/0000-0002-1173-5163
Douglas J. Cleaver http://orcid.org/0000-0002-4278-0098
Additional information
Funding
References
- G.M. Grason, J. Chem. Phys. 145 (11), 110901 (2016). doi: 10.1063/1.4962629
- G.M. Grason, Phys. Rev. E 79 (15), 041919 (2009).
- P. Jonkheijm, P. van der Schoot, A.P.H.J. Schenning, and E.W. Meijer, Science 313 (5783), 80 (2006). doi: 10.1126/science.1127884
- P.J. Collings, J.N. Goldstein, E.J. Hamilton, B.R. Mercado, K.J. Nieser, and M.H. Regan, Liq. Cryst. Rev. 3 (1), 1 (2015). doi: 10.1080/21680396.2015.1025305
- R. Riek and D.S. Eisenberg, Nature 539 (1), 227 (2016). doi: 10.1038/nature20416
- I.W. Hamley, Angew. Chemie 46 (1), 8128 (2007). doi: 10.1002/anie.200700861
- K.L. Zapadka, F.J. Becher, A.L. Gomes dos Santos, and S.E. Jackson, Interface. Focus. 7 (1), 20170030 (2017).
- A. Aggeli, I.A. Nyrkova, M. Bell, R. Harding, L. Carrick, T.C.B. McLeish, A.N. Semenov, and N. Boden, Proc. Natl. Acad. Sci. USA 98 (21), 11857 (2001). doi: 10.1073/pnas.191250198
- S. Zhang, Interface. Focus. 7 (1), 20170028 (2017).
- Z.S. Al-Garawi, K.L. Morris, K.E. Marshall, J. Eichler, and L.C. Serpell, Interface. Focus. 7 (1), 20170027 (2017).
- L.E. Hough, H.T. Jung, D. Krüerke, M.S. Heberling, M. Nakata, C.D. Jones, D. Chen, D.R. Link, J. Zasadzinski, and G. Heppke et al., Science 325 (5939), 456 (2009). doi: 10.1126/science.1170027
- E.A. Matsumoto, G.A. Alexander, and R.D. Kamien, Phys. Rev. Lett. 103 (1), 257804 (2010). doi: 10.1103/PhysRevLett.103.017801
- Y. Qiao, Y. Lin, Y. Wang, Z. Yang, J. Liu, J. Zhou, Y. Yan, and J. Huang, Nano. Lett. 9 (12), 4500 (2009). doi: 10.1021/nl9028335
- S. Srivastava, A. Santos, K. Critchley, K.S. Kim, P. Podsiadlo, K. Sun, J. Lee, C. Xu, G.D. Lilly, and S.C. Glotzer et al., Science 327 (5971), 1355 (2010). doi: 10.1126/science.1177218
- D.M. Marini, W. Hwang, D.A. Lauffenburger, S. Zhang, and R.D. Kamm, Nano. Lett. 2 (4), 295 (2002). doi: 10.1021/nl015697g
- P. Zhou, L. Deng, Y. Wang, J.R. Lu, and H. Xu, J. Colloid. Interface. Sci. 464, 219 (2016). doi: 10.1016/j.jcis.2015.11.030
- J.G. Gay and B.J. Berne, J. Chem. Phys. 74 (6), 3316 (1981). doi: 10.1063/1.441483
- D.J. Cleaver, C.M. Care, M.P. Allen, and M.P. Neal, Phys. Rev. E 54 (1), 559 (1996). doi: 10.1103/PhysRevE.54.559
- M.A. Bates and G.R. Luckhurst, J. Chem. Phys. 104 (17), 6696 (1996). doi: 10.1063/1.471387
- M.P. Allen and D.J. Tildesley, Computer simulation of liquids (Oxford University Press, Oxford, 1987).
- A. Dastan, Ph. D. thesis, Sheffield Hallam University, 2017.
- J. Lydon, Curr. Opin. Colloid. Interface. Sci. 3 (5), 458 (1998). doi: 10.1016/S1359-0294(98)80019-8
- J. Reiche, R. Dietel, D. Janietz, H. Lemmetyinen, and L. Brehmer, Thin. Solid. Films. 226 (2), 265 (1993). doi: 10.1016/0040-6090(93)90389-7
- D. Janietz, D. Hofmann, and J. Reiche, Thin. Solid. Films. 244 (1–2), 794 (1994). doi: 10.1016/0040-6090(94)90573-8
- M. Lee, J.W. Kim, S. Peleshanko, K. Larson, Y.S. Yoo, D. Vaknin, S. Markutsya, and V.V. Tsukruk, J. Am. Chem. Soc. 124 (31), 9121 (2002). doi: 10.1021/ja017553+
- F. Barmes, M. Ricci, C. Zannoni, and D.J. Cleaver, Phys. Rev. E 68 (2), 021708 (2003). doi: 10.1103/PhysRevE.68.021708
- A. Dastan, W.J. Frith, and D.J. Cleaver, J. Phys. Chem. B 121 (42), 9920 (2017). doi: 10.1021/acs.jpcb.7b05316
- H. Kamberaj, R.J. Low, and M.P. Neal, J. Chem. Phys. 122 (22), 224114 (2005). doi: 10.1063/1.1906216
- T. Miller Iii, M. Eleftheriou, P. Pattnaik, A. Ndirango, D. Newns, and G. Martyna, J. Chem. Phys. 116 (20), 8649 (2002). doi: 10.1063/1.1473654
- R. Eppenga and D. Frenkel, Mol. Phys. 52 (6), 1303 (1984). doi: 10.1080/00268978400101951
- S. Armon, E. Efrati, R. Kupferman, and E. Sharon, Science 333 (6050), 1726 (2011). doi: 10.1126/science.1203874
Appendix. Variable cut-off
The variable version of conventional cut-off radius [Citation20] was used for orientation-dependent disc–disc and disc–sphere GB potentials in this work. The potentials for different relative orientations tend to zero at different separation lengths [Citation21]. For GB-based interactions, the location at which the potential drops below a certain value for different orientations, has a constant distance from the location of zero repulsion at that orientation. Therefore, the variable cut-off radius for each relative orientation can be calculated by:
(A1) The zero-repulsion separation lengths which are equal to the shape function, σ, in each relative orientation for the disc–disc and disc–sphere interactions are calculated during the force calculation of each pair of particle and, therefore, it does not introduce any computational overhead. Studying the GB potential curves in more detail reveals that, the choice of
results in the potential at
being only
of the potential well-depth at that orientation. However,
was used in this work. Using this variable cut-off radius instead of conventional constant
was found to deliver a good time saving in the simulations.