
ABSTRACT
Alcohol addiction ranks among the leading global causes of preventable death and disabilities in human population. Understanding the sites of ethanol action that mediate its acute and chronic neural and behavioural effects is critical to develop appropriate treatment options for this disorder. The N-methyl-d-asparate (NMDA) receptors are ligand-gated heterotetrameric ion channels, which are known to directly interact with alcohol in a concentration-dependent manner. Yet, the exact molecular mechanisms and conformational dynamics of this interaction are not well understood. Here, we conducted a series of molecular dynamics simulations of the interaction of moderate ethanol concentrations with rat's wild-type GluN1–GluN2B NMDA Receptor under physiological conditions. The simulations suggest that glutamate or glycine alone induce an intermediate conformational state and point towards the transmembrane domain (TMD) as the site of action of ethanol molecules. Ethanol interacts by double hydrogen bonds with Trp635 and Phe638 at the transmembrane M3 helix of GluN2B. Alcohol not only reduces the pore radius of the ion channel within the TMD but also decreases accessibility of glutamate and glycine to the ligand-binding sites by altering the structure of the ligand-binding domain and significantly widening the receptor in that area.
GRAPHICAL ABSTRACT
Introduction
Alcohol intake induces a multi-scale spectrum of spatiotemporal effects, the underlying neurobiology and physiology of which are not yet completely understood. Among a variety of proteins as primary sites of action of ethanol in the central nervous system, the ionotropic glutamatergic N-methyl-d-aspartate (NMDA) receptor represents the most prominent target [Citation1–4]. At concentrations of 5–50 mM that also produce intoxication, ethanol has been shown to inhibit the NMDA-activated ion current in a non-competitive manner [Citation5–10] but also the NMDA-induced calcium influx, long-term potentiation and transmitter release [Citation11–14]. The NMDA receptor is a ligand- and voltage-gated ion channel that is in general an assembly of GluN1, GluN2 (A–D) and GluN3 subunits forming heterodimers with the two-fold symmetry axis running through the entire molecule composed of an amino terminal domain (ATD), a ligand-binding domain (LBD) and a transmembrane domain (TMD). The ion channel activates upon concurrent binding of glycine or d-serine and glutamate at the LBDs of GluN1 and GluN2 subunits, respectively [Citation15] and relief of magnesium blockade of the channel pore by membrane depolarisation. A number of studies have focused on the identification of the molecular locus of alcohol action on NMDA receptors, particularly within the membrane-associated (M) domains of GluN1 and GluN2 subunits. Thereby, substitutions of phenylalanine (F637 and F639) at M3 of GluN1 subunit [Citation16–18] as well as tyrosine T822, methionine M823 and alanine A825 of the GluN2 subunit [Citation19,Citation20] have been shown to influence the sensitivity of NMDA receptor to ethanol. Due to the high conservation level of the M-domains between GluN1 and GluN2 subunits, it is safe to assume that these sites correspond to ethanol sensitive amino acids in the other subunit. Despite the value of these investigations, their search strategies have been hypothesis-driven and site directed as a precise description of the complete structure of NMDA receptor including the M-domains was not available until recently [Citation21,Citation22]. Furthermore, the relationship between the ethanol interaction and the conformational dynamics of the receptor [Citation23,Citation24] is still missing.
Conformational dynamics is a multi-scale process and plays a critical role in the activation, deactivation and open-close activities of ion channels in living cells. In the present in silico study, we utilise molecular dynamics (MD) simulations to analyse the global binding properties of alcohol and conformational dynamics of the NMDA receptor based on the recently identified crystal structure of the intact heterotetrameric GluN1–GluN2B ion channel of rat at 4 Å [Citation21]. While a number of recent studies have investigated the general binding properties of mostly homological models of this receptor [Citation25–28], to our knowledge, this is the first investigation of ethanol-induced effects on a native NMDA receptor; thereby overcoming the intrinsic bias of site directed hypothesis-driven approaches and homology modelling. In total, eight configurations were simulated (100 ns/configuration), which represent all combinatorial ensembles of physiological concentrations of ethanol, glycine and glutamate in a close extracellular environment of the receptor. Here, we report a two-fold mechanism of NMDA inhibition by alcohol through a double hydrogen bond with tryptophan 635 and phenylalanine 638 located at the transmembrane M3 helix of the GluN2B subunit: (1) a widening of the pore radius at LBD and thereby decrease of accessibility of glutamate and glycine to their binding sites and (2) by tightening the TMD.
Methods
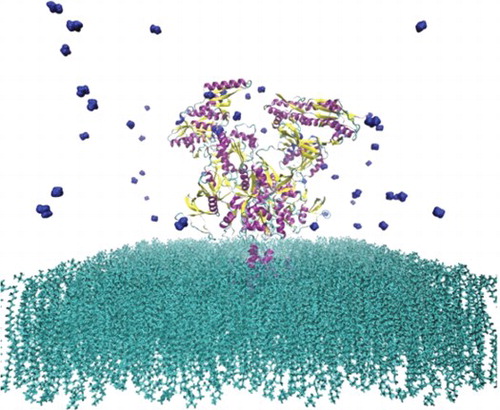
For MD simulations, wild-type crystal structure of GluN1–GluN2B NMDA receptor obtained by X-ray diffraction method was represented by Protein Data Bank ID 4PE5, in the presence of a GluN1 agonist, glycine, a GluN2 agonist, l-glutamate and an ATD-binding allosteric inhibitor, ifenprodil at 4 Å resolution [Citation21]. The ligands were removed from the structure and the ROSETTA refinement program [Citation29] was used to relax the structure, with protonation identical to wild-type. The protein was inserted into a pure 200 × 200 Å2 palmitoyloleoylphosphatidylcholine (POPC) bilayer by deleting the overlapping lipid molecules, keeping 1070 POPC lipids, after which roughly 201,290 TIP3 water molecules were added into the simulation box of the size 7600 nm3. To neutralise the net charge and achieve physiological ion concentrations critical for the ion blockade of the NMDA receptors, 118 Na+ and 50 Mg2+ replaced the water molecules. The system preparation was done using VMD [Citation30] and the Solvate and Ionize plugins. Fifty ethanol molecules were distributed randomly in the extracellular space using Packmol [Citation31], reflecting a concentration of approximately 20 mM. Assuming instantaneous release of glutamate from vesicles and the glutamate concentration in the extracellular space as a function of time t and distance r from release, the glutamate concentration was calculated using the analytical solution of the two-dimensional diffusion equation Hereby, h represents the width of the synaptic cleft (∼20 nm; [Citation32]), Nglu (∼7000; [Citation33]) is the number of glutamate molecules in a vesicle and Dglu (∼75 Å2/ns) is the diffusion coefficient of glutamate. The simulation of the diffusion equation suggests that within the active release zone (r < 2 nm) and after 1 ns, the simulation box will contain approximately 50 glutamate molecules represent a concentration of 160 µM. In order to achieve glycine binding at saturation level, the same number of molecules was distributed randomly in the extracellular space using Packmol. All simulations were performed using NAMD 2.9 [Citation34] with CHARMM27 force field [Citation35], a time-step of 2 fs, periodic boundary conditions and under constant NPT with pressure at 1 atm, temperature at 310 K. The Langevin dynamics and Nose–Hoover Langevin piston methods were used for temperature and pressure coupling, respectively. Particle mesh Ewald electrostatics was used with a 9 Å cutoff for non-bond interactions and neighbour lists updated every 10 steps. The system was energy minimised for 15,000 steps with conjugate gradient. To equilibrate the receptor with the membrane and the solvent, a 10-ns simulation was carried out. Simulation of the receptor in the closed state (without any constraints) was continued for another 100 ns. Thereafter seven independent targeted MD simulations (one ligand: ethanol, glycine and glutamate; two ligands: ethanol and glycine, ethanol and glutamate, and glycine and glutamate; three ligands: glycine, glutamate and ethanol) were carried out, each lasting 100 ns.
Structural analyses
In order to compare the affinities of the glutamate, glycine and ethanol molecules towards the NMDA receptor and identify their sites of action, average distribution densities were computed using the Volmap plug-in of VMD with a resolution of 1 Å, and averaged over the entire simulation period (100 ns) for ligand trajectories. It creates a map of the weighted atomic density at each grid-point. Thereby it replaces all atoms in the selection with normalised Gaussian distributions of width (standard deviation) equal to their atomic radius. The various Gaussians are then additively distributed on a grid. In this study, the weight of ‘none’ was chosen; therefore the Volmap results relate to number densities.
Following the identification of the sites of action of alcohol, the calculation of the diffusion coefficient of ethanol as well as the its interaction energy (Gibbs free energy) with the NMDA amino acids provide measures for the binding affinity with the amino acids. Furthermore, differences in the mobility of the agonists and alcohol may provide an explanation for the temporal framework of ethanol's modulating effects. In order to estimate the average diffusion coefficients, as a dynamical measure of the mobility of alcohol, glutamate and glycine molecules during the simulations, we have utilised the Diffusion Coefficient Tool Plugin for VMD (http://multiscalelab.org/utilities/DiffusionCoefficientTool), which computes the three-dimensional mean squared displacements (MSD)-based diffusion coefficients, based on the Einstein relation as D(τ) = MSD(τ)/6τ. The mean square displacement is defined by To estimate the appropriate lag time τ for obtaining the diffusion coefficients, first the τ-average mean square displacement of ethanol molecules for an interval of 1000 frames (0.1 ns/frame) and step size of 10 frames was calculated as 19,110.01 Å2. Since the diffusion coefficient of ethanol in water is 84 Å2/ns, the appropriate lag time τ assumes 37.9 ns.
For an amino acid AA, the Gibbs free energy was defined statically as the difference of the energy of the unbound Vub and bounded Vb ethanol-AA complexes. The energy was given by the weighted sum of van der Waals, hydrogen bonds, electrostatic and desolvation potentials [Citation36]:
The parameters of this equation were obtained from the CHARMM27 force field. Although the Gibbs free energy
obtained with this strategy does not utilise the dynamical properties of the system, it provides estimations for the ranges of interaction energy between ethanol and NMDA amino acids.
The HOLE program [Citation37] was used to calculate the pore radii along the pore axis for each snapshot as a measure for conformational dynamics of the closed-state and activation simulations (sampled once per 50 ps). Averages over 500 snapshots from the last 5 ns of the closed-state simulation and 1000 snapshots from the last 10 ns of activation simulations were taken as values for the closed, ligand-induced intermediate and open states, respectively. Furthermore, root mean square deviation (RMSD) of backbone amino acids were calculated, presented as heat maps and compared among different conditions to characterise the conformational dynamics at amino acid level. 3Vee [Citation38] were used to calculate pore size (i.e. diameter and accessible volume) for all cases for temporal snapshots at 25, 50, 75 and 100 ns.
Statistical analysis
One-way ANOVA was used for analysis of the raw and normalised data. Whenever significant differences were found, post hoc Student Newman Keul's tests were performed. The chosen level of significance was p < .05.
Results
Diffusion coefficients
The τ-average mean square displacements of glycine and glutamate were 19156.42 and 17033.83 Å2, respectively. Using a lag time of 37.9 ns, the respective average diffusion coefficients were determined as Dgly = 84.2 Å2/ns and Dglu = 74.9 Å2/ns. Glycine and ethanol did not differ effectively in their diffusion properties during the simulation, while the mobility of both molecules was higher to a level of 112% in comparison to glutamate.
Distribution density of alcohol
In agreement with previous investigations [Citation39], the simulations suggest a high distribution density of glutamate and glycine molecules at LBDs of GluN2 and GluN1 subunits, respectively. In particular, glutamate tend towards a close proximity of residues [478; 485] (such as Pro478, Thr480, Arg485), as well as Ser654 and Thr655 at the GluN2B subunit. In contrast, glycine molecules are rather attracted toward the residues located at [516; 523] (such as Pro516, Thr518, Arg523) and Ser688 and Val689 at GluN1 subunit.
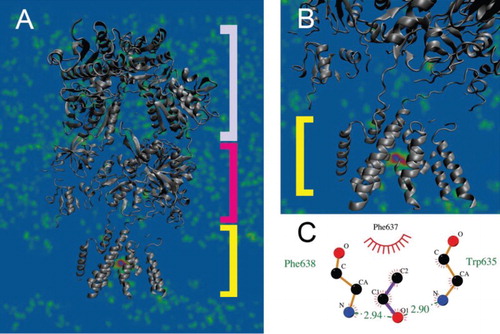
The analysis of the average distribution density of ethanol molecules during the 100 ns simulations suggests that residues that participate in alcohol interaction are located within the TMD (Figure (A)) at M3 positions Trp635 and Phe638 of the GluN2B subunit (Figure (B)), which may interact directly with the second binding site for glutamate molecules. Thereby, the Gibbs free energy calculated as the difference of interaction energies of the unbounded and bounded ethanol-Trp635 and ethanol-Phe638 takes values −2.9 and 2.94 kcal/mol (Figure (C)), respectively.
Figure 1. Average distribution density of ethanol molecules. (A) Ethanol molecules are distributed randomly within the extracellular space with no preference towards ATD (top component) or LBD (middle component), while showing a high affinity to the TMD (bottom component). (B) Within the TMD the highest distribution density is in a close proximity to amino acids M3 helix situated at positions from 630 to 655. (C) Ethanol interacts via a double hydrogen bond with Trp635 (−2.9 kcal/mol) and Phe638 (2.94 kcal/mol).
Conformational dynamics
Since NMDA receptors form ion channels, the analysis of substance-induced alterations in their pore geometry may provide insights on the functioning of the receptors. Using HOLE and 3Vee, we have estimated the changes in pore radius and volume of the receptor during simulation due to the action of the co-agonists as well as ethanol (Figure and Table ). In agreement with experimental studies, the results suggest that single binding of glutamate or glycine induces an intermediate pore size enhancement within the TMDs. While a full transformation of the receptor into an open conformational state cannot be observed in the time-scales of our simulation (see also [Citation25–27]), our simulations demonstrate the affinity of both co-agonists to their known binding sites as well as enhancements in pore volume that are significantly larger than the volume changes induced by a single agonist.
Figure 2. Ligand-induced relative changes of the pore radius of the NMDA receptor averaged over the last 10 ns of simulation. The structure of the relaxed, ligand and Mg2+-free (inhibited or ‘closed’) receptor is considered as the reference for conformational changes of the receptor. Glutamate and glycine induce an intermediate widening of the receptor in the TMD of approximately 210%, while the simultaneous action of both co-agonists increases the TMD radius to 270% in comparison the inhibited state. Ethanol molecules induce a unique widening of the LBD, which may decrease the binding probability of glutamate. The concurrent action of both co-agonists further stabilises the ATD.
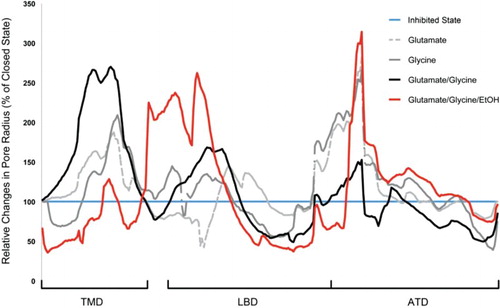
Table 1. Changes in pore volume of NMDA receptor as estimated by 3Vee algorithm.
The findings further suggest a two-fold mechanism of action of alcohol that may explain the inhibition of the receptor activity: (1) alcohol decreases the accessibility of glutamate and probably glycine to their ligand-binding sites by altering the structure of LBD and widening the receptor in this area. In particular, due to the higher mobility of alcohol molecules in comparison to glutamate, ethanol-induced conformational changes at GluN2B may propagate to the nearby ligand-binding site for glutamate and thereby exacerbate the binding process of glutamate to the receptor; (2) alcohol decreases the pore radius in TMD significantly and thereby may reduce the permeability of the receptor for calcium ions.
In addition, the simulations suggest that the concurrent action of both co-agonists may stabilise the ATD (Figure (D)) and consequently improve ion selectivity and permeation through the channel [Citation40]. Since single exposure to ethanol (Figure (A)), glycine (Figure (B)) or glutamate (Figure (C)) does not appear to have a similar effect of the receptor. In fact, the interaction of a single co-agonist or ethanol increases the pore radius at ATD particularly unilateraly at α5′ and α6′ helices and 8′ β-sheet of GluN2B subunit.
Figure 3. All-residue RMSD calculation within the GluN2B segment containing α5′ and α6′ represented as heat maps. In agreement with the results on the ligand-induced pore-radius alterations, ethanol (A) most strongly alters this pore-forming component of the ATD. The co-agonists glycine (B) and glutamate, similarly but less dominantly influence the conformation of this segment throughout the simulation. The concurrent interaction of glutamate and glycine in turn, stabilises the ATD and induces only a temporally limited response, vanishing towards the end of simulation period.
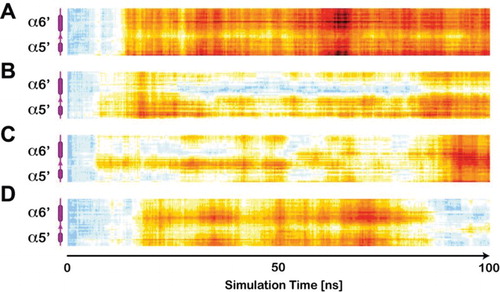
This observation may further support the hypothesis on the involvement of the ATD in optimal channel gating and regulation of agonist potency.
Discussion
In this study, we used, to our knowledge for the first time, MD simulations unbiased by homological modelling to characterise the ethanol-induced conformational dynamics of the crystal structure GluN1–GluN2B NMDA receptor. The results suggest the appropriateness of MD simulations to pursue this question, as they are in agreement with previous experimental studies identifying sites of action of glutamate and glycine at these receptors. Our investigation emphasises the role of phenylalanine 638 in the ethanol-induced inhibition of the NMDA receptor. Furthermore, it suggests the potential involvement of tryptophan 635, which yet requires experimental validation.
The simulations associate the hydrogen bonding of ethanol to the above-mentioned amino acids with complex conformational changes throughout the different domains of the receptor. Firstly, ethanol as well as glutamate and glycine tend to interact with the amino acid terminal and increase the pore radius unilateraly. This effect is only controlled by the presence of both co-agonists. Secondly, ethanol increases the pore radius at the LBD through a propagation of the conformational changes from its binding sites to the binding site of glutamate. We hypothesise that the widening of the receptor in this area may decrease the accessibility of glutamate to the receptor, reduces its binding probability and thereby contributes to the well-known inhibition of NMDA receptor activity. And thirdly, ethanol induces a reduction of the pore radius in the TMD, which leads to a reduction of ion permeability through the channel.
Our findings may improve current understanding of ethanol-induced conformational dynamics of NMDA receptor, which is critical for development of efficient drugs to treat alcohol-related disorders. However, despite the advantages of our approach, it bears natural and intrinsic limitations. The MD simulations are performed at time-scales that may not capture the entire physiologically relevant dynamics, particularly they are blind to dissociation kinetics of ligands. Furthermore, we are unable to simulate the extracellular matrix, as well as active and passive intracellular processes that may influence the receptor function. In addition, the finite and limited size of the simulation box and the application of periodic boundary conditions may lead to unrealistic processes as the large ligands may appear within the intracellular space and interact with the receptor components as well as the membrane without diffusing through the membrane.
Based on these limitations, the simulation results should be considered with special care and experiments such as site directed mutagenesis combined with single-channel recordings or FRET technology [Citation24] are necessary to validate the simulation results on ethanol-induced conformational dynamics.
Acknowledgements
We appreciate the computational resources provided by the compute cluster ‘Elwetritsch’ of the University of Kaiserslautern. H.R.N. and H.M.U. designed the study. HRN conducted the simulations. H.R.N. and C.M. analysed the simulations. H.R.N., C.M. and H.M.U. wrote and reviewed the manuscript.
Disclosure statement
No potential conflict of interest was reported by the authors.
ORCID
Herbert M. Urbassek http://orcid.org/0000-0002-7739-4453
Additional information
Funding
REFERENCES
- Y. Zhao, H. Ren, D.S. Dwyer and R.W. Peoples, Neuropharmacology 97, 240 (2015). doi: 10.1016/j.neuropharm.2015.05.018
- Y. Zhao, H. Ren and R.W. Peoples, Br. J. Pharmacol. 173, 1950 (2016). doi: 10.1111/bph.13487
- C.R. den Hartog, M. Gilstrap, B. Eaton, D.H. Lench, P.J. Mulholland, G.E. Homanics and J.J. Woodward, Front. Neurosci. 11, 84 (2017). doi: 10.3389/fnins.2017.00084
- H. Ren, Y. Zhao, M. Wu, D.S. Dwyer and R.W. Peoples, Neuropharmacology 114, 20 (2017). doi: 10.1016/j.neuropharm.2016.11.013
- D.M. Lovinger, G. White and F.F. Weight, Science 243, 1721 (1989). doi: 10.1126/science.2467382
- R.W. Peoples and F.F. Weight, Brain Res. 571, 342 (1992). doi: 10.1016/0006-8993(92)90674-X
- B. Chu, V. Anantharam and S.N. Treistman, J. Neurochem. 65, 140 (1995). doi: 10.1046/j.1471-4159.1995.65010140.x
- R.W. Peoples, G. White, D.M. Lovinger and F.F. Weight, Br. J. Pharmacol. 122, 1035 (1997). doi: 10.1038/sj.bjp.0701483
- M. Xu, C.T. Smothers and J.J. Woodward, J. Pharmacol. Exp. Ther. 353, 91 (2015). doi: 10.1124/jpet.114.222034
- P.A. Zamudio-Bulcock, G.E. Homanics and J.J. Woodward, Alcohol. Clin. Exp. Res. 42, 698 (2018). doi: 10.1111/acer.13597
- P.L. Hoffman, C.S. Rabe, F. Moses and B. Tabakoff, J. Neurochem. 52, 1937 (1989). doi: 10.1111/j.1471-4159.1989.tb07280.x
- J.E. Dildy and S.W. Leslie, Brain Res. 499, 383 (1989). doi: 10.1016/0006-8993(89)90789-0
- M. Göthert and K. Fink, Naunyn-Schmiedeberg’s Arch. Pharm. 340, 516 (1989). doi: 10.1007/BF00260606
- J. Schummers, S. Bentz and M.D. Browning, Alcohol. Clin. Exp. Res. 21, 404 (1997).
- R.A. Lester, G. Tong and C.E. Jahr, J. Neurosci. 13, 1088 (1993). doi: 10.1523/JNEUROSCI.13-03-01088.1993
- K.M. Ronald, T. Mirshahi and J.J. Woodward, J. Biol. Chem. 276, 44729 (2001). doi: 10.1074/jbc.M102800200
- C.T. Smothers and J.J. Woodward, Alcohol. Clin. Exp. Res. 30, 523 (2006). doi: 10.1111/j.1530-0277.2006.00058.x
- H. Ren, A.K. Salous, J.M. Paul, R.H. Lipsky and R.W. Peoples, Br. J. Pharmacol. 151, 749 (2007). doi: 10.1038/sj.bjp.0707254
- H. Ren, Y. Honse, B.J. Karp, R.H. Lipsky and R.W. Peoples, J. Biol. Chem. 278, 276 (2003). doi: 10.1074/jbc.M209486200
- Y. Honse, H. Ren, R.H. Lipsky and R.W. Peoples, Neuropharmacology 46, 647 (2004). doi: 10.1016/j.neuropharm.2003.11.006
- E. Karakas and H. Furukawa, Science 344, 992 (2014). doi: 10.1126/science.1251915
- C.H. Lee, W. Lü, J.C. Michel, A. Goehring, J. Du, X. Song and E. Gouaux, Nature 511, 191 (2014). doi: 10.1038/nature13548
- D.M. Dolino, D. Cooper, S. Ramaswamy, H. Jaurich, C.F. Landes and V. Jayaraman, J. Biol. Chem. 290, 797 (2015). doi: 10.1074/jbc.M114.605436
- D.K. Sasmal and H.P. Lu, J. Am. Chem. Soc. 136, 12998 (2014). doi: 10.1021/ja506231j
- A.V. Sinitskiy, N.H. Stanley, D.H. Hackos, J.E. Hanson, B.D. Sellers and V.S. Pande, Sci. Rep. 7, 44578 (2017). doi: 10.1038/srep44578
- A.V. Sinitskiy and V.S. Pande, bioRxiv. doi:10.1101/180091 (2017).
- S. Mesbahi-Vasey, L. Veras, M. Yonkunas, J.W. Johnson and M.G. Kurnikova, PLoS One 12, e0177686 (2017). doi: 10.1371/journal.pone.0177686
- X. Pang and H.X. Zhou, J. Struct. Biol. 200, 369 (2017). doi: 10.1016/j.jsb.2017.07.005
- C.A. Rohl, C.E. Strauss, K.M. Misura and D. Baker, Methods Enzymol. 383, 66 (2004). doi: 10.1016/S0076-6879(04)83004-0
- W. Humphrey, A. Dalke and K. Schulten, J. Mol. Graph. 14, 33 (1996). doi: 10.1016/0263-7855(96)00018-5
- L. Martínez, R. Andrade, E.G. Birgin and J.M. Martínez, J. Comput. Chem. 30, 2157 (2009). doi: 10.1002/jcc.21224
- L.P. Savtchenko and D.A. Rusakov, Proc. Natl. Acad. Sci. USA 104, 1823 (2007). doi: 10.1073/pnas.0606636104
- T. Budisantoso, H. Harada, N. Kamasawa, Y. Fukazawa, R. Shigemoto and K. Matsui, J. Physiol. 591, 219 (2013). doi: 10.1113/jphysiol.2012.241398
- J.C. Phillips, R. Braun, W. Wang, J. Gumbart, E. Tajkhorshid, E. Villa, C. Chipot, R.D. Skeel, L. Kalé and K. Schulten, J. Comput. Chem. 26, 1781 (2005). doi: 10.1002/jcc.20289
- A.D. MacKerellJr., N. Banavali and N. Foloppe, Biopolymers 56, 257 (2001). doi: 10.1002/1097-0282(2000)56:4<257::AID-BIP10029>3.0.CO;2-W
- S. Forli and A.J. Olson, J. Med. Chem. 55, 623 (2012). doi: 10.1021/jm2005145
- O.S. Smart, J.G. Neduvelil, X. Wang, B.A. Wallace and M.S. Sansom, J. Mol. Graph. 14, 354 (1996). doi: 10.1016/S0263-7855(97)00009-X
- N.R. Voss and M. Gerstein, Nucleic Acids Res. 38, W555 (2010). doi: 10.1093/nar/gkq395
- C. Chen, M. Hardy, J. Zhang, G.J. LaHoste and N.G. Bazan, Biochem. Biophys. Res. Commun. 340, 435 (2006). doi: 10.1016/j.bbrc.2005.12.021
- K.B. Hansen, H. Furukawa and S.F. Traynelis, Mol. Pharmacol. 78, 535 (2010). doi: 10.1124/mol.110.067157