
 ?Mathematical formulae have been encoded as MathML and are displayed in this HTML version using MathJax in order to improve their display. Uncheck the box to turn MathJax off. This feature requires Javascript. Click on a formula to zoom.
ABSTRACT
Linear porphyrin oligomers have found various applications as synthetic molecular wires in the context of light harvesting, solar energy conversion and molecular electronics. In many of these applications a partial ordering of the molecules helps to improve the reaction efficiency or device performance. In this work we study the orientational properties of the building blocks of such porphyrin-based molecular wires, namely a porphyrin monomer and the corresponding butadiyne-bridged dimer. The porphyrins have been embedded in the nematic liquid crystal solvent 4-cyano-4'-pentylbiphenyl (5CB) and the anisotropic properties of their photogenerated triplet states were characterised by transient electron paramagnetic resonance (EPR) spectroscopy. When aligned in strong magnetic fields, the liquid crystal molecules impose their orientational anisotropy onto the solute guest molecules whose orientation-dependent magnetic properties can then be explored. The line shape analysis of the porphyrin triplet state EPR spectra – highly sensitive to small conformational changes – confirms the orientation of the zero-field-splitting (ZFS) tensors previously determined for these molecules by magnetophotoselection experiments. A biaxial distribution function is shown to be necessary to simulate the experimental EPR data. The biaxial behaviour, in conjunction with symmetry considerations, allows an unambiguous assignment of the three ZFS tensor axes to the molecular axes. From the determined orientational distributions of the porphyrins in 5CB, the biaxial order parameters for both molecules were calculated.
GRAPHICAL ABSTRACT

1. Introduction
Porphyrin building blocks are encountered in many biological systems and play a key role in electron and energy transfer processes in nature [Citation1,Citation2]. Furthermore, they have encouraging properties for applications in the fields of solar light harvesting and molecular electronics [Citation3-9]. In most biological environments and solid state devices for technological applications, such as organic photovoltaics or OLEDs, the molecules are partially ordered. The study of molecular organisation is thus relevant to the investigation of reaction mechanisms and transport properties in chemical and biological systems. Anisotropic environments in biological systems or solid state devices can be mimicked with the help of order-imposing media, such as liquid crystals (LCs), to gain a better understanding of the properties of reactants in ordered environments. Molecular order is known to impact on reactivity [Citation10], for instance electron transfer rates and energy transfer efficiencies.
Photogenerated triplet states are key reaction intermediates in many light-induced processes occurring in solid state devices, like OPVs [Citation11-13], or biological systems (e.g. photosynthesis [Citation14,Citation15]). Here, the triplet states, generated by spin-orbit coupling induced intersystem crossing from the excited singlet state, are employed as probes to study orientation. The molecular triplet state is particularly suited as a probe for conformational anisotropy, structure and dynamics, since the EPR spectrum is highly sensitive to changes in molecular orientation. Specifically, the orientation between the external magnetic field and that of the zero-field splitting (ZFS) interaction tensor determines the spectral shape. Anisotropic effects on the triplet EPR spectra can thus be used to derive magnetic interaction parameters.
Previous EPR studies of the alignment of organic molecules in liquid crystal solvents mainly focussed on energy and electron transfer reactions in covalently linked donor-acceptor assemblies [Citation16-19]. In this context, the main motivation for the use of liquid crystals was to slow down the electron transfer rates in order to be able to study the reactions and their directionality over a wide temperature range spanning more than 100 K, including room temperature [Citation20]. Furthermore, the order and orientational properties of the molecules were revealed. Especially for electron and energy transfer reactions, determining the orientation of the ZFS tensor axes within the molecular frame is important since the mutual ZFS tensor orientation of the donor and acceptor moieties has a direct impact on the reaction efficiencies and deactivation rates [Citation21,Citation22], i.e. the electron transfer rates depend on the conformational distribution of the donor and acceptor molecules (conformational gating) which can be controlled by LCs [Citation23-25].
For a complete assessment of the reciprocal orientation of the ZFS tensor and molecular frames, some information on the preferred direction of alignment of the molecules in the liquid crystal solvent is required. Fortunately, this information can often be obtained from symmetry considerations in conjunction with the requirement of cylindrical symmetry of the mesophase around the LC director [Citation26-28]. In such cases, the location of the ZFS tensor axes within the molecular frame and therefore the sign of the zero-field splitting parameter, D, can directly be inferred from the EPR data of aligned samples.
Although liquid crystal molecules can only be partially ordered, similar information as from single crystal spectra can in principle be obtained when molecules are embedded in liquid crystals. Compared to the use of single crystals, LC solvents have the advantage that even large molecules can easily be studied [Citation19,Citation29], where it may not be possible or extremely difficult to grow single crystals.
In this study, we investigate the building blocks of porphyrin-based molecular wires, namely a porphyrin monomer and the corresponding butadiyne-bridged porphyrin dimer with 3,5-bis(trihexylsilyl)phenyl (THS) side groups, as shown in Figure , by triplet state EPR spectroscopy. The alignment of these molecules will be characterised in the thermotropic nematic LC solvent 4-cyano-4'-pentylbiphenyl (5CB). We will show that a biaxial distribution is necessary to describe the experimental data accurately. The non-equality of the porphyrin in-plane axes in combination with molecular symmetry considerations allows a complete assignment of the ZFS tensor axes to the molecular axes based on the experimental data. The sign of the ZFS parameter D for P1 and P2 is inferred from these measurements and confirms the results previously obtained by magnetophotoselection experiments [Citation30]. Numerical simulations of the triplet spectra yield the conformational distributions of the porphyrins in 5CB and allow the determination of the biaxial order parameters S and ξ.
Figure 1. Chemical structures of the porphyrin monomer and dimer, P1 and P2, the THS porphyrin side groups, and the 5CB liquid crystal molecules. The orientations of the zero-field splitting tensor axes (X, Y, Z) within the molecular frames of P1 and P2 as determined previously in reference [Citation30] are also indicated.
![Figure 1. Chemical structures of the porphyrin monomer and dimer, P1 and P2, the THS porphyrin side groups, and the 5CB liquid crystal molecules. The orientations of the zero-field splitting tensor axes (X, Y, Z) within the molecular frames of P1 and P2 as determined previously in reference [Citation30] are also indicated.](/cms/asset/2ade5bc3-85a9-4b0b-b082-effb54aaffd0/tmph_a_1511868_f0001_b.gif)
2. Liquid crystal order
5CB molecules, as shown in Figure , have a rigid rod-like polarisable core and a flexible aliphatic end group. They belong to the class of thermotropic nematic liquid crystals, characterised by a long-range orientational order. Even if the two ‘ends’ of the liquid crystal molecules are not chemically equivalent, it has been found that nematic liquid crystals behave optically as a uniaxial material with a centre of symmetry [Citation31]. To characterise the alignment of the liquid crystal phase, a vector, called the liquid crystal director , is typically defined, which represents the symmetry axis of the phase. Bulk order can be imposed onto the molecules forming the nematic liquid crystal phase by applying electric or magnetic fields or making use of coated surfaces [Citation32]. The LC director,
, then indicates the average alignment of all LC molecules. 5CB has phase transitions from the crystalline phase to the nematic phase and from the nematic to the isotropic phase at about 22.5
C and 35
C, respectively [Citation33].
The orientation of the individual molecules within the liquid crystal phase, with respect to the LC director, can then be described by the polar angles θ and ϕ and a distribution function can be defined which yields the probability of finding liquid crystal molecules aligned within a small solid angle
around the position (
) [Citation32].
If the system is truly uniaxial (i.e. there is cylindrical symmetry about ), the distribution function
should be independent of ϕ, furthermore:
.
Since nematic liquid crystals have no average dipole, it is appropriate to define a second-rank tensor quantity, , to characterise molecular order. In a uniaxial system, this ordering tensor can be written as follows [Citation31]
(1)
(1) where S is the only surviving order parameter. The ordering matrix
is symmetric, real and traceless. In theory, S can adopt any values from
to 1, although experimentally no examples for negative order parameters, corresponding to a perpendicular alignment of the molecules (i.e. distribution of the molecules centred about
), have been found so far for rod-like uniaxial liquid crystals. If only the liquid crystal molecules are considered, the system can thus be assumed to be uniaxial.
A different situation arises when molecules are dissolved in liquid crystals. Even if the phase itself is uniaxial, pronounced molecular biaxiality may require the introduction of a second order parameter. Whether the molecular ordering is uniaxial or biaxial is dictated by the molecular shape and symmetry [Citation34-37]: Biaxiality is expected for solutes with low symmetry, whereas uniaxial behaviour is typically observed for highly symmetric molecules possessing at least one C symmetry axis with n>3.
In a biaxial system, the ordering tensor becomes [Citation38]
(2)
(2) where the second order parameter, the biaxiality parameter ξ, ranges from
to
. The ordering parameter S can be obtained by averaging over all molecules
(3)
(3) where θ is defined as the angle between the LC director and the symmetry axis (long axis) of an individual molecule. The angled brackets indicate the ensemble average. From the above equation, the limits of S and the implications on the alignment can easily be deduced: If all molecules are aligned along the LC director
,
therefore
and consequently S=1. On the other hand, if all molecules are aligned in the plane perpendicular to the director (but randomly oriented within that plane),
, thus
and averaging yields
.
According to [Citation39], the ordering tensor for a biaxial system can be rewritten as
(4)
(4) which makes it possible to calculate not only S but also the biaxiality parameter ξ from an orientational distribution of the molecular directors.
Experimentally, the order parameter S for a uniaxial system is obtained from an angular distribution, , of the individual molecules by multiplication with (
) and integration over all angles, followed by normalisation [Citation29,Citation40]
(5)
(5) In line with previous EPR studies [Citation29,Citation41], the angular distribution function is assumed to be normally distributed. The Gaussian function used here is parametrised as follows:
(6)
(6) where
and
stand for the centre and the width of the distribution, respectively, and the multiplication by
accounts for spherical averaging.Footnote1
If a biaxial system is considered, the angular distribution function becomes dependent on θ and ϕ and a two-dimensional Gaussian function is employed to characterise the distribution of angles as follows
(7)
(7) where θ still refers to the polar angle and ϕ is the azimuthal angle corresponding to the angle between the projection of the director onto the xy plane of the molecular tensor frame and the positive x axis.
and
denote the centre and the width of the distribution with respect to ϕ.
If the order parameter S is known, the biaxiality parameter ξ can be calculated from the distribution in both angles using Equation (Equation4(4)
(4) ) and is given by
(8)
(8) or, after simplification,
(9)
(9)
In the nematic phase, liquid crystal solvents like 5CB are characterised by an anisotropic electric and magnetic susceptibility, implying also an orientation dependent refractive index and dielectric constant. Depending on the difference between the dielectric properties with respect to the ordinary and extraordinary axes of the liquid crystal, , liquid crystals with negative and positive dielectric anisotropy are distinguished. If
, the liquid crystal aligns parallel to an externally applied electric field, whereas if
, a perpendicular alignment is obtained. Analogous considerations can be applied with respect to the magnetic properties. The electric and magnetic susceptibilities change markedly as a function of temperature, where a lower temperature typically implies more pronounced anisotropic properties [Citation42].
3. Alignment of the liquid crystal samples
The porphyrins P1 and P2, as shown in Figure , were dissolved in 5CB. The liquid crystal imposes its alignment onto the porphyrin molecules, so that the alignment of the molecules is determined by the liquid crystal director alignment. For a characterisation of the alignment, it is assumed that the distribution of molecules about the phase director is normal with a variance of (cf. Equation (Equation6
(6)
(6) )).
For alignment, the liquid crystal samples inside the EPR tubes were warmed up to the isotropic liquid crystal phase while a field of 14 kG was applied using the EPR magnet, and subsequently left to cool down to room temperature in the magnetic field. This procedure was repeated at least three times. The orientation of the liquid crystal director with respect to the external magnetic field, , can be predicted from the sign of the diamagnetic susceptibility
. In 5CB,
[Citation43] and thus the long axis of the molecule aligns parallel to the external magnetic field,
. After establishing alignment of the liquid crystal in the EPR tube, the sample was immediately immersed in liquid nitrogen (while still in the magnetic field) to preserve the orientational order and then inserted into the EPR resonator. All measurements were carried out at 90 K and porphyrin concentrations between 0.1 and 0.2 mM were used.
EPR spectra were taken at two different orientations of the liquid crystal director with respect to the external magnetic field, . These orientations are schematically depicted in Figure . If the sample tube is inserted into the resonator in the same orientation as was adopted during the LC alignment, spectra at parallel orientation (
) are obtained. For the spectra at perpendicular orientation (
), the sample tube is rotated by 90
about its long axis.
Figure 2. Overview of the two different orientations of the liquid crystal director with respect to the external magnetic field as used in the EPR experiments (left) and graphical representation of the definition of the angles θ and ϕ (right).
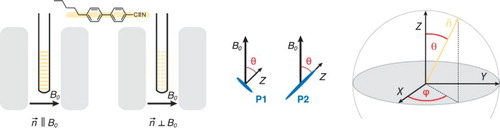
In the following, the ZFS tensor axes will always be indicated with capital letters (i.e. X, Y, Z) and the angle θ, characterising the liquid crystal director orientation, is defined as the angle between the ZFS tensor Z axis and the liquid crystal director orientation () as shown in Figure (centre and right). The latter is identical to the application direction of the magnetic field during alignment.
The orientations of the ZFS tensor axes with respect to the molecular structures of P1 and P2, as determined in reference [Citation30], are depicted for reference in Figure . The Y axis of the ZFS tensor is pointing along the axis of the aryl groups in both cases, whereas the Z axis corresponds to the out-of-plane axis or the long axis of the molecule, respectively, in P1 and P2.
4. Results and discussion
Room temperature UV-vis spectra of P1 and P2 in toluene are shown in Figure . It can be seen that the increased conjugation length in P2 leads to a pronounced shift of the absorption spectrum towards higher wavelengths. Additionally, the relative intensity of the porphyrin Q-bands () compared to the Soret band (
) is significantly increased in P2, indicating that the electronic
transition is less forbidden in P2.
Figure 3. Comparison of the UV-vis spectra of P1 and P2 (M) recorded in toluene at room temperature with those taken in the isotropic phase of 5CB at 50
C.
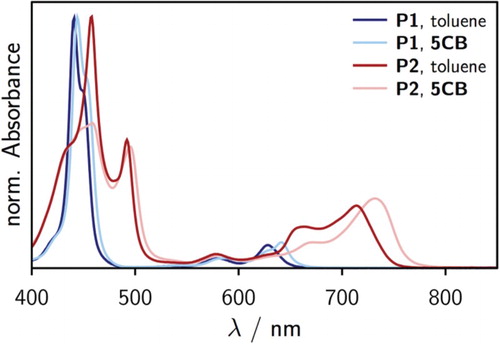
To explore the behaviour in liquid crystal solvents, UV-vis spectra of P1 and P2 were also recorded in the isotropic phase of 5CB. In this case, the UV-vis measurements were performed on a spectrometer equipped with a thermostatted sample holder where the temperature was held constant at 50C. A comparison between the room temperature spectra recorded in toluene and the elevated temperature spectra in 5CB is shown in Figure for the investigated samples.
It can be seen that all spectra are red-shifted in 5CB as compared to toluene. While the red-shift of the porphyrin Soret-band is small, the prominent peaks in the Q-band region are shifted by more than 10 nm. A spectrum of P2 was also recorded in toluene at 50C and compared with the corresponding room temperature spectrum. In this case no significant change of the spectrum with temperature was observed. Due to its apolar nature, the solvent properties of toluene are not expected to change much as a function of temperature. According to literature [Citation44,Citation45] the refractive index of toluene changes from 1.497 at room temperature to 1.485 at 50
C, whereas the static dielectric constant decreases from 2.4 to 2.3. The relevant solvent properties of 5CB at 50
C are considerably different (
,
[Citation43]), which is the likely source of the pronounced red-shift of the Q-band in this solvent.
When comparing the individual spectra recorded in the two solvents, one notices that the spectra of P1 in toluene and 5CB are well comparable, while the spectrum of P2 in 5CB looks considerably different from that in toluene (Figure ). The prominent peak of the porphyrin Soret band of P2 around 450 nm is much reduced in 5CB. This peak was found to correspond to a 90 arrangement of the two adjacent porphyrin units in the dimer [Citation46], thus the absence of this peak is indicative for a predominantly co-planar arrangement of the two porphyrin units of P2 in 5CB.
The co-planar arrangement of the porphyrin planes of P2 in 5CB suggested by the UV-vis experiments was further confirmed by excitation-wavelength dependent EPR measurements. Only minor variations in the shape of the EPR triplet spectrum were observed upon variation of the excitation wavelength, pointing towards a narrow distribution of contributing rotational conformations. The corresponding data are shown in the supplementary information.
4.1. Transient cw EPR
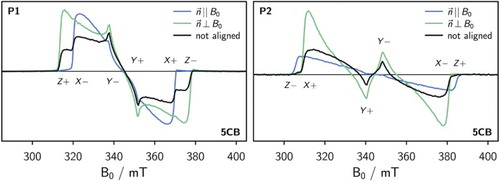
Transient cw EPR measurements at the X-band (9.70 GHz) were first carried out on unaligned and aligned samples of P1 in 5CB at 90 K. The corresponding spectra are shown in Figure (left). They were recorded using direct detection, meaning that absorptive and emissive transitions are indicated by positive and negative signals, respectively. All transient EPR spectra were averaged between 0.7 and 1.5 s after the laser pulse. Pulsed laser excitation was performed at 640 nm using an OPO seeded by the third harmonic of a Nd:YAG laser with a repetition rate of 20 Hz. Unless otherwise stated, 1 mJ of depolarised laser light was used to excite the samples.
Figure 4. Comparison of the transient cw EPR spectra of P1 (left) and P2 (right) in unaligned and aligned 5CB at 90 K recorded after laser excitation (1 mJ, 20 Hz) at 640 nm and 730 nm for P1 and P2, respectively.
The spectra of the porphyrin triplet states in unaligned 5CB were needed for data analysis and simulations as will be explained below. Furthermore, spectra of aligned samples were taken at two different sample orientations, referred to as parallel () and perpendicular (
) orientation, as introduced in Figure . Details on the sample preparation, instrumental parameters and data treatment are given in the supplementary information.
From the figure it can be seen that the X transition prevails for P1 when . Perpendicular sample orientation (
) leads to a strong enhancement of the Z and Y transitions in P1. The observations for P1 are consistent with an alignment of the molecule in 5CB along the axis of the triple bonds (X axis).
Also for P2 transient cw EPR measurements were carried out in 5CB at 90 K. The triplet states were generated by excitation at 730 nm. The spectra obtained for P2 are shown in Figure (right). The Z transition is strongly enhanced when whereas the X and Y transitions dominate at ⊥ sample orientation, in agreement with an alignment of P2 in 5CB along the long axis of the molecule (Z axis).
Considering the uniaxial alignment of nematic LCs (i.e. requirement of cylindrical symmetry of the mesophase around the LC director) and the molecular structure of P1, it can, in principle, be excluded that the porphyrin planes align perpendicular to the LC director axis. The porphyrins are thus expected to be aligned with their molecular planes parallel to the LC director (and the field) [Citation47]. With this extra piece of information it is now possible to relate the molecular axes to the ZFS tensor axes and determine the sign of the zero-field-splitting parameter D for P1 and P2 from the spectra at and ⊥ orientation. The reasoning is as follows: For P1, the ZFS tensor Z orientation (direction of maximum dipolar coupling) is absent in the spectra for
. If alignment perpendicular to the molecular plane of the porphyrin macrocycle can be excluded, this implies that the ZFS tensor Z axis must coincide with the molecular out-of-plane axis and therefore that the spin density distribution needs to be oblate (D>0). The positive sign of D, previously determined by magnetophotoselection experiments [Citation30], can thus be confirmed. In analogy, we can assume that the same holds true for P2 and that the molecule therefore aligns with its long axis along the liquid crystal director axis. Since the Z canonical transitions are dominant in the EPR spectra for
and absent in the spectra for
, it becomes evident that the long axis of the molecule corresponds to the ZFS tensor Z axis, implying D<0 (prolate spin density distribution) in agreement with previous studies [Citation30].
5. Data analysis and simulations
The following procedure was chosen for the analysis of the recorded triplet spectra: At first, the triplet spectra in unaligned 5CB, which were assumed to be isotropic, were simulated for every sample using the MATLAB software package EasySpin [Citation48] in order to determine the triplet state parameters to be used in the simulations of the spectra of the aligned samples. These parameters include the zero-field splitting parameters D and E, the g-factors, and the populations, ,
, and
, of the individual triplet sublevels. Once determined for each molecule in 5CB, the parameters were fixed in all further simulations of the corresponding spectra of the aligned samples.
The results of the simulations in unaligned 5CB for P1 are shown in Figure (left). The simulation parameters are indicated.
Figure 5. Experimental triplet cw EPR spectrum in unaligned 5CB together with the best fit assuming isotropic alignment for P1 (left) and P2 (right). The simulation parameters are indicated in the figure.
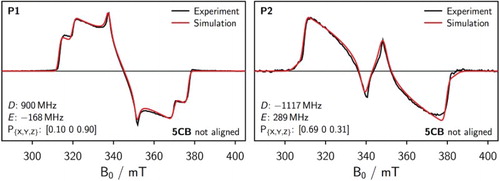
The spectrum of the unaligned sample of P1 looks very similar to a typical triplet spectrum of P1 in frozen toluene [Citation49] and can be simulated with almost the same parameters. In addition, the fit is acceptable, leaving little doubt that the unaligned liquid crystal sample is indeed isotropic for P1.
Also for P2 the triplet spectrum of the sample in unaligned 5CB was simulated assuming an isotropic alignment of the molecules within the liquid crystal solvent. The results including the simulation parameters are shown in Figure (right). The obtained fit is acceptable, so that the simulation parameters are considered a reasonable starting point for any further analysis. Although the UV-vis experiments demonstrated that the distribution of rotational conformers is considerably reduced in 5CB compared to that in an isotropic solvent such as toluene, the distribution of the molecules within the sample is still isotropic with respect to if the liquid crystal is not aligned. Compared to an EPR spectrum taken in an isotropic solvent such as toluene, the co-planarity of the porphyrin planes in P2 should only slightly influence the triplet state populations as was shown in reference [Citation49].
In the next step, the parameters obtained from the simulation of the spectra of the unaligned samples were fixed and used to simulate the spectra for and
and consequently to obtain the distribution of angles contributing to the individual spectra from which the order parameters can be obtained. As mentioned earlier, a Gaussian distribution of angles is assumed, so the only variable parameters in these simulations are the centres and the widths of the employed Gaussian distributions (cf. Equations (Equation6
(6)
(6) ) and (Equation7
(7)
(7) )).
As expected from the (approximate) D point group symmetry of the porphyrin molecules, a biaxial distribution was found to be necessary to reproduce the experimental triplet state EPR spectra in a satisfactory way. For completeness, simulations assuming a uniaxial distribution of the molecules in 5CB are shown in the supplementary information.
5.1. Simulations assuming biaxiality
In addition to the distribution in θ, a distribution in ϕ was thus included in the simulations and a home-written MATLAB fitting routine was implemented which allowed simultaneous fitting of the experimental data for and
. The centres of the distributions were fixed but shifted by 90
between
and ⊥ sample orientation. The width of the distributions,
and
, were allowed to vary independently from each other but were required to be identical for
and
. The best fits to the experimental data together with the parameters used in the simulations are shown for P1 and P2 in Figure .
Figure 6. Simulated spectra assuming a biaxial distribution in comparison with the corresponding experimental spectra for P1 (left) and P2 (right). The parameters yielding the best fit to the experimental data are indicated in the figure.
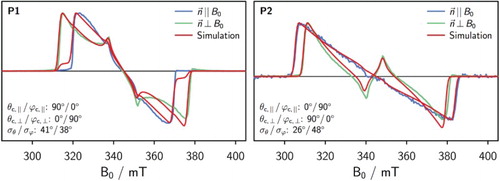
Compared to the case of a uniaxial distribution where the main spectral features could not be reproduced (see supplementary information), the agreement between the simulation and experimental data was considerably improved by including a distribution in ϕ. The fits are certainly not perfect, but given the experimental uncertainty on the spectral shape due to (variably) imperfect LC alignment, the match is considered satisfactory. For P1, the distributions in θ and ϕ are found to be fairly wide with , whereas for P2 a narrower distribution in θ of 26
is found in combination with a relatively wide distribution in ϕ of 48
.
Calculation of the Order Parameters
From the width of the distributions, and
, obtained from the simulations of the experimental data, order parameters were calculated for P1 and P2 according to Equations (Equation5
(5)
(5) ) and (Equation9
(9)
(9) ). An overview of the parameters characterising the distributions which resulted from the simulations and of the obtained order parameters (for the LC alignment corresponding to parallel orientation of the sample tube,
) is given in Table . For P1 the order parameter S is found to be negative, while ξ is positive since
and
, whereas for P2 S is positive and ξ is negative (
,
).Footnote2
Table 1. Overview of the parameters used in the simulations of the spectra of the aligned samples of P1 and P2 in 5CB.
6. Conclusions
The investigated porphyrin molecules were found to align in the nematic phase of the liquid crystal 5CB. The experimental cw EPR spectra for and
are clearly different. When the liquid crystal is not aligned, triplet spectra are obtained which closely resemble the spectra obtained for the same compounds in isotropic frozen solution, indicating an isotropic distribution of orientations. The triplet state parameters obtained from a simulation of such an isotropic liquid crystal spectrum were fixed and used in the simulations of the spectra of the respective aligned samples.
It was found that the experimental spectra of the aligned samples cannot be reproduced in a satisfactory way if only a distribution in the polar angle θ is considered in the simulations. However, assuming a biaxial distribution , resulted in a good agreement between experimental data and simulations. Combining the experimental results with molecular symmetry considerations, a complete assignment of the ZFS axes to the molecular axes was possible and shown to be in agreement with previous results from magnetophotoselection experiments. The ZFS parameter D is positive for P1 and negative for P2. Both porphyrins were found to align predominantly along the axis of their triple bonds, which corresponds to the ZFS tensor X and Z axis, respectively, in P1 and P2.
Biaxial alignment is a necessary requirement for an unambiguous assignment of the (relation between the) magnetic and molecular frames of reference. From a simultaneous fit of the spectra for and ⊥ alignment, the centres and widths of the distributions in θ and ϕ were obtained and the biaxial order parameters S and ξ could be calculated. The knowledge of the order parameters and contributing conformations allows the properties of the different conformers to be disentangled.
Supplementary Material.pdf
Download PDF (322.1 KB)Data availability statement
The data that support the findings of this study are available from the corresponding author, S.R., upon reasonable request.
Disclosure statement
No potential conflict of interest was reported by the authors.
ORCID
Sabine Richert http://orcid.org/0000-0002-2990-974X
Harry L. Anderson http://orcid.org/0000-0002-1801-8132
Martin D. Peeks http://orcid.org/0000-0002-9057-9444
Christiane R. Timmel http://orcid.org/0000-0003-1828-7700
Additional information
Funding
Notes
1. The width can be related to the full width at half maximum (FWHM):
.
2. In some of the magnetic resonance literature, the ordering parameter S is referred to as , whereas ξ is often referred to as D or (
). A compilation of some of the definitions used by different authors is given in reference [Citation38].
Related Research Data
References
- M.R. Wasielewski, Chem. Rev. 92, 435 (1992). doi: 10.1021/cr00011a005
- H. Levanon and K. Möbius, Annu. Rev. Biophys. Biomol. Struct. 26, 495 (1997). doi: 10.1146/annurev.biophys.26.1.495
- H.L. Anderson, Chem. Commun. 23, 2323 (1999). doi: 10.1039/a904209a
- V.S.Y. Lin, S.G. DiMagno and M.J. Therien, Science 264, 1105 (1994). doi: 10.1126/science.8178169
- A. Tsuda and A. Osuka, Science 293, 79 (2001). doi: 10.1126/science.1059552
- M.O. Senge, M. Fazekas, E.G.A. Notaras, W.J. Blau, M. Zawadzka, O.B. Locos and E.M.N. Mhuircheartaigh, Adv. Mater. 19, 2737 (2007). doi: 10.1002/adma.200601850
- M.U. Winters, E. Dahlstedt, H.E. Blades, C.J. Wilson, M.J. Frampton, H.L. Anderson and B. Albinsson, J. Am. Chem. Soc. 129, 4291 (2007). doi: 10.1021/ja067447d
- A.A. Kocherzhenko, K.B. Whaley, G. Sforazzini, H.L. Anderson, M. Wykes, D. Beljonne, F.C. Grozema and L.D.A. Siebbeles, J. Phys. Chem. C 116, 25213 (2012). doi: 10.1021/jp307216q
- S.H. Yoon, S.B. Lee, K.H. Yoo, J. Kim, J.K. Lim, N. Aratani, A. Tsuda, A. Osuka and D. Kim, J. Am. Chem. Soc. 125, 11062 (2003). doi: 10.1021/ja0346429
- V. Ramamurthy, Tetrahedron 42, 5753 (1986). doi: 10.1016/S0040-4020(01)96063-6
- A. Köhler and H. Bässler, J. Mater. Chem. 21, 4003 (2011). doi: 10.1039/C0JM02886J
- W. Chang, D.N. Congreve, E. Hontz, M.E. Bahlke, D.P. McMahon, S. Reineke, T.C. Wu, V. Bulović, T. Van Voorhis and M.A. Baldo, Nat. Commun. 6, 6415 (2015). doi: 10.1038/ncomms7415
- H. Kraus, M.C. Heiber, S. Väth, J. Kern, C. Deibel, A. Sperlich and V. Dyakonov, Sci. Rep. 6, 29158 (2016). doi: 10.1038/srep29158
- H. Levanon and J.R. Norris, Chem. Rev. 78 (3), 185 (1978). doi: 10.1021/cr60313a001
- D.E. Budil and M.C. Thurnauer, Biochem. Biophys. Acta 1057, 1 (1991).
- O. Gonen and H. Levanon, J. Phys. Chem. 84, 4132 (1986). doi: 10.1063/1.450083
- K. Hasharoni, H. Levanon, J. von Gersdorff, H. Kurreck and K. Möbius, J. Chem. Phys. 98, 2916 (1993). doi: 10.1063/1.464119
- H. Levanon, T. Galili, A. Regev, G.P. Wiederrecht, W.A. Svec and M.R. Wasielewski, J. Am. Chem. Soc. 120, 6366 (1998). doi: 10.1021/ja980409c
- M. Di Valentin, A. Bisol, G. Agostini, M. Fuhs, P.A. Liddell, A.L. Moore, T.A. Moore, D. Gust and D. Carbonera, J. Am. Chem. Soc. 126, 17074 (2004). doi: 10.1021/ja046067u
- A. Regev, H. Levanon, T. Murai and J.L. Sessler, J. Chem. Phys. 92, 4718 (1990). doi: 10.1063/1.457689
- E.R. Bittner, V. Lankevich, S. Gélinas, A. Rao, D.A. Ginger and R.H. Friend, Phys. Chem. Chem. Phys. 16, 20321 (2014). doi: 10.1039/C4CP01776E
- M.C. Yoon, S. Cho, P. Kim, T. Hori, N. Aratani, A. Osuka and D. Kim, J. Phys. Chem. B 113, 15074 (2009). doi: 10.1021/jp904729y
- Q. Mi, E.A. Weiss, M.A. Ratner and M.R. Wasielewski, Appl. Magn. Reson. 31, 253 (2007). doi: 10.1007/BF03166260
- L. Sinks, M.J. Fuller, W. Liu, M.J. Ahrens and M.R. Wasielewski, Chem. Phys. 319, 226 (2005). doi: 10.1016/j.chemphys.2005.03.032
- G.P. Wiederrecht, W.A. Svec and M.R. Wasielewski, J. Phys. Chem. B 103, 1386 (1999). doi: 10.1021/jp983907g
- L. Pasimeni, U. Segre, M. Ruzzi, M. Maggini, M. Prato and K. Kordatos, J. Phys. Chem. B 103, 11275 (1999). doi: 10.1021/jp9927000
- M. Bortolus, A. Ferrarini, J. van Tol and A.L. Maniero, J. Phys. Chem. B 110, 3220 (2006). doi: 10.1021/jp056223z
- O. Gonen and H. Levanon, J. Phys. Chem. 89, 1637 (1985). doi: 10.1021/j100255a017
- O. Gonen and H. Levanon, J. Phys. Chem. 88, 4223 (1984). doi: 10.1021/j150663a007
- C.E. Tait, P. Neuhaus, H.L. Anderson and C.R. Timmel, J. Am. Chem. Soc. 137, 6670 (2015). doi: 10.1021/jacs.5b03249
- M.J. Stephen and J.P. Straley, Rev. Mod. Phys. 46, 617 (1974). doi: 10.1103/RevModPhys.46.617
- P.G. De Gennes and J. Prost, editors, The Physics of Liquid Crystals (Oxford University Press, Oxford, 1993.
- B.R. Ratna and R. Shashidhar, Pramana 6, 278 (1976). doi: 10.1007/BF02872205
- G.R. Luckhurst, T.J. Sluckin, Biaxial Nematic Liquid Crystals: Theory, Simulation, and Experiment (John Wiley & Sons, Ltd., Chichester, 2015).
- E.E. Burnell and C.A. de Lange, Chem. Rev. 98, 2359 (1998). doi: 10.1021/cr941159v
- A.J. Van der Est, M.Y. Kok and E.E. Burnell, Mol. Phys. 60, 397 (1987). doi: 10.1080/00268978700100271
- A. Ferrarini, G.J. Moro, P.L. Nordio and G.R. Luckhurst, Mol. Phys. 77, 1 (1992). doi: 10.1080/00268979200102271
- R. Rosso, Liq. Cryst. 34, 737 (2007). doi: 10.1080/02678290701284303
- R.J. Low, Eur. J. Phys. 23, 111 (2002). doi: 10.1088/0143-0807/23/2/303
- A. Saupe, Angew. Chem. Int. Ed. 7, 97 (1968). doi: 10.1002/anie.196800971
- H. Levanon, Rev. Chem. Intermed. 8, 287 (1987). doi: 10.1007/BF03156157
- M. Magnuson, B.M. Fung and J.P. Bayle, Liq. Cryst. 19, 823 (1995). doi: 10.1080/02678299508031106
- S. Pestov, in Landolt-Börnstein, New Series, edited by V. Vill (Springer, Berlin, 2003).
- C. Wohlfarth and B. Wohlfarth, in Landolt-Börnstein, New Series, edited by M.D. Lechner (Springer, Berlin, 1996).
- C. Wohlfarth, in Landolt-Börnstein, New Series, edited by M.D. Lechner (Springer, Berlin, 2008)
- M.U. Winters, J. Kärnbratt, M. Eng, C.J. Wilson, H.L. Anderson and B. Albinsson, J. Phys. Chem. C 111, 7192 (2007). doi: 10.1021/jp0683519
- A.G. Moiseev, P.K. Poddutoori and A. van der Est, Appl. Magn. Reson. 42, 41 (2012). doi: 10.1007/s00723-011-0262-0
- S. Stoll and A. Schweiger, J. Magn. Reson. 178, 42 (2006). doi: 10.1016/j.jmr.2005.08.013
- S. Richert, M.D. Peeks, C.E. Tait, H.L. Anderson and C.R. Timmel, Phys. Chem. Chem. Phys. 18, 24171 (2016). doi: 10.1039/C6CP04444A