
 ?Mathematical formulae have been encoded as MathML and are displayed in this HTML version using MathJax in order to improve their display. Uncheck the box to turn MathJax off. This feature requires Javascript. Click on a formula to zoom.
Abstract
Bound and free quantum resonances of molecular hydrogen exhibiting wave-function density at large internuclear separation, 4–5 a.u., are excited via multi-step laser spectroscopy. Highly excited vibrational levels of H
are prepared via two-photon UV-photolysis of H
S. Subsequent two-photon Doppler-free precision measurements are performed connecting
levels with
outer-well levels. Detection and spectroscopic labelling of the quantum states is assisted by further laser excitation into the auto-ionisation continuum employing a third UV-laser. Level energies of high rotational states (
) in the outer-well state
are accurately determined. The three-laser study demonstrates a method for probing resonances in the H
ionisation continuum with wave-function density at large internuclear separation
4–5 a.u., large angular momenta J, and energy range 131,100–133,000 cm−1, a hitherto unexplored territory.
GRAPHICAL ABSTRACT

1. Introduction
The hydrogen molecule exhibits an electronic structure with a series of characteristic double-well potential energy curves. The lowest of those in the manifold of gerade symmetry, the state, was identified by Davidson [Citation1] and subsequently investigated by laser spectroscopy at ever increasing precision [Citation2–10]. The next double-well state of g-symmetry, the
state was identified initially in the study by Wolniewicz and Dressler [Citation11] and later investigated theoretically by Yu and Dressler [Citation12] and Ross and Jungen [Citation13]. It has recently been studied experimentally in precision laser studies [Citation14–16]. The outer well of the next higher lying double-well state in the gerade manifold, the
state, was probed by sequential two-photon laser excitation [Citation16–19]. Also in the manifold of ungerade symmetry a double well structure was predicted from an experimental study [Citation20] and thereafter in a ab initio calculation [Citation21]. This
state was later observed via multi-step laser excitation [Citation22,Citation23]. Theoretical investigations, also involving the intra-molecular tunnelling processes between inner and outer wells in the double well potentials were carried out by Dressler and co-workers [Citation24,Citation25].
The present study focuses on the spectroscopic characterisation and precision measurement of rovibrational levels in the lowest outer well state. Such levels were investigated previously via Fourier-Transform emission spectroscopy, also giving access to the
levels [Citation26], which could not be excited via two-photon laser excitation from the
ground state due to the extremely small Franck-Condon (FC) overlap [Citation3]. Access to the outer-well electronically excited levels can be achieved through two-photon ultraviolet photolysis of hydrogen sulfide (H
S) molecules, whereby highly vibrational states in the electronic ground state are produced. This was shown in one-colour laser studies by Steadman and Baer [Citation27]. These high-lying vibrational states have wave function density at large internuclear separation, which then can be exploited in multi-photon excitation to probe e.g.
outer-well states. In subsequent investigations, exploring this photolysis pathway in a more refined manner using three independently tunable lasers [Citation28,Citation29], the identification of
-
two-photon transitions was based on the known energy separations between the F and X levels. Accurate knowledge of the
(
) levels is obtained from advanced ab initio calculations [Citation30,Citation31], while the level energies in
are derived from Bailly et al. [Citation26]. However, the latter FT-emission study covers only rotational states (
) for the
state. Strong perturbations at high
states between outer
and inner
well levels prohibit the use of a straightforward extrapolation of rotational progressions [Citation9], making unambiguous assignments difficult.
In the present study autoionisation spectra originating in are recorded for assisting the identification of the two-photon transitions measured in the F−X system. These autoionisation spectra probe continuum states at large internuclear separation
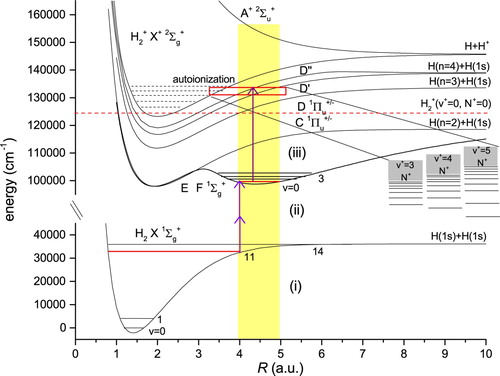
4–5 a.u., and in the energetic range above 131,000cm−1. In Figure the relevant potential energy curves and the three-step laser excitation scheme probing wave function density in the range of internuclear separations
4–5 a.u. are displayed. The autoionisation continua of H
have been amply studied via direct photoabsorption and photoionisation [Citation32], in multi-photon studies [Citation33,Citation34], using synchrotron sources [Citation35–38] and XUV-laser exctation [Citation39]. However, these studies were limited to excitation from the
vibrational ground state, to rotational quantum numbers
, and hence to small internuclear separations of
a.u. In such studies Franck-Condon overlap from the ground state is significant only up to the first few vibrational states of the
or
Rydberg manifolds converging to
ionic states. The present scheme of excitation into the autoionisation continuum provides access to continua of large angular momentum and wave-function density at large R, an unexplored regime.
Figure 1. Level scheme with potential energy curves for H and the three-laser excitation pathway. The first laser, photolysing H
S, produces high-v levels in the electronic ground state; the second laser induces the F−X transitions; the third laser ionises the molecule at energies above 131,000 cm−1. All excitations occur at the large internuclear separation
4–5 a.u, indicated by the grey (yellow) shaded bar. See text for further details.
2. Experimental setup
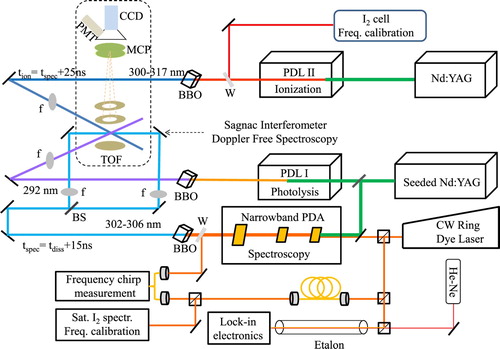
The schematic of our experimental setup, involving three ultraviolet (UV) lasers and a molecular beam machine is shown in Figure . In a first step vibrationally hot hydrogen molecules H 10–14
are produced via two-photon photodissociation of H
S molecule using a pulsed frequency-doubled dye laser with pulses of 4 mJ at 285–297 nm [Citation27]. In a second step, the output of a narrowband pulsed and frequency-doubled dye amplifier (PDA) at 300–308 nm is employed to induce two-photon transitions in the F−X system, in particular probing H
molecules in
in the present study. In view of the favourable Franck-Condon factor of 0.17 [Citation40] the
band is chosen for the spectroscopic study. The narrow bandwidth of the PDA (
MHz) and the use of a two-photon counter-propagating Sagnac interferometric alignment geometry [Citation41] highly resolved spectra can be measured. This scheme circumvents a large Doppler broadening associated with a kinetically hot distribution of H
molecules produced in photolysis. An optical delay line of 15 ns is introduced between photodissociation and spectroscopy lasers to avoid ac-Stark broadening by the photolysis laser. The frequency of the PDA is calibrated using the transmission markers of a length stabilised etalon with respect to the hyperfine spectral components of the B−X system of I
recorded through saturation spectroscopy.
Figure 2. Experimental configuration. Pulsed dye laser (PDL I) provides UV pulses for photolysis of HS molecules. The nascent H
photoproducts are subjected to two-photon Doppler-free spectroscopy, using 305 nm pulses generated by an injection-seeded narrowband PDA laser. A third laser (PDL II) is employed for recording autoionisation resonances excited from the F outer well levels. Ions are extracted by the electrostatic lens and detected at the end of the time-of-flight (TOF) tube after mass-selection.
A third laser (PDL II) delivering frequency-doubled pulses at 300–317 nm interacts with the molecules excited to the outer-well states , to produce ion signals and to record autoionisation resonances in the energy range 131,100–133,000 cm−1. The frequency of the PDL II is calibrated against the I
linear absorption spectrum. The ionisation laser is electronically delayed by 25 ns with respect to the spectroscopy laser, again to avoid ac-Stark broadening of F−X transitions. Resonant ionisation detection is achieved by extracting H
ions using time-of-flight (TOF) plates, which are triggered 50 ns after the ionisation laser. Finally, ions are detected by the microchannel plate (MCP) combined with a phospor placed at the end of the 40 cm long TOF tube and imaged by a CCD camera or by a PMT.
It is of importance for obtaining narrow F−X resonances that a third laser is tuned for ionisation to continuum resonances. In a previous study on the state, non-resonant detection of the produced F-state population via dissociative ionisation and H
formation was accomplished. Under these conditions it turned out to be necessary to probe F−X transitions at intensities well above GW/cm2 for producing sufficient H
signal levels, leading to large and asymmetric ac-Stark broadening [Citation28]. This difficulty was overcome in the subsequent study of
levels, where a resonant ionisation detection scheme followed by H
detection was implemented. This led to symmetric and narrower line profiles limited only by the instrumental bandwidth [Citation29]. The latter method is followed in the present study.
3. Doppler-free precision spectroscopy on  transitions
The present study builds on the methods and previous measurement of Q(1), Q(3), Q(4) and Q(5) two-photon lines in the band [Citation29]. In that study the line identification was based on the accurately reported level energies of
[Citation26] and the calculated
levels [Citation31]. A notation is adopted here that applies double and single primes on the rotational quantum number J for X and F states, respectively, while it is unprimed for autoinizing states. Since
for the
transitions of the
band observed here, the notation is somewhat simplified. As the context is clearer for the vibrational quantum number, the primed notation is not implemented for v. In the three-laser scheme based on the initial photolysis of H
S molecules the Doppler-free spectroscopy laser was scanned in the region of 301–306 nm, while a third UV-laser was parked at various wavelengths for producing H
ion signal. A number of two-photon resonances was observed, which could not all be assigned. For the case of the Q(6) and Q(7) two-photon lines in the
band identification could be accomplished, based on the autoionisation channel, which will be discussed and presented in the next section; no accurate values were reported for
by Bailly et al. [Citation26]. Figure displays the spectroscopic recording of the
line at low intensity, in combination with UV photolysis of H
S and ionisation into H
by the third UV-laser.
Figure 3. Doppler-free two-photon recording of the line calibrated using etalon markers with an FSR of 300.01 MHz and with respect to a reference
hyperfine line of 127I
at 16,377.60438 cm−1 [Citation42].
![Figure 3. Doppler-free two-photon recording of the Q(7) line calibrated using etalon markers with an FSR of 300.01 MHz and with respect to a reference (B−X) P(94) (12,3) a15 hyperfine line of 127I2 at 16,377.60438 cm−1 [Citation42].](/cms/asset/714bd2b8-a243-402c-a243-a08075077888/tmph_a_1599457_f0003_oc.jpg)
A systematic analysis to account for the ac-Stark effect on F−X two-photon transition is performed as illustrated in Figure , to deduce the field-free value for the transition energy from the extrapolation. The absolute accuracy of the calibration is at the level of 0.002 cm−1 or 60 MHz. A similar procedure was followed for the transition. Table , summarises the results and presents a comparison with previously published calculations within the framework of multichannel quantum-defect theory [Citation9].
Figure 4. (a) Recorded spectra of the
line under various power densities; (b) ac-Stark extrapolation plot of the
transition for determining the field-free value of the transition frequency.
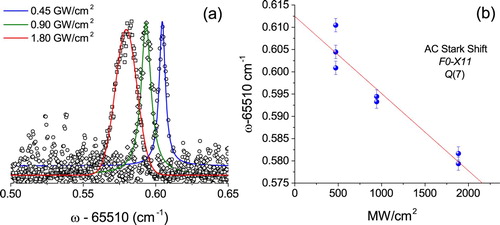
Table 1. Results of high precision measurements on two transitions in the band. The experimentally-derived level energies are compared with the results from MQDT calculations for the F state [Citation9]. Values are given in cm−1.
The and 7 levels in the lowest vibration of the
outer-well state have not been experimentally detected in previous studies. The studies of Bailly et al. [Citation26] and also of Yu and Dressler [Citation12] only report values for
for rotational states up to
. The experimental study by Dickenson et al. [Citation9] probing a large number of EF inner and outer well states is accompanied by a calculation of outer-well levels based on the MQDT-approach. The presently determined level energies for
and 7 deviate by 1.4 cm−1, which is still consistent with the accuracy of the MQDT calculations.
4. Continuum structure of H at large internuclear separation
4.1. Observed autoionisation spectra
The autoionisation structure of H has been investigated previously in a large number of studies [Citation32–34,Citation36–39,Citation43], but these were generally constrained by the probing of wave-function density projected from the
ground state. The present three-laser excitation scheme, starting with the two-photon photolysis of H
S and preparing H
molecules in quantum states with wave function density at large internuclear separation (
4–5 a.u.), offers a method to probe the molecule in excited states at large R as well. This holds not only for the levels excited in the
state but also in the continuum. The presently employed three-step excitation process also provides the selection tool of preparing well-defined angular momentum J states. Due to the one-photon selection rules only continuum resonances of
angular momentum will be probed, as shown in Figures and . The Rydberg states are described by Hund's case (d) with a total angular momentum
, where
is core angular momentum exclusive of spins and l is angular momentum the Rydberg electron.
Figure 5. Autoionisation spectra recorded from ,
and
states in para-H
. Common resonances with J=5 calculated from MQDT are indicated.
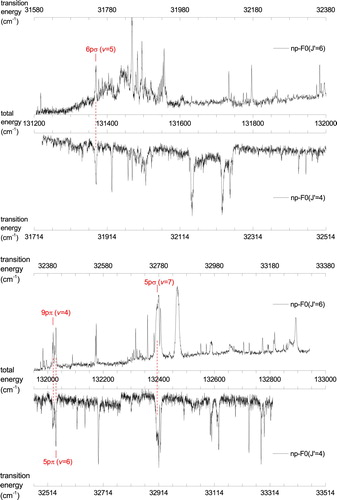
Figure 6. Autoionisation spectra recorded from ,
and
states in ortho-H
. Common resonances with J=6 calculated from MQDT are indicated. The (
) limit of the complex resonance Rydberg series is also shown.
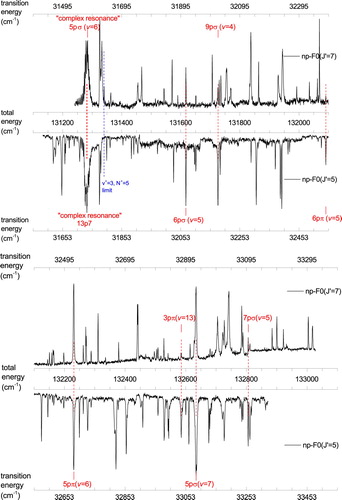
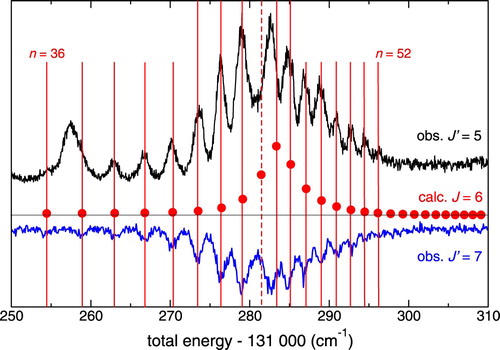
A detailed part of the recordings in ortho-H is presented in Figure displaying a complex resonance observed at a total excitation energy of
131,280 cm−1 with total angular momentum J=6. Here an autoionising Rydberg series of continuum np resonances is apparent for principal quantum numbers
34–52. The excitation occurs from the intermediate state
via R-transitions, and from the
intermediate state via P-transitions. The series gains oscillator strength in this region by interaction with an ‘interloper’, i.e. a Rydberg state converging to a higher-lying ionisation limit. The series converges to the
state of the H
ion at a total excitation energy of 131,339.66 cm−1, a value obtained by adding the known values of the ionisation potential of H
[Citation44] and the rovibrational excitation energy of the H
state [Citation45]. A more detailed discussion of this complex resonance will be presented below.
Figure 7. Complex resonance in ortho-H recorded from both
,
and
intermediate states. The vertical lines indicate members of an np Rydberg series converging to a limit with
and
at 131,339.66 cm−1. The red circles represent the calculated level energies, numbered consecutively from n=36, i.e. including interlopers. The approximate weight of the
interloper in the wave function of each level is indicated on the ordinate and provides a rough measure of the intensity transferred from the interloper to the Rydberg series. Another interloper
is also identified in the MQDT analysis as explained in the main text.
4.2. Labelling of outer-well levels via auto-ionisation
The current study employs the H super-excited states in the energy region 131,100–133,000 cm−1, corresponding to the range 6675–8525 cm−1 above the ionisation threshold, for the resonant excitation and detection of
outer well states and to produce signal in the spectroscopic study of F−X transitions. As shown in Figure the population density at the vibrational level
in the ground state that is promoted to
, can only be ionised effectively at internuclear separations of
4–5 a.u., where these states have wave-function densities occurring above131,100 cm−1.
Autoionisation spectra in this energy range are recorded by scanning the third UV-laser (frequency-doubled PDL II) in the wavelength range 300–317 nm, with a scan step interval of 0.1 cm−1. Spectra are calibrated using Doppler broadened I absorption lines in the spectral region of 15,775–16,675 cm−1, yielding an accuracy of 0.1 cm−1 in the UV. The photoionisation beam interacts with the H
molecules in the
state emanating equatorially in all directions with kinetic energies of
eV, resulting in Doppler broadening on the order of 1.2 cm−1 [Citation46]. Note that the Doppler distribution observed is caused by the photodissociation process since the subsequent Doppler-free F−X two-photon excitation probes all velocity classes, i.e. does not alter the distribution through velocity selection. For the labelling of the
intermediate states, autoionisation spectra were recorded from
levels in
. The spectra pertaining to para-H
, probed from
and 6 are plotted in Figure on a common energy scale for the total internal excitation in the molecule. The same is done for the spectra pertaining to ortho-H
in Figure , probed from
and 7 in the
level. The spectra in Figures and are composed of separate recordings, which sometimes lead to offsets in the background level where they arejoined.
Photoionisation of levels follows angular momentum selection rules for one-photon transitions and hence probes continuum resonances with
angular momenta. The P- and R- branch excitation channels connect to either
or
Rydberg states, whereas the Q-branch channel involves excitation to
states. The presence of repeating patterns when comparing autoionisation spectra originating from different
levels is of great importance for the rotational-state labelling of the intermediate
levels. Consider a comparison for
and
with a difference of
: if the two autoionisation spectra display a pattern of common resonances, then that spectral pattern can be attributed to P-lines from
and to R-lines from
sharing a common
continuum level. Hence the common resonance features in Figure are associated with continuum resonances of J=5 angular momentum symmetry, and the common lines in Figure relate to continuum resonances with J=6. The fact that such common resonances are found is proof that the state-labelling of
and
in the spectroscopy part of Section 3 and Table is correct. An analogous J-labelling technique has been applied previously by Schwarz et al. to the analysis of the Rydberg spectrum of Li
[Citation47].
4.3. Spectral assignments of J=5 and 6 resonances
Autoionisation spectra displaying Rydberg-continuum state interactions in molecular hydrogen have been successfully explained with the formalism of multichannel quantum-defect theory (MQDT) [Citation48]. Here this approach is applied to the assignment of the autoionisation structures attributed in the preceding section to J=5 and J=6. The calculations have been carried out as described in the papers by Glass-Maujean et al. [Citation49,Citation50], using the quantum defect functions described there for the interaction between the Rydberg electron and the H
ground state core. For the purpose of spectroscopic assignment we have disregarded the open ionisation channels, that is, the autoionisation processes have not been calculated in a first stage. Instead, discrete level positions were evaluated and compared with the observed peak maxima. The assignments were obtained by examining the multichannel wavefunction decomposition for each level and choosing the largest coefficient. These assignments have therefore no strict meaning because most levels have mixed character owing to strong non-adiabatic interactions. The assignments and results of the calculations are listed in Table . These resonances are excited via R- and P-lines and their electronic symmetry is
or
.
Table 2. Autoionisation resonances for J=5 and J=6 angular momenta observed in the spectra of Figures and , here assigned and compared with calculations via MQDT theory. Values are given in cm−1.
4.4. Discussion of the J=6 complex resonance near 131,280 cm−1
A detailed discussion of the complex resonance illustrated by Figure appears worthwhile here. The red dots in the figure associated with vertical lines for easy comparison represent the calculated resonance positions. In the present approach describing the observed continuum resonances by MQDT, we have not evaluated absolute rovibronic dipole transition intensities for the transitions because the corresponding electronic transition moments are not known at this stage. However, an approximate relative assessment of intensities is possible based on the overall normalisation factor
which is obtained in the MQDT computations, see Equations (26) and (54) of Ref. [Citation48], and which gives the local density of states in a one-channel or a multichannel Rydberg manifold. The intensity in excitation from a low-n Rydberg state (here the F state) scales roughly proportional to the inverse of this quantity – in a one-channel situation this is simply the well-known
Rydberg intensity scaling rule. Finer effects, such as interferences, are of course disregarded by this simple method. In Figure representing the complex resonance near 131,280 cm−1 for J=6, the quantity
has been plotted for each discrete level
versus its total energy, and is seen to reasonably reproduce the observed resonance pattern in relative terms.
Careful inspection of Figure reveals however that the theoretical spectrum contains one more line than there are peaks in the and
experimental spectra. In order to understand this, we use the concept of the effective quantum defect, defined as
, where n consecutively numbers the levels
and
is the effective principal quantum number given by the one-channel Rydberg expression
.
is the relevant Rydberg limit (here
) and
the Rydberg constant. In an unperturbed Rydberg series
is expected to be nearly constant, but it is well-known that if an interacting interloper is present,
will increase by unity near the position of the interloper. This is related to Levinson's theorem pertaining to potential scattering, which states that the phase shift at threshold equals π times the number of bound states supported by the potential [Citation51]. The increase takes place over a wider energy range the stronger the interaction, while in the limit of vanishing interaction it approaches the shape of a step-function that arises simply because one level n ‘too many’ has been counted.
Figure illustrates the effective quantum defects predicted by MQDT (red circles and curve) in the series for J=6 near 131,280 cm−1 in the range
38–52. It may be seen that
indeed increases, not by 1 but in fact by 2, indicating that two interlopers are present here. These can easily be identified in the calculations as corresponding to the
rotational interloper and the
vibrational interloper (cf. Table ). In an unperturbed scheme both interlopers are expected near about 131,284 cm−1, coinciding to within about 1 cm−1, while in the perturbed situation they are diluted over a range of about 8 cm−1.
Figure 8. Effective quantum defects derived from the observed peaks in Figure . The MQDT analysis reveals the presence of two interlopers in this complex resonance, see text for details.
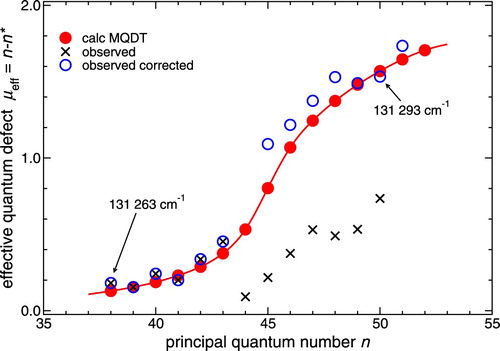
Figure also displays (black crosses) the effective quantum defects derived from the observed peaks numbered n consecutively starting with n=38 at 131,263 cm−1. While initially is seen to increase as predicted by the calculation, a break occurs between n=43 and 44 where
decreases sharply in the observed data points. This break may be removed if starting with n=44 all n values are increased by 1. Each corrected
value then also increases by 1, and the resulting pattern (blue circles) is now seen to follow the theoretical curve reasonably well. The conclusion then is that the n=44 component of the complex resonance is apparently unobserved, i.e. has low intensity in the spectrum.
Returning to Figure we see that the missing line falls between two successive observed resonances. While the present calculations do not allow us yet to confirm the postulated weak intensity of the n=44 resonance component (indicated by dashed vertical line in Figure ), we note that the spacing between the components at 131,279 and 131,283 cm−1 is noticeably larger than the preceding and the following spacings. This feature would be difficult to explain without invoking the presence of an unseen additional peak. Indeed, quantum mechanics tells us that a perturber state interacting with a series of levels pushes each state of the series up or down, respectively, ‘but not above or below the original position of the next higher or lower level’ [Citation52]. Therefore the density of levels cannot decrease locally near the centre of a complex resonance.
4.5. Calculation of autoionisation/predissociation decay widths
In a set of refined calculations we have reintroduced the open dissociation and ionisation channels into the MQDT treatment [Citation48]. Theoretical resonance decay widths have been obtained from the energy-derivative of the continuum eigenphase sum, i.e. the sum of the phase shifts resulting from the MQDT calculation. The sum runs over all open dissociation and ionisation channels. In the energy range considered here the open dissociation channels are the 3
B
and the 2
C state (the 2
B state being disregarded in the present treatment). The open ionisation channels correspond to the
0–3 vibration-rotation states of the ground state ion. For an isolated resonance the energy derivative of the eigenphase sum yields a Lorentzian shape whose position defines the resonance energy and whose maximum is related to the full-width half-maximum (FWHM) Γ by
(1)
(1) In our calculations we have identified the maxima corresponding to the left-hand-side of Equation (Equation1
(1)
(1) ) and equated their values to the right-hand-side of the same expression. Thereby any effects due to overlapping of resonances are obviously ignored.
With a laser source bandwidth of 0.2 cm−1 the effective instrumental FWHM width contribution on the observed transitions is estimated to be cm−1, dominated by the Doppler broadening. This estimate is consistent with the narrowest peaks observed in the autoionising spectra exhibiting widths of
cm−1. Most transitions in Table have calculated widths that are smaller than the effective instrumental width, except for the
transition. In the observed spectra, the
transition is blended with another peak, but could be resolved in the fitting procedure. Fitting with a model of two Gaussian features yields a FWHM width of
cm−1 for the
transition, with a line position of 132,394.3(3) cm−1. For the other blended transition, the same combined fit also yields a line centre of 132,400.1(1) cm−1 and FWHM width of
cm−1. Following a similar procedure as in Ref. [Citation53], the natural linewidth extracted from experimental spectra is
cm−1 which is consistent with the calculated width of 6.6 cm−1 in Table .
As Table indicates, the MQDT calculations provide an unambiguous assignment for some of the resonances observed for J=5 and J=6. This result is satisfying, but it should be realised that the present MQDT approach is not fully suited to describe the resonances whose vibrational components reach out to rather large internuclear distances. Indeed, near internuclear separations of 4–5 a.u., the F intermediate state as well as the continuum states carry character of the repulsive first excited electronic state of the ion core,
. For a proper description of the autoionisation structure in the presently excited range an extension of the MQDT-framework is therefore required, that should explicitly include (i) core-excited channels corresponding to Rydberg series that converge to the
excited state in the H
ion, and (ii) higher partial waves ℓ beyond
for the Rydberg electron.
5. Conclusion
The present study revisits the outer well in the H
molecule by probing levels that have significant wave function densities at large internuclear separation
4–5 a.u.. These become accessible by photolysis of hydrogen sulfide molecules. Doppler-free resonance-enhanced multi-photon ionisation measurements are extended to vibrationally as well as rotationally hot molecular levels
. Precise level energies of
are determined. Labelling of quantum states via autoionisation is applied. MQDT calculations, which only treat interactions between the l=1 Rydberg electron and the ground state ion core, already provide a number of unambiguous assignments and level energies that agree with experimental values to within a few cm−1. A particularly interesting result of the MQDT analysis involves the identification of double-interloper interactions in a complex resonance Rydberg progression. The study demonstrates a novel method to record spectra of continuum resonances exhibiting a high angular momentum
4–7 as well as wave function extending out to relatively large R. The present scheme, starting from H
S photolysis, in principle allows for probing yet higher angular momentum states in the continuum, when other F-intermediate outer-well states are chosen as pathways.
Acknowledgements
The authors wish to thank Prof. F. Merkt (ETH Zürich) for enlightening discussions.
Disclosure statement
No potential conflict of interest was reported by the authors.
Additional information
Funding
References
- E. Davidson, J. Chem. Phys. 35, 1189 (1961). doi: 10.1063/1.1732023
- D. Kligler and C. Rhodes, Phys. Rev. Lett. 40, 309 (1978). doi: 10.1103/PhysRevLett.40.309
- E.E. Marinero, R. Vasudev and R.N. Zare, J. Chem. Phys. 78, 692–699 (1983). doi: 10.1063/1.444822
- E.E. Eyler, J. Gilligan, E.F. McCormack, A. Nussenzweig and E. Pollack, Phys. Rev. A 36, 3486 (1987). doi: 10.1103/PhysRevA.36.3486
- K. Tsukiyama, J. Ishii and T. Kasuya, J. Chem. Phys. 97, 875–882 (1992). doi: 10.1063/1.463191
- A. Yiannopoulou, N. Melikechi, S. Gangopadhyay, J.C. Meiners, C.H. Cheng and E.E. Eyler, Phys. Rev. A 73, 022506 (2006). doi: 10.1103/PhysRevA.73.022506
- S. Hannemann, E.J. Salumbides, S. Witte, R.T. Zinkstok, E.J. van Duijn, K.S.E. Eikema and W. Ubachs, Phys. Rev. A 74, 062514 (2006).
- E.J. Salumbides, G.D. Dickenson, T.I. Ivanov and W. Ubachs, Phys. Rev. Lett. 107, 043005 (2011). doi: 10.1103/PhysRevLett.107.043005
- G.D. Dickenson, E.J. Salumbides, M. Niu, Ch. Jungen, S.C. Ross and W. Ubachs, Phys. Rev. A 86, 032502 (2012). doi: 10.1103/PhysRevA.86.032502
- R.K. Altmann, L.S. Dreissen, E.J. Salumbides, W. Ubachs and K.S.E. Eikema, Phys. Rev. Lett. 120, 043204 (2018). doi: 10.1103/PhysRevLett.120.043204
- L. Wolniewicz and K. Dressler, J. Mol. Spectrosc. 67, 416 (1977). doi: 10.1016/0022-2852(77)90050-9
- S. Yu and K. Dressler, J. Chem. Phys. 101, 7692 (1994). doi: 10.1063/1.468263
- S.C. Ross and Ch. Jungen, Phys. Rev. A 50, 4618–4629 (1994). doi: 10.1103/PhysRevA.50.4618
- D. Sprecher, M. Beyer and F. Merkt, Mol. Phys. 111, 2100–2107 (2013). doi: 10.1080/00268976.2013.788743
- C.-F. Cheng, J. Hussels, M. Niu, H.L. Bethlem, K.S.E. Eikema, E.J. Salumbides, W. Ubachs, M. Beyer, N. Hölsch, J.A. Agner, F. Merkt, L.-G. Tao, S.-M. Hu and Ch. Jungen, Phys. Rev. Lett.121, 013001 (2018).
- N. Hölsch, M. Beyer and F. Merkt, Phys. Chem. Chem. Phys. 20, 26837–26845 (2018). doi: 10.1039/C8CP05233F
- E. Reinhold, W. Hogervorst and W. Ubachs, Phys. Rev. Lett. 78, 2543–2546 (1997). doi: 10.1103/PhysRevLett.78.2543
- E. Reinhold, W. Hogervorst, W. Ubachs and L. Wolniewicz, Phys. Rev. A 60, 1258–1270 (1999). doi: 10.1103/PhysRevA.60.1258
- H.J. Wörner, S. Mollet, Ch. Jungen and F. Merkt, Phys. Rev. A 75, 062511 (2007). doi: 10.1103/PhysRevA.75.062511
- I. Dabrowski and G. Herzberg, Can. J. Phys. 52, 1110–1136 (1974). doi: 10.1139/p74-149
- W. Kołos, J. Mol. Spectrosc. 62, 429–441 (1976). doi: 10.1016/0022-2852(76)90281-2
- A. de Lange, W. Hogervorst, W. Ubachs and L. Wolniewicz, Phys. Rev. Lett. 86, 2988–2991 (2001). doi: 10.1103/PhysRevLett.86.2988
- R.C. Ekey, A. Marks and E.F. McCormack, Phys. Rev. A 73, 023412 (2006). doi: 10.1103/PhysRevA.73.023412
- K. Dressler, R. Gallusser, P. Quadrelli and L. Wolniewicz, J. Mol. Spectrosc. 75, 205 (1979). doi: 10.1016/0022-2852(79)90117-6
- P. Quadrelli, K. Dressler and L. Wolniewicz, J. Chem. Phys. 92, 7461 (1990). doi: 10.1063/1.458181
- D. Bailly, E. Salumbides, M. Vervloet and W. Ubachs, Mol. Phys. 108, 827–846 (2010). doi: 10.1080/00268970903413350
- J. Steadman and T. Baer, J. Chem. Phys. 91, 6113–6119 (1989). doi: 10.1063/1.457430
- M.L. Niu, E.J. Salumbides and W. Ubachs, J. Chem. Phys. 143, 081102 (2015).
- T.M. Trivikram, M.L. Niu, P. Wcisło, W. Ubachs and E.J. Salumbides, Appl. Phys. B 122, 294 (2016). doi: 10.1007/s00340-016-6570-1
- K. Piszczatowski, G. Łach, M. Przybytek, J. Komasa, K. Pachucki and B. Jeziorski, J. Chem. Theory Comput. 5, 3039–3048 (2009). doi: 10.1021/ct900391p
- J. Komasa, K. Piszczatowski, G. Łach, M. Przybytek, B. Jeziorski and K. Pachucki, J. Chem. Theory Comput. 7, 3105–3115 (2011). doi: 10.1021/ct200438t
- P.M. Dehmer and W.A. Chupka, J. Chem. Phys. 65, 2243–2273 (1976). doi: 10.1063/1.433383
- M.A. O'Halloran, S.T. Pratt, F.S. Tomkins, J.L. Dehmer and P.M. Dehmer, Chem. Phys. Lett. 146, 291–296 (1988). doi: 10.1016/0009-2614(88)87447-5
- Ch. Jungen, S.T. Pratt and S.C. Ross, J. Phys. Chem. 99, 1700–1710 (1995). doi: 10.1021/j100006a011
- M. Glass-Maujean, Ch. Jungen, G. Reichardt, A. Balzer, H. Schmoranzer, A. Ehresmann, I. Haar and P. Reiss, Phys. Rev. A 82, 062511 (2010). doi: 10.1103/PhysRevA.82.062511
- M. Glass-Maujean, Ch. Jungen, A. Spielfiedel, H. Schmoranzer, I. Tulin, A. Knie, P. Reiss and A. Ehresmann, J. Mol. Spectros. 293–294, 1–10 (2013). doi: 10.1016/j.jms.2013.09.010
- M. Glass-Maujean, Ch. Jungen, H. Schmoranzer, I. Tulin, A. Knie, P. Reiss and A. Ehresmann, J. Mol. Spectros. 293–294, 11–18 (2013). doi: 10.1016/j.jms.2013.09.007
- M. Glass-Maujean, Ch. Jungen, H. Schmoranzer, I. Tulin, A. Knie, P. Reiss and A. Ehresmann, J. Mol. Spectros. 293–294, 19–26 (2013). doi: 10.1016/j.jms.2013.09.009
- M. Sommavilla, F. Merkt, J.Z. Mezei and Ch. Jungen, J. Chem. Phys. 144, 084303 (2016). doi: 10.1063/1.4941920
- U. Fantz and D. Wünderlich, Atom. Data Nucl. Data Tables 92, 853–973 (2006). doi: 10.1016/j.adt.2006.05.001
- S. Hannemann, E.J. Salumbides and W. Ubachs, Opt. Lett. 32, 1381 (2007). doi: 10.1364/OL.32.001381
- S. Xu, R. van Dierendonck, W. Hogervorst and W. Ubachs, J. Mol. Spectr. 201, 256 (2000). doi: 10.1006/jmsp.2000.8085
- G. Herzberg and Ch. Jungen, J. Mol. Spectrosc. 41, 425–486 (1972). doi: 10.1016/0022-2852(72)90064-1
- J. Liu, E.J. Salumbides, U. Hollenstein, J.C.J. Koelemeij, K.S.E. Eikema, W. Ubachs and F. Merkt, J. Chem. Phys. 130, 174306 (2009).
- R. Moss, Mol. Phys. 80, 1541–1554 (1993). doi: 10.1080/00268979300103211
- T.M. Trivikram, PhD Thesis, Vrije Universiteit, Amsterdam, 2019.
- M. Schwarz, R. Duchowicz, W. Demtröder and Ch. Jungen, J. Chem. Phys. 89, 5460–5472 (1988). doi: 10.1063/1.455598
- Ch. Jungen, in Handbook of High Resolution Spectroscopy, edited by F. Merkt and M. Quack (Wiley, Chichester and New York, 2011).
- M. Glass-Maujean and Ch. Jungen, J. Phys. Chem. A 113, 13124–13132 (2009). doi: 10.1021/jp902846c
- M. Glass-Maujean, Ch. Jungen, H. Schmoranzer, I. Haar, A. Knie, P. Reiss and A. Ehresmann, J. Chem. Phys. 135, 144302 (2011). doi: 10.1063/1.3646734
- R.G. Newton, Scattering Theory of Waves and Particles (Springer, Berlin, 1982).
- E.U. Condon and G.H. Shortley, The Theory of Atomic Spectra (Cambridge University Press, Cambridge, 1951).
- M. Glass-Maujean, Ch. Jungen, G. Dickenson, N. de Oliveira and W. Ubachs, J. Mol. Spectros. 320, 33–38 (2016). doi: 10.1016/j.jms.2016.01.002