
 ?Mathematical formulae have been encoded as MathML and are displayed in this HTML version using MathJax in order to improve their display. Uncheck the box to turn MathJax off. This feature requires Javascript. Click on a formula to zoom.
Abstract
The electronic spectrum of C
in the gas-phase with origin band at
is reported following experiments in a cryogenic ion trapping instrument. Buffer gas-cooled C
ions, generated by laser vaporisation of graphite, were investigated using two action spectroscopy approaches. Laser-induced dissociation of weakly bound
complexes synthesised in the trap reveal a linear dependence of the absorption energies on n allowing prediction of those of the bare ion C
. These results are confirmed in two colour experiments on C
, by monitoring fragmentation into the
product channel. The data are supplemented with high-level electronic structure calculations which support the assignment of
symmetry to the ground electronic state. These laboratory results provide the requisite data needed for spectroscopic detection of this structure in terrestrial and extraterrestrial environments.
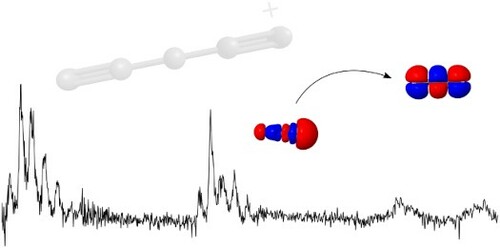
GRAPHICAL ABSTRACT
1. Introduction
Gas-phase infrared spectra of the carbon chain C were reported in 1989 by several groups [Citation1–4]. These rotationally resolved data indicate a linear cumulene structure with four identical bond lengths in the ground electronic state,
. The
band around
was used by Bernath et al. to identify C
in the carbon star
[Citation1]. The discovery of C
in circumstellar regions, as discussed by Heath et al., highlights the importance of carbon chains in the chemistry of astrophysical environments [Citation2]. The cyanopolyacetylenes,
, have been known constituents of dense clouds in the interstellar medium since the 1970s (see Ref. [Citation5] and references therein). Their presence led to the influential proposal by Douglas [Citation6] that the photophysical properties of bare carbon chain molecules make them appealing candidates for the diffuse interstellar bands (DIBs) in the optical region. A recent review discussing the measurement of the electronic transitions of various carbon chains in the laboratory and comparison with observational data is Ref. [Citation7].
Electronic absorptions of in the gas phase were detected by Maier and colleagues using cavity ring-down spectroscopy [Citation8], following earlier observation in a neon matrix [Citation9]. The measured spectrum was assigned to
with an origin band at
. Additional electronic bands to higher energy were reported in Ref. [Citation10] employing a resonant two-colour two-photon ionization scheme for detection. Rotational lines in the system near
were not resolved and the broadening attributed to intramolecular processes. The origin band was observed to have a full width at half maximum (FWHM) of around
, corresponding to an excited state lifetime of
. The assignment of this electronic transition was made in reference to theoretical calculations [Citation11]. More recent ab inito calculations [Citation12] find a
discrepancy between the calculated transition energy and the experimental measurement and suggest instead that it is a formally forbidden transition, to either
or
. The implications are discussed in Ref. [Citation10], in relation to the experimentally measured band contour. The detection of gas phase electronic transitions of
enabled searches for its signatures in absorption in interstellar environments where
had been previously identified [Citation13]. Observations through diffuse clouds toward ζ Ophiuchi did not lead to detection and an upper limit to its column density of
was determined along this line of sight [Citation14,Citation15], and others [Citation16], at least an order of magnitude below that of
.
High-resolution photoelectron spectra of ,
and
at low temperature in the gas phase were recently reported by Neumark and coworkers [Citation17,Citation18]. In contrast to the neutral and anion, however, there exists no gas-phase experimental data on the electronic transitions of the singly charged cation
. Note that electronic spectra of larger positive, neutral, and negatively charged
fragments generated by dissociation of
were recorded by matrix isolation spectroscopy [Citation19]. Theoretical work on the
open-shell system relevant to the present work has been reported by several authors [Citation20–23], leading to the question of whether the ground state is
or
. The most recent reports appear to clarify this, showing that the ground state has the highly symmetric structure [Citation22,Citation23]. The calculations by Belau et al. also indicate the linear isomer is much preferred over cyclic C
structures [Citation23]. The electronic configuration of
,
, leads to a
ground electronic state in
symmetry. The results of large-scale ab initio coupled-cluster and multi-reference configuration interaction (MRD-CI) calculations reported in Ref. [Citation22] predict dipole allowed transitions from
to low lying excited states at
(
,
),
(
,
),
(
,
), and
(
,
).
In this contribution, spectroscopic observations of electronic absorptions of in the range
are reported. These measurements were carried out in the gas-phase at low temperature through action spectroscopy in a cryogenic ion trap. Two approaches were adopted, the first involved tagging
ions with helium atoms and monitoring dissociation of the weak bond between
and He that occurred following electronic excitation of
. The second spectroscopic method probed
ions more directly in a two colour experiment by monitoring fragmentation into
.
This paper is organised as follows. Experimental and computational details are described in Section 2. Experimental results are presented and discussed in Section 3. Computational results are presented and discussed in relation to the proposed assignment in Section 4, and conclusions are given in Section 5.
2. Methods
2.1. Experimental
Experiments were carried out with the apparatus described in detail in Ref. [Citation24]. Ions were produced in a laser vaporization source containing a translating and rotating graphite rod. Radiation from a pulsed Nd:YAG laser at (
) was focussed with a
lens onto the rod. The produced species were expanded in a helium pulse through a channel in the source block that runs perpendicular to the laser propagation direction. The gas was admitted by pulsing a piezo valve from
to
for
, and the process repeated at a rate of
. A variety of pure carbon cations with m/z separated by
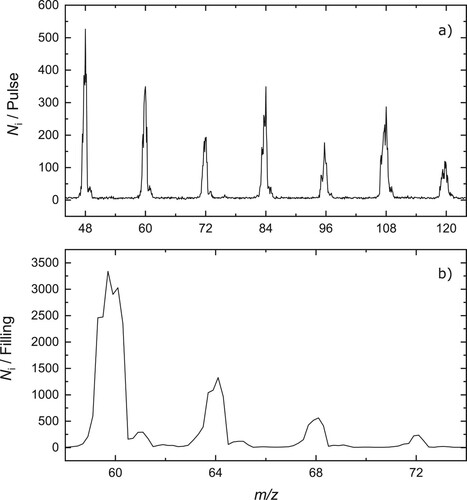
were synthesised, and a typical mass spectrum recorded under these conditions is shown in Figure (a).
Figure 1. (a) Mass spectrum demonstrating the formation of (
) in the laser vaporisation source. (b) Mass spectrum of trap contents following storage of
ions in cold (
) and dense (
) helium buffer gas. The data indicate the formation of
with
.
Mass selected ions with were turned through
and loaded into the s-4PT trap [Citation25] operating at a nominal temperature
and with helium number densities of
.
ions were accumulated for 5 source laser pulses and cooled via inelastic collisions. Under these conditions, a significant fraction of
ions could be converted into
complexes Figure (b). The helium buffer gas was pumped out for several hundred milliseconds before the contents were extracted and analysed using the second quadrupole mass spectrometer. The trapping cycle was repeated at a rate of
Photofragmentation spectra of were obtained by exposing the trapped ion cloud to tuneable radiation from either a pulsed OPO or a dye laser before extraction. The latter was operated with Coumarin 503 dye, supplying radiation in the visible (
). The number of complexes was monitored on alternating storage cycles with (
) and without (
) exposure to radiation in order to account for fluctuations in the number of ions trapped. Two colour experiments on
were carried out at elevated trap temperatures (
) to avoid
formation. Following electronic excitation using the dye laser, the
ions were fragmented into
by absorption of radiation from a pulsed OPO. Further details on the spectroscopic detection are provided and discussed in Section 3.3.
2.2. Computational
Quantum chemical calculations were carried out with the aim of aiding the interpretation of the experimental data. The geometry of was first obtained using the DFT based ωB97XD method and the 6-311+G(3df,3pd) basis set using Gaussian09 [Citation26]. ωB97XD is a range-separated hybrid DFT functional successfully applied in the calculation of excitation energies of various organic molecules [Citation27]. Due to the highly multi-configurational character of the ground state wave function of
the complete active space self-consistent field with second-order perturbation theory correction (XMS-CASPT2/CASSCF) method and the cc-pVDZ basis set [Citation28] were used to refine the geometry [Citation29,Citation30]. This method accounts for both dynamic and static electronic correlation and offers systematically more accurate results.
The XMS-CASPT2/CASSCF optimisation was carried out using the Bagel program [Citation31,Citation32], starting from the structure obtained from the prior optimisation with the ωB97XD/6-311+G(3df,3pd) method. An active space consisting of 9 electrons correlated in 8 orbitals was selected for the optimisation. The molecular orbitals included in the active space are presented in the Supplemental Material (Figure S1). This active space proved to be very stable for all types of calculations that we performed, and enabled successful geometry optimisations and comparison of the energies of the symmetric and non-symmetric forms of . The active space was also selected with consideration of the rules proposed by Veryazov et al. [Citation33], which suggest the inclusion of molecular orbitals having occupations between 0.02 and 1.98.
The geometry optimisations performed with the ωB97XD method and without any symmetry restrictions returned a less symmetric geometry as opposed to the
structure returned by XMS-CASPT2 calculations. However, owing to the lack of an analytical Hessian for the XMS-CASPT2 method, the ground state geometry of
at the ωB97XD level of theory was reoptimised with imposed
symmetry restrictions. This allowed calculation of the harmonic vibrational frequencies of
in the ground electronic state, which are presented in the Supplemental Material (Figure S2 and Table S1).
Vertical excitation energies and single-point energies of the DFT and the XMS-CASPT2/CASSCF structure were calculated at the NEVPT2/SA-CASSCF level. It is also worth noting that analytical energy gradients have not been implemented for the NEVPT2 method, so far, and that is why the ground-state geometry optimisations were performed at the equivalent XMS-CASPT2 level. The NEVPT2 approach is similar in nature to the XMS-CASPT2 method and allowed the use of the larger cc-pVTZ basis set in the excited-state calculations, which was necessary to more accurately reproduce the excitation energy of the key optically bright excited state. The active space used for vertical excitation energies included 9 electrons correlated in 8 orbitals and the CASSCF calculation involved averaging over 9 electronic states (abbreviated as SA-CASSCF). The orbitals were selected as described for the optimisation procedure based on molecular orbital occupations. Due to the non-negligible effect of spin-orbit coupling in the ground state of the
anion [Citation17], the Breit-Pauli spin-orbit coupling operator was included in the calculations, together with the scalar relativistic 2
order Douglas-Kroll-Hess Hamiltonian. For these calculations, the relativistically contracted cc-pVTZ-DK basis set was used.
Geometry optimisations were attempted for the complex, however, because of its very flat potential energy surface and limited numerical accuracy of the optimisation procedure, substantial convergence problems were encountered. No clear minima were located at the XMS-CASPT2/CASSCF/cc-pVDZ level despite attempts using numerous initial geometries. This is a direct consequence of the very low interaction energies between the He atom and the
ion. Therefore, to evaluate the effect of helium tagging in a qualitative manner, rigid potential energy surface scans were carried out at the NEVPT2/SA-CASSCF/aug-cc-pVTZ level of theory by changing the distance between the He atom the minimum-energy geometry of the
molecule. Three different configurations of the tagged species were selected, for which the
He distance either along the molecular axis of
(one scan) or perpendicular to it (two different scans) was changed. The different scans and their associated coordinates are indicated in Figure and S3 of the Supplemental Material. All the NEVPT2/SA-CASSCF calculations were carried out using the ORCA 4.2.1 program package [Citation34].
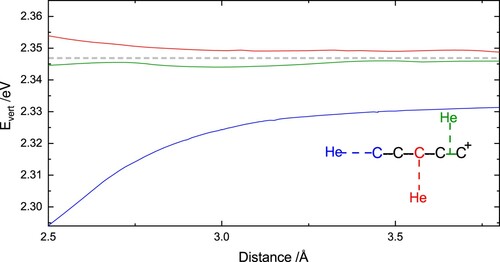
Figure 2. Vertical excitation energies, calculated at the NEVPT2/SA-9-CASSCF(8,9)/aug-cc-pVTZ level of theory, for three different isomers of the complex, as a function of the distances between the two subunits presented in the inset and described in the text. The grey horizontal dashed line indicates the value for
.
3. Results and discussion
3.1. Photodissociation of 
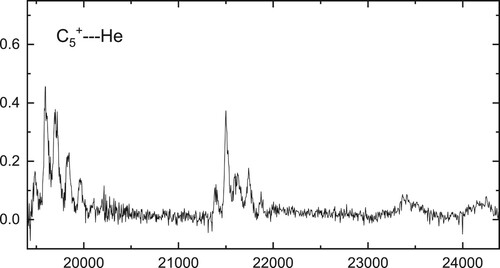
Weakly bound complexes synthesised in the ion trap were spectroscopically probed by one photon dissociation. The attenuation of
ions in the range
(
), reveals rich structure, as shown in Figure , where an overview spectrum recorded using a
bandwidth OPO is presented. The separation of peaks suggests assignment can be made to vibrational activity in the excited electronic state by comparison with the known vibrational frequencies of
, as listed in Table 8 of Ref. [Citation35]. The lowest energy absorption near
is not the most intense, and the overall pattern in the region
is reminiscent of an electronic transition involving a geometry change. The
band system is expected in this region [Citation22], and assignment of the absorption observed at around 513nm (
) to the origin agrees with the theoretical prediction, as it lies within the uncertainty of about
quoted for calculations at the same level on
[Citation12].
Figure 3. Overview spectrum showing electronic transition of C
observed by one-colour fragmentation with an OPO.
Experimental data recorded using a dye laser () across the low energy part of the spectrum is presented in Figure (a). The strongest absorption lies
to higher energy and may thus be due to the excitation of the low frequency cis bending mode
in the excited electronic state (see Figure S2 for a visualisation of the calculated C
vibrations). The pattern of absorptions to higher energy indicates a progression in this mode up to
. The absorption
to the blue of the origin is consistent with the excitation of one quantum of
, while the width of the broader feature near
suggests it may comprise two unresolved absorptions. Based on the energy separation from the origin, these may be due to the excitation of 3 quanta of
and the fundamental of the
combination band. The combs in Figure (a) indicate these tentative assignments, while Table additionally provides the wavenumbers and widths of the absorptions, as determined through Lorentzian fits to the experimental data. The other strong absorptions in the range
, resembling the pattern in the region
, may be combination bands involving the above and the totally symmetric
mode.
Figure 4. (a) Lowest energy portion of transition of C
recorded using a dye laser. The combs were created with
and
. The broader width of the peak near
may indicate more than one unresolved absorption. (b)
electronic transition of C
observed by monitoring the production of
ions (black) or depletion of
ions (blue). Experimental data (circles) have been fit with Lorentzian profiles, the cumulative results are the solid lines.
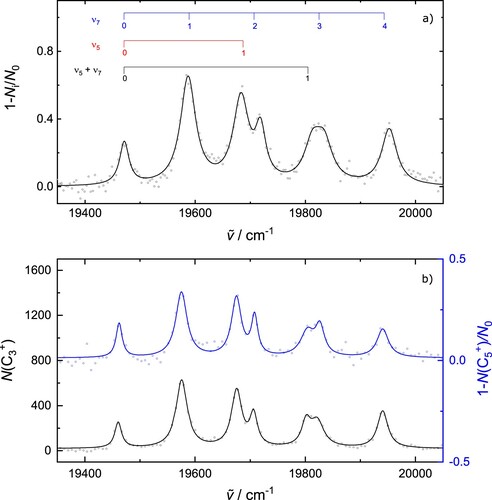
Table 1. Observed absorption bands in the electronic spectrum of
.
The electronic transition of C
is dipole allowed and the symmetry of the transition dipole moment must transform as
in
. Thus vibronic transitions should only be observable if
contains
.
has
symmetry and therefore excitations from the vibrationless
ground state to the excited
electronic state with odd quanta in
are forbidden. The symmetry of these odd quanta vibronic states is
. The
component of the electric dipole operator could allow access to excited
vibronic state(s). In this case, the transition may ‘borrow’ intensity from the nearby
transition (Herzberg-Teller effect). This has also been attributed to the appearance of vibronic bands in the electronic spectrum of l-C
H
[Citation36].
The observed electronic spectrum shows no rotational structure. A possible reason is due to the short lifetime of the excited electronic state. Simulations of the electronic transition of C
at
are reported in Refs. [Citation8] & [Citation10]. For this neutral system, the rotational structure was also unresolved with each line broadened by
, corresponding to an excited state lifetime of
. The observed absorption bands, corresponding to the
electronic transition of C
, possess Lorentzian profiles with FWHM in the range
. This observation indicates the spectrum is rather insensitive to changes to the rotational constant between the involved electronic states and suggests excited-state lifetimes of
. Note that for C
ions stored in
helium buffer gas, translational temperatures (
) as high as
would still lead to a rotational temperature below
. Simulations using the rotational constants of C
show only a small increase (
) in the FWHM upon increasing the rotational temperature from 10 to
in such a lifetime broadened transition. Moreover, the expected Doppler width of rotational lines at
would be just
, making a negligible contribution to the experimental width.
3.2. Photodissociation of
Under conditions of low temperature and high buffer gas number density, ions with multiple helium atoms attached are readily formed in the trap. This enabled photofragmention spectra of
,
, and
to be obtained by monitoring the attenuation of ions with
, 68, and 72. The data presented in Figure , recorded in the range
, show a clear blue-shift in the wavelengths at band maxima, and a broadening, with increasing n. Concerning the widths, the effect is most evident from inspection of the peaks near
, which are resolved for
but much less so for
. A possible reason for this is due to an isomeric effect, similar to the situation observed for the much larger structure
.
Figure 5. electronic transition of C
(
) observed by one-colour fragmentation. The experimental data (circles) have been fit with Lorentzian profiles, the cumulative results are the solid lines.
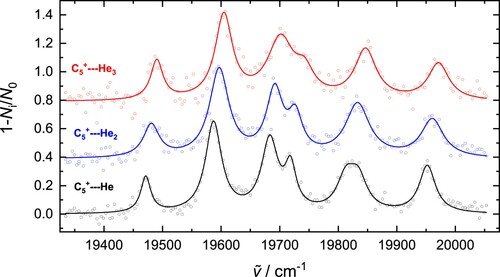
The lowest energy absorption band, assigned to the band origin, shifts from for
to
for
, and
for
. This
displacement of the absorption per helium atom is linear, and consideration of other bands in the spectra shown in Figure leads to similar results. Note that the magnitude of the shift is significantly larger than for the electronic transitions of
in the near-infrared region, where the helium perturbs the spectrum by a fraction of a wavenumber [Citation37–39].
The linear relationship between the absorption wavenumbers and n suggests the data can be used to estimate the values at which the electronic transition of (
) occurs. In the Supplemental Material (Figure S4), a fit to the wavenumbers of the origin bands in the
spectra presented in Figure is shown. The slope of the fit indicates a shift per helium atom of
. Assuming the linear behaviour holds between
and
, the intercept can be used to predict the corresponding absorption band of
at
. This prediction is quite accurate, as described in the following section. The extrapolated
wavenumbers are listed in Table .
Table 2. Comparison of absorption characteristics inferred from different spectroscopic methods.
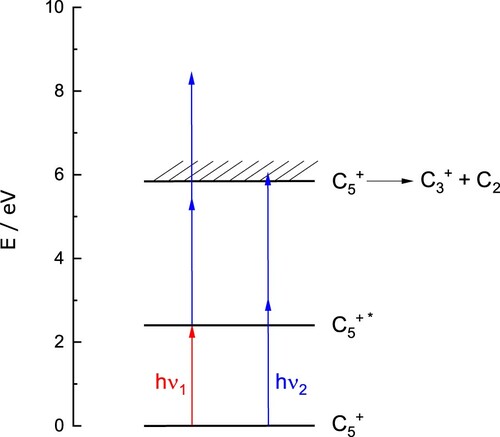
3.3. Fragmentation of
Further experiments were carried out to obtain the spectrum of bare , free from perturbation by helium atom(s). A two-colour approach proved successful, with the absorption bands detected by fragmentation of
into
. In these experiments, a dye laser was scanned across the region
, inducing the
transition, while a second, fixed frequency laser operating at
, was used to fragment the electronically excited molecules. The scheme is shown in Figure . Electronic absorption by cold
ions was monitored through (1) the attenuation of ions with
and (2) the appearance of
ions at
. Note that in these 2-colour fragmentation experiments the temperature of the walls of the ion trap,
, was raised to
to prevent complications due to the formation of helium complexes. A typical mass-spectrum obtained following irradiation on resonance is presented in the Supplemental Material (Figure S5), showing the appearance of
with
.
Figure 6. fragmentation scheme. The red arrow (
) indicates one photon electronic excitation (pump, dye laser) and the blue arrow (
) represents the probe (OPO).
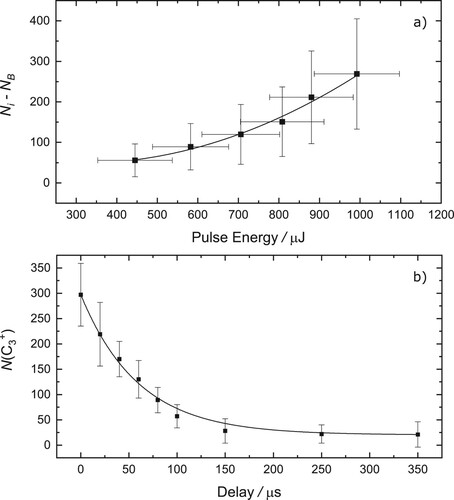
The number of ions produced as a function of probe pulse energy at
is shown in Figure (a). A small, probe only, signal (
) was subtracted to reveal the dependence of the two-colour signal. As shown, the data is non-linear and is reproduced with a second-order function, suggesting a 2-photon process in the probe step in these measurements. The absorption of one
and two
photons increases the internal energy of (internally cold)
ions by
, well above the predicted fragmentation threshold (see Figure ). The energy of two
photons lies near threshold and may account for the weak (few
ions / pulse) probe only signal.
Figure 7. (a) Number of ions produced via two-colour fragmentation of
as a function of the OPO (probe) pulse energy. Experimental data (squares) have been fit with a second-order polynomial (solid line). (b) Number of
ions as a function of the delay between the pump (dye laser) and probe (OPO). An exponential fit (solid line) to typical experimental data (squares) indicates a time constant of around
.
Spectroscopic data obtained by monitoring the attenuation of ions with and the production of ions with
are shown in Figure (b). Both detection schemes give similar results, however, as the latter method is (almost) background free the signal to noise ratio (S/N) is higher. The origin band maxima determined from Lorentzian fits are at
and
for
and
, respectively. The spectroscopic characteristics are listed in Table in comparison with the extrapolated
values inferred from the
data. The band maxima predicted for
are found to be in remarkable agreement with the results obtained by fragmentation of
itself.
The dependence of the number of ions on the delay between the dye laser and OPO is shown in Figure (b). The data are fit with an exponential decay, yielding a time constant of around
. Remarkably, given the sub-picosecond lifetime of the excited electronic state, two-colour fragmentation can still be observed at a delay of
. It, therefore, appears likely that following electronic excitation, intramolecular dynamics leads to the population becoming trapped in a long-lived state such that the probe, fragmentation, step, is still accessible after
. It is interesting to compare this result with the electronic transition of
, [Citation10] where it was suggested that either a nearby triplet state acts as a ‘sink’, or that the system becomes trapped in vibrationally excited levels in the ground electronic state. Whatever the explanation in the case of the present work on
, the photoexcited population remains available for fragmentation for even longer timescales.
4. Theoretical interpretation of the results
The results of geometry optimisations are presented in the Supplemental Material (Figure S6). The DFT calculations agree well with previous calculations at the B3LYP/cc-pVDZ level of theory [Citation21]. The ωB97XD/6-311+G(3df,3pd) optimisation resulted in a structure belonging to the point group, with the four C–C bonds arranged in an alternating long-short manner. The previous optimisation at the CCSD(T)/cc-pVTZ level of theory [Citation22] shows that this structure is not the lowest energy arrangement, and resulted in a more symmetric
geometry. This has two short terminal bonds and two longer inner C–C bonds. To further test the validity of the more symmetric geometry predicted by the CCSD(T) approach, the multi-configurational XMS-CASPT2/CASSCF method was used to optimise the ground state geometry.
The XMS-CASPT2 geometry optimisation, initiated from that obtained at the ωB97XD/6-311+G(3df,3pd) level, resulted in a nearly fully symmetric geometry structure, as shown in Figure S6 in comparison with the bond lengths reported in Ref [Citation22]. It is worth noting that no symmetry restrictions were involved in the geometry optimisations, and thus, some numerical inaccuracy of the optimisation procedure is expected. The XMS-CASPT2 geometry is characterised by a shorter terminal and longer inner C-C bond lengths, which is consistent with the trends observed by Schnell et al., and indicates that DFT calculations artificially stabilise the less symmetric C
structure.
Vertical excitation energies calculated using the NEVPT2/SA-CASSCF/cc-pVTZ approach are presented in Table . The molecular orbital characters of specific excited electronic states are consistent with the previous calculations performed at the MRDCI/cc-pVTZ level of theory [Citation22]. Additionally, a splitting of the π orbitals was observed, which can be seen in Figure . This leads to two bright states close in energy with a separation of 0.18 eV. These transitions are expected at 2.35 eV and 2.53 eV, and while they lie close in energy to the two sets of absorption bands shown in Figure , they are believed to be caused by the slight deviation from the
geometry. A calculation of the vertical excitations based on the fully symmetric structure obtained by Schnell et al. showed these states to be degenerate.
Figure 8. Molecular orbitals obtained at the CASSCF level of theory. See the text for a discussion of the lack of degeneracy of equivalent π and molecular orbitals.
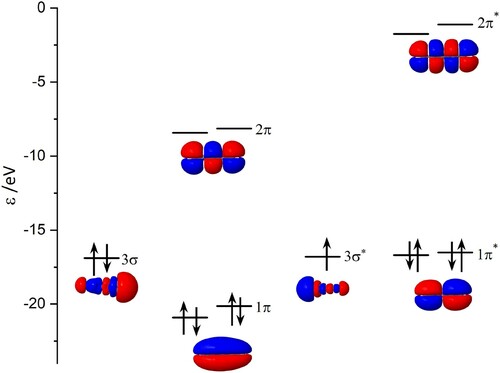
Table 3. Vertical excitation energies of isolated calculated using NEVPT2/SA-CASSCF/cc-pVTZ, based on the minimum-energy geometries optimised with the XMS-CASPT2/CASSCF/cc-pVDZ method.
To provide a deeper theoretical understanding of the observed absorption spectrum, vertical excitation energies including spin-orbit coupling were calculated (see Section 2.2 for details). Unlike the relatively large effect in the anion [Citation17], spin-orbit coupling has a negligible effect on the vertical excitation energies of all the excited states calculated for
. Further calculations were carried out to investigate the Renner-Teller effect on the doubly degenerate
state of linear
. In particular, splitting of the
state is observed along the bending coordinate of the two terminal C-C-C angles, consistent with nuclear motion in the
mode that breaks the linearity of
. The
state splits into
and
components (
symmetry), and a systematic increase in the energy difference (ΔE) between these two along this reaction coordinate is observed, reaching ΔE of
at
. Therefore, the appearance of the two groups of peaks near 19500 and
(see Figure ) may be due to this effect. The results of these calculations can be viewed in the Supplemental Material (Figure S7).
To evaluate the effect of helium tagging on the vertical excitation energy of , rigid potential energy (PE) scans were calculated by varying the distance between the He atom and the
molecules, starting from three different initial arrangements of the
He complex (see Figure and S3 of Supplemental Material). For these scans, distances in the range of 2.5 to
between the He atom and the nearest C atom to it were considered. These scans demonstrate a very flat potential energy surface resulting from a weak interaction between the two subunits. As shown in Figure S3, the location of the minimum also varies between the different positions. The PE scan with the position of the He atom nearest to the central C atom (direction perpendicular to the
molecular axis), exhibits a shallow minimum at approximately
, which is also the shortest minimum-energy distance of the three different scans considered here. This also suggests that the strongest helium-ion interaction is close to the centre of the ion.
The vertical excitation energies in the three directions are presented as a function of distance in Figure in comparison to the isolated ion. The strongest effect of He tagging can be observed for the linear complex, for which a clear batochromic shift is seen, becoming more pronounced for short
He distances. In contrast, for the two non-linear complexes, a very mild effect of He tagging on the excitation energy of the bright state is observed. In particular, when the He atom is located near the centre of one of the terminal C–C bonds, the vertical excitation energy of this state remains nearly unaffected for all the considered distances. When the He atom is placed in near proximity to the central C atom, a very mild hypsochromic shift is seen, which is slightly larger in magnitude at short
He distances. The latter is consistent with the experimental observation of a mild blue-shift of 10 cm
associated with He tagging. It also indicates that the complexes formed in the experiment are likely to be non-linear, with the He atoms residing somewhere near the centre of the molecule. It is worth emphasising that although the calculated energy differences are below the accuracy of the NEVPT2 method, these rigid scans demonstrate qualitative trends and allow evaluation of the direction of the energy shift and the magnitude of the effect, which depend on the location of the He atom. Furthermore, the NEVPT2 results clearly demonstrate that each He atom should have a very subtle effect on the vertical excitation energy of this transition.
5. Conclusions
By combining laser vaporisation synthesis with spectroscopic characterisation in a cryogenic trap, the electronic spectrum of the carbon chain
has been observed. The experimental data are consistent with theoretical results which indicate a linear, symmetric,
structure in the ground electronic state. The pattern of vibronic bands in the observed spectrum is indicative of a geometry change in the excited electronic state. The computational results on the
complex provide an indication of the structure produced in the laboratory. Although the experimental data do not allow
structural information to be obtained directly, calculations show that a mild hypsochromic shift of the
transition is predicted only for complexes in which the He atom is located near the central C atom of
.
The spectra of possessing strong electronic transitions in the visible are sought after in relation to the long-standing enigma of the diffuse interstellar bands. These results add to the very limited experimental data set available on the gas phase electronic transitions of bare carbon cations at temperatures relevant to the interstellar medium [Citation25,Citation40–42]. Moreover, the experimental approaches adopted here pave the way toward obtaining the spectra of larger
structures, including chains, rings, and fullerenes, that may be photostable in interstellar regions exposed to a harsh stellar radiation field where the presence of abundant
has recently been confirmed.
Supplementary Material
Download MS Word (736.9 KB)Acknowledgements
The authors thank Prof. Robert W. Góra for helpful discussions.
Disclosure statement
No potential conflict of interest was reported by the author(s).
Additional information
Funding
Related Research Data
References
- P.F. Bernath, K.H. Hinkle and J.J. Keady, Science 244, 562–564 (1989). doi:https://doi.org/10.1126/science.244.4904.562
- J.R. Heath, A.L. Cooksy, M.H.W. Gruebele, C.A. Schmuttenmaer and R.J. Saykally, Science 244, 564–566 (1989). doi:https://doi.org/10.1126/science.11539817
- N. Moazzen-Ahmadi, A.R.W. McKellar and T. Amano, Chem. Phys. Lett. 157, 1–4 (1989). doi:https://doi.org/10.1016/0009-2614(89)87196-9
- N. Moazzen-Ahmadi, A.R.W. McKellar and T. Amano, J. Chem. Phys. 91, 2140–2147 (1989). doi:https://doi.org/10.1063/1.457073
- H.W. Kroto, Int. Rev. Phys. Chem. 1, 309–376 (1981). doi:https://doi.org/10.1080/01442358109353324
- A.E. Douglas, Nature 269, 130–132 (1977). doi:https://doi.org/10.1038/269130a0
- E.K. Campbell and J.P. Maier, J. Chem. Phys. 146, 160901 (2018). doi:https://doi.org/10.1063/1.4980119
- T. Motylewski, O. Vaizert, T.F. Giesen, H. Linnartz and J.P. Maier, J. Chem. Phys. 111, 6161–6163 (1999). doi:https://doi.org/10.1063/1.479918
- D. Forney, P. Freivogel, M. Grutter and J.P. Maier, J. Chem. Phys. 104, 4954–4960 (1996). doi:https://doi.org/10.1063/1.471127
- A.E. Boguslavskiy and J.P. Maier, J. Chem. Phys. 125, 094308 (2006). doi:https://doi.org/10.1063/1.2276848
- M. Kolbuszewski, J. Chem. Phys. 102, 3679–3684 (1995). doi:https://doi.org/10.1063/1.468598
- M. Hanrath and S.D. Peyerimhoff, Chem. Phys. Lett. 337, 368–374 (2001). doi:https://doi.org/10.1016/S0009-2614(01)00130-0
- J.P. Maier, N.M. Lakin, G.A.H. Walker and D.A. Bohlender, Astrophys. J. 553, 267–273 (2001). doi:https://doi.org/10.1086/apj.2001.553.issue-1
- J.P. Maier, G.A.H. Walker and D.A. Bohlender, Astrophys. J. 566, 332–335 (2002). doi:https://doi.org/10.1086/apj.2002.566.issue-1
- J.P. Maier, G.A.H. Walker and D.A. Bohlender, Astrophys. J. 602, 286–290 (2004). doi:https://doi.org/10.1086/apj.2004.602.issue-1
- G.A. Galazutdinov, F.A. Musaev and J. Krelowski, Mon. Not. R. Astron. Soc. 325, 1332–1334 (2001). doi:https://doi.org/10.1046/j.1365-8711.2001.04388.x
- M.L. Weichman, J.B. Kim and D.M. Neumark, J. Chem. Phys. 139, 144314 (2013). doi:https://doi.org/10.1063/1.4824657
- M.C. Babin, J.A. DeVine, M.L. Weichmana and D.M. Neumark, J. Chem. Phys. 149, 174306 (2018). doi:https://doi.org/10.1063/1.5054792
- D.V. Strelnikov, M. Link, J. Weippert and M.M. Kappes, J. Phys. Chem. A. 123, 5325–5333 (2019). doi:https://doi.org/10.1021/acs.jpca.9b03207
- K. Raghavachari, Phys. D. Atoms Molecules and Cluster 12, 61–64 (1989). doi:https://doi.org/10.1007/BF01426905
- M.G. Giuffreda, M.S. Deleuze and J.P.J. Francois, Phys. Chem. A. 103, 5137–5151 (1999). doi:https://doi.org/10.1021/jp984757c
- M. Schnell, M. Mühlhäuser, G.F. Froudakis and S.D. Peyerimhoff, Chem. Phys. Lett. 340, 559–564 (2001). doi:https://doi.org/10.1016/S0009-2614(01)00392-X
- L. Belau, S.E. Wheeler, B.W. Ticknor, M. Ahmed, S.R. Leone, W.D. Allen, H.F. Schaefer and M.A. Duncan, J. Am. Chem. Soc. 129, 10229–10243 (2007). doi:https://doi.org/10.1021/ja072526q
- E.K. Campbell and P.W. Dunk, Rev. Sci. Instr. 90, 103101 (2019). doi:https://doi.org/10.1063/1.5116925
- E.K. Campbell, M. Holz, D. Gerlich, J.P. Maier, G.A.H. Walker and D. Bohlender, Astrophys. J. 822, 17 (2016). doi:https://doi.org/10.3847/0004-637X/822/1/17
- M.J. Frisch, G.W. Trucks, H.B. Schlegel, G.E. Scuseria, M.A. Robb, J.R. Cheeseman, G. Scalmani, V. Barone, G.A. Petersson, H. Nakatsuji, X. Li, M. Caricato, A. Marenich, J. Bloino, B.G. Janesko, R. Gomperts, B. Mennucci, H.P. Hratchian, J.V. Ortiz, A.F. Izmaylov, J.L. Sonnenberg, D. Williams-Young, F. Ding, F. Lipparini, F. Egidi, J. Goings, B. Peng, A. Petrone, T. Henderson, D. Ranasinghe, V.G. Zakrzewski, J. Gao, N. Rega, G. Zheng, W. Liang, M. Hada, M. Ehara, K. Toyota, R. Fukuda, J. Hasegawa, M. Ishida, T. Nakajima, Y. Honda, O. Kitao, H. Nakai, T. Vreven, K. Throssell, J.A. Montgomery Jr., J.E. Peralta, F. Ogliaro, M. Bearpark, J.J. Heyd, E. Brothers, K.N. Kudin, V.N. Staroverov, T. Keith, R. Kobayashi, J. Normand, K. Raghavachari, A. Rendell, J.C. Burant, S.S. Iyengar, J. Tomasi, M. Cossi, J.M. Millam, M. Klene, C. Adamo, R. Cammi, J.W. Ochterski, R.L. Martin, K. Morokuma, O. Farkas, J.B. Foresman and D.J. Fox, Gaussian 09 Revision D.01 2013, Gaussian Inc. Wallingford CT.
- J.D. Chai and M. Head-Gordon, Phys. Chem. Chem. Phys. 10 (44), 6615–6620 (2008). doi:https://doi.org/10.1039/b810189b
- T.H. Dunning, J. Chem. Phys. 90 (2), 1007–1023 (1989). doi:https://doi.org/10.1063/1.456153
- K. Andersson, P.A. Malmqvist, B.O. Roos, A.J. Sadlej and K. Wolinski, J. Phys. Chem 94 (14), 5483–5488 (1990). doi:https://doi.org/10.1021/j100377a012
- T. Shiozaki, W. Gyrffy, P. Celani and H.J. Werner, J. Chem. Phys 135 (8), 081106 (2011). doi:https://doi.org/10.1063/1.3633329
- T. Shiozaki, Wiley Interdiscip. Rev. Comput. Mol. Sci 8 (1), e1331 (2018). doi:https://doi.org/10.1002/wcms.2018.8.issue-1
- BAGEL, Brilliantly Advanced General Electronic-structure Library, <http://www.nubakery.org>. under the GNU General Public License.
- V. Veryazov, P.Å. Malmqvist and B.O. Roos, Int. J. Quantum Chem. 111 (13), 3329–3338 (2011). doi:https://doi.org/10.1002/qua.23068
- F. Wennmohs, D. Aravena, M. Atanasov, U. Becker, G. Bistoni, D. Bykov, V.G. Chilkuri, D. Datta, A. Kumar Dutta, D. Ganyushin, M. Garcia, Y. Guo, A. Hansen, B. Helmich-Paris, L. Huntington, R. Izsák, C. Kollmar, S. Kossmann, M. Krupička, L. Lang, D. Lenk, D.G. Liakos, D. Manganas, D.A. Pantazis, T. Petrenko, P. Pinski, C. Reimann, M. Retegan, C. Riplinger, T. Risthaus, M. Roemelt, M. Saitow, B. Sandhöfer, I. Schapiro, K. Sivalingam, B. De Souza, G. Stoychev, W. Van Den Heuvel, B. Wezisla, M. Kállay, S. Grimme, E. Valeev, G. Chan, J. Pittner, M. Brehm, L. Goerigk, V. Vilhjálmuråsgeirsson and W. Schneider, ORC A-An ab initio, DFT and semiempirical SCF-MO package-Version 4.2.1 Design and Scientific Directorship: Frank Neese And contributions from our collaborators.
- A.V. Orden and R.J. Saykally, Chem. Rev. 98, 2313–2357 (1998). doi:https://doi.org/10.1021/cr970086n
- J. Fulara, A. Nagy, A. Chakraborty and J.P. Maier, J. Chem. Phys. 144, 244309 (2016). doi:https://doi.org/10.1063/1.4954703
- E.K. Campbell, M. Holz and J.P. Maier, Astrophys. J. Lett. 826, L4 (2016). doi:https://doi.org/10.3847/2041-8205/826/1/L4
- M. Kuhn, M. Renzler, J. Postler, S. Ralser, S. Spieler, M. Simpson, H. Linnartz, A.G.G.M. Tielens, J. Cami, A. Mauracher, Y. Wang, F. Martín, M.K. Beyer, R. Wester, A. Lindinger and P. Scheier, Nature Com. 7, 13550 (2016). doi:https://doi.org/10.1038/ncomms13550
- S. Spieler, M. Kuhn, J. Postler, M. Simpson, R. Wester, P. Scheier, W. Ubachs, X. Bacalla, J. Bouwman and H. Linnartz, Astrophys. J. 846, 168 (2017). doi:https://doi.org/10.3847/1538-4357/aa82bc
- E.K. Campbell, M. Holz, D. Gerlich and J.P. Maier, Nature 523, 322–323 (2015). doi:https://doi.org/10.1038/nature14566
- E.K. Campbell, M. Holz and J.P. Maier, Astrophys. J. 835, 221 (2017). doi:https://doi.org/10.3847/1538-4357/835/2/221
- E.K. Campbell, Mol. Phys. 118, e1797918 (2020). doi:https://doi.org/10.1080/00268976.2020.1797918