
 ?Mathematical formulae have been encoded as MathML and are displayed in this HTML version using MathJax in order to improve their display. Uncheck the box to turn MathJax off. This feature requires Javascript. Click on a formula to zoom.
ABSTRACT
We report the time-resolved observation of the ultrafast dissociation of the 3p Rydberg state manifold of nitromethane, which decays with a time constant of 53 ± 5 fs. We access this manifold using a femtosecond high-harmonic-generation source, allowing us to track the dynamics of high-lying Rydberg states. Combining ultrafast VUV/UV pump-probe ultrafast photoelectron spectroscopy with ab initio non-adiabatic surface-hopping calculations, we find that a major channel of this ultrafast relaxation is NO bond cleavage. In contrast to previous literature, we find that intersystem crossing is not necessary to explain the dynamics, as the multiplicity of the system is retained along the reaction pathway. The photoinduced homolytic fission results in the formation of a nitrosomethane radical, with possible implications for atmospheric chemistry.
GRAPHICAL ABSTRACT
1. Introduction
Nitro-containing organic molecules find use as propellants, explosives, and fuels [Citation1–4]. As a result, they can readily appear within our atmosphere [Citation5–9]. This then creates an impetus to understand their chemical photodynamics upon UV excitation. Previous studies on lower-lying electronic states of nitromethane have found that the primary reaction channel for excitation is the cleavage of the CN bond, resulting in the formation of CH
and NO
, or even a cleavage followed by a new CO bond formation [Citation8,Citation10]. However, the reaction products of higher-lying electronic states are not yet fully understood and, in particular, Rydberg state dynamics have not been studied to date. This is a result of previous limitations of the ultrashort light sources required to access these states. For these kinds of experiments, one needs access to femtosecond VUV pulses, which can be produced through high-harmonic generation. Now that such sources are firmly established, we are able to prepare these higher-lying electronic states and track the novel reactivity that they induce [Citation11–16].
These higher-lying states often involve population of Rydberg orbitals, where the excited electron is in a large, diffuse orbital, surrounding the molecular ion core. Due to this, Rydberg state dynamics may hold interest as molecular analogues to charge transfer states in materials (though also with important differences) [Citation17,Citation18], allowing studies of such states in an interaction-free environment, with a single-molecule approach. This can help determine the fundamental intramolecular photodynamics of certain chemical moieties, extending the concept of functional groups from organic synthesis to photodynamics and functional materials [Citation19]. Additionally, the fact that Rydberg states hold very similar properties to cationic states, means that they can be used to access the reactivity and dynamics of cations (particularly in charge migration and charge transfer processes [Citation18,Citation20–24]), without the need for ultrashort x-ray pulses, making them attractive for tabletop experiments.
The nitro functional group has high synthetic interest owing to its strongly electron-withdrawing character [Citation25–28]. This makes it highly relevant in push-pull systems for directing charge through organic molecules [Citation29–32]. As nitromethane is the prototypical nitro-alkane, it is a good candidate system for Rydberg state photoelectron studies to examine its properties as a dynamophore, i.e. the portion of the molecule which dictates its dynamic behaviour [Citation33]. Similar studies of the lower-lying electronic states of other functional groups have been very successful in building up general pictures for excited-state reactivity, allowing chemical intuition for how excited-state dynamics should proceed to develop, particularly in the case of olefinic cis-trans photoisomerisation [Citation34–37].
Distinguishing high-lying electronic states becomes increasingly difficult as one approaches the ionisation potential, particularly when the pulses involved are ultrashort. The recent availability of VUV absorption data for nitromethane makes this task far simpler and shows that absorption of a single 133 nm photon (9.32 eV, with an estimated full-width at half-maximum from the Fourier limit of 0.07 eV) prepares a broad 3p Rydberg feature [Citation2]. The breadth of this feature is highly interesting, as one would typically expect Rydberg states, at least higher-lying ones, to be sharp and well defined, although there are some features which can be assigned to individual vibronic transitions of the Rydberg state. The broadness of this manifold speaks to the short lifetime one might expect from this manifold of electronic states, which we measure to be 53(5) fs. This broadness, coupled with the suggestion that the decay of this manifold is the result of a photodissociation forming nitrosomethane and an oxygen atom, which according to previous calculations is mediated by intersystem crossing [Citation2], makes this a highly interesting region of the electronic absorption spectrum to study -- particularly with a time-resolved photoelectron experiment. This kind of experiment provides sensitivity to both nuclear and electronic configurations as they change along the reaction pathway.
A key finding of this work is the formation of nitrosomethane, identified by surface-hopping dynamics calculations initiated on the electronic state. This pathway has been proposed as an important channel in the
photodynamics of nitromethane, and has been observed experimentally through mass spectrometry. In the
state, the cleavage of an NO initiates a roaming pathway, allowing for CH
NOO and CH
NO formation as a final product [Citation38,Citation39]. Additionally, reflectron time-of-flight mass spectrometry experiments in nitromethane find significant mass channels that can be attributed to nitrosomethane formation and its further reactions. However, this present work stands apart from previous experimental results, as the availability of VUV sources is highly-limited. We hope that, as the evident value of these sources becomes more widely seen, the availability of different kinds of experimental data in this spectral region increases. Computational work has suggested the formation of nitrosomethane as part of an internal conversion cascade [Citation2,Citation10,Citation38], which could be verified with a VUV-pump-VUV-probe experiment. The novel work contained within this manuscript shows that the internal conversion of the
Rydberg state of nitromethane decays on an ultrafast timescale, with our computational results supporting this timescale, with a reaction path that proceeds through NO bond cleavage.
Here, we present our recent work on the Rydberg state dynamics of nitromethane, prepared by single-photon absorption of 133 nm (9.32 eV) light, and probed by 266 nm (4.66 eV) light. The observed dynamics are a monoexponential decay of the excited-state photoelectron signal, with a decay constant of 53(5) fs. The experimental work is supported by ab initio multireference calculations and non-adiabatic dynamics simulations.
2. Methods
2.1. Experimental methods
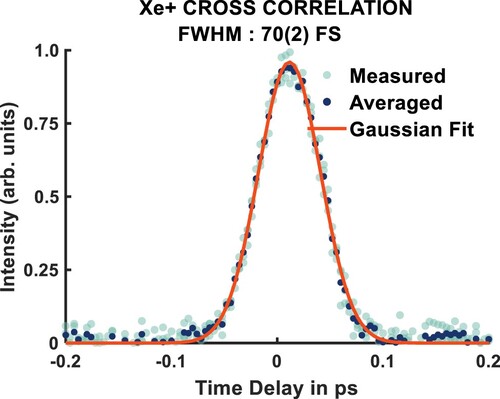
The spectrometer, laser system, and beamline have been characterised and described in detail in previous publications [Citation11,Citation13,Citation40]. Nitromethane (vertical ionisation potential: 11.29 eV) [Citation41] is expanded into the interaction region of our velocity map imaging spectrometer as a molecular beam from a pulsed Even-Lavie nozzle [Citation11,Citation13]. The sample is excited by single 133 nm (9.32 eV) photons and then probed by single 266 nm (4.66 eV) photons, which ionise the electronically excited nitromethane. The laser source for this experiment is a Coherent Legend Elite Duo (output wavelength is 800 nm, compressed to ca. 30 fs, repetition rate of 1 kHz). 1.8 W of the output is used for this experiment, where 70 % is frequency doubled and used to generate the 133 nm photons in a semi-infinite gas cell filled with 10 mbar of xenon through a high-harmonic generation process. The 266 nm light is generated by the remainder of the 800 nm in a third-harmonic generation stage using non-linear crystals. A schematic of the beamline used in this experiment is shown in Figure . The measured cross-corellation for this experiment is shown in Figure , and is fit to a Gaussian distribution, giving a full-width at half-maximum of 70(2) fs.
Figure 1. A schematic of the beamline used for the experiments. 800 nm light is generated by a Coherent Legend Elite Duo (1 kHz, 300 ps), and is compressed to a 30 fs pulse duration. The beam is split by an 80:20 beam splitter (BS), with the transmitted portion being frequency doubled in a β-barium borate crystal which is then used as the driving laser in a semi-infinite gas cell, generating 133 nmlight. The reflected arm passes through a third-harmonic generation (THG) stage to generate 266 nm. These beams are then recombined non-collinearly in a velocity map imaging (VMI) spectrometer.
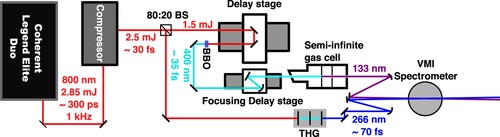
Figure 2. Cross-correlation of 133 nm + 266 nm photoionisation of xenon, returning an instrument response function of 70 2 fs.
2.2. Computational methods
All calculations were carried out using the OpenMolcas program package [Citation42,Citation43]. The minimum energy geometry was optimised at the CASSCF(8,10)/aug-cc-pVTZ level of theory. From this point, the absorption spectrum was calculated at the CASPT2(8,10)/aug-cc-pVTZ level of theory (Table ). Frequencies for optimised stationary points, in addition to one-dimensional, unrelaxed, potential energy curves are calculated at the CASSCF(8,10)/aug-cc-pVTZ level of theory, in addition to the second-order perturbative corrections. The potential energy curve reported is calculated by changing the CN bond distance of the optimised global minimum structure of the electronic ground state. The non-adiabatic dynamics are calculated using a full-dimension surface-hopping approach, implemented as the Dynamix module as part of the OpenMolcas program package [Citation43]. These trajectories are simulated at the CASSCF(8,10)/aug-cc-pVTZ level of theory, with 30 trajectories. The starting velocities of the trajectories were obtained from random velocities selected from a Maxwell–Boltzmann distribution. The dynamics were initiated on the
electronic state, with a timestep of 50 au (1.21 fs).
Table 1. CASSCF and CASPT2 excitation energies (E, in ) and dipole velocity transition oscillator strengths (f). Experimental excitation energies are from references [Citation2,Citation46].
3. Results and discussion
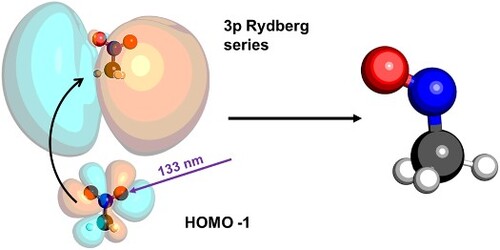
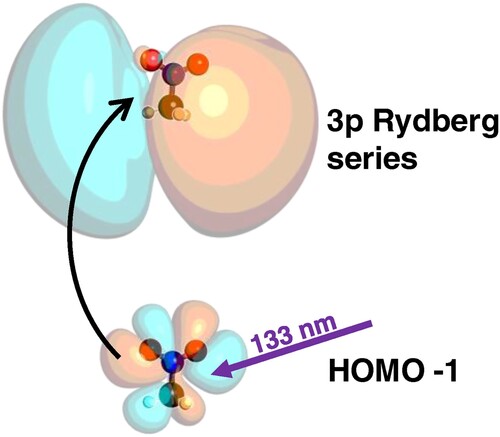
The molecular structure, and key calculated geometric parameters are shown in Figure . The calculated stationary point was verified to be an energy minimum through a frequency calculation to ensure that there were no imaginary frequencies. The optimised geometry is symmetric. Photoexcitation at 133 nm (9.32 eV) initiates a HOMO-1
3p transition, where the photon prepares the
Rydberg state through promotion of an electron from the π HOMO-1 to a
Rydberg orbital. A schematic of this process is shown in Figure . The 3p Rydberg state dynamics are modelled by calculating the non-adiabatic molecular dynamics trajectories at the CASSCF(8,10)/aug-cc-pVTZ level of theory.
Figure 3. Ground electronic state minimum energy nuclear configuration of nitromethane, optimised at the CASSCF(8,10)/aug-cc-pVTZ level of theory.
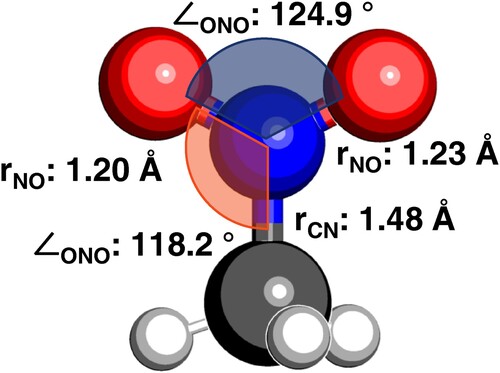
Figure 4. Absorption of a single-photon of 133 nm (9.32 eV) light promotes a single electron from the π HOMO-1 orbital to a 3p Rydberg orbital. This electronically excited state can then be ionised by 266 nm (4.66 eV).
The HOMO-1 orbital is an orbital, and the HOMO orbital is an NO
π orbital. Our calculations and characterisations of the electronic transitions in this energy region show that one of the primary differences between the higher-lying and the lower-lying states within the 3p Rydberg series is the localisation of the hole. For the transition at 9.37 eV, the hole is localised in
. The calculated transitions and their assignments can be found in Table . As one can see, the calculated oscillator strength for the
transition is three orders of magnitude lower than for the
transition we study in this work. Due to this, we do not see an experimental signature of this feature.
The measured VUV absorption spectrum from Shastri et al. [Citation2] is shown in Figure , with a schematic of the energy profile of our excitation pulse shown in green. The structure that one can see in the measured spectrum has been assigned as vibronic structure of the Rydberg state, and the assigned absorption energies are marked with black dashed lines.
Figure 5. The blue plot shows the experimental nitromethane VUV absorption spectrum, digitised from Ref. [Citation2], and the black dashed lines show transitions to the and
, assigned from the same work. The green Gaussian curve shows the Fourier-limited energy profile of the 9.32 eV excitation pulse.
![Figure 5. The blue plot shows the experimental nitromethane VUV absorption spectrum, digitised from Ref. [Citation2], and the black dashed lines show transitions to the n3px and n3py, assigned from the same work. The green Gaussian curve shows the Fourier-limited energy profile of the 9.32 eV excitation pulse.](/cms/asset/285b792e-6373-480e-a676-80c03498c544/tmph_a_2164749_f0005_oc.jpg)
The experimental results are summarised in Figure , where the top panel shows a kinetic fit of the normalised total photoelectron signal integrated in energy. The centre plot shows the time-resolved photoelectron spectrum (TRPES) for the Rydberg state. The most striking thing about this spectrum is that the signal decays so quickly. The kinetic fit gives a monoexponential decay, with a constant of 53(5) fs, implying a single kinetic process, resulting in a product or products that cannot be ionised by 266 nm (4.66 eV). Explicitly, the monoexponential decay is described as:
(1)
(1) where the integrated and normalised time-dependent signal
is fit to a single exponential decay with a given decay time constant
, and amplitude A. This monoexponential decay is convolved with the instrument response function
shown in Figure . Previous computational results have suggested that the decay within this region is the result of intersystem crossing, that then results in a cleavage of an NO bond [Citation2]. Given the rapidity of the decay, this would certainly be a surprising result.
Figure 6. Experimental time-resolved photoelectron spectrum for 3p electronically excited nitromethane with time delays between −100 fs and 600 fs, where negative time delays mean that the 266 nm pulse arrives first. The time steps between −100 fs and 200 fs are in 20 fs increments, and the time steps between 200 fs and 600 fs are in 100 fs increments. The one-dimensional plot shows the total normalised photoelectron signal in time, and the monoexponential kinetic fit of this trace. The decay constant associated with this fit is 53(5) fs.
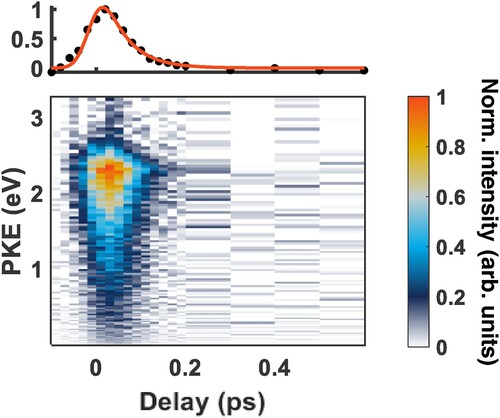
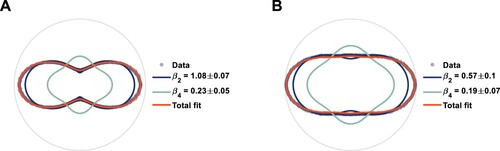
Figure shows the map for the TRPES shown in Figure . As can be seen from the figure, there is no clear difference in anisotropy either in energy or time, but there is a trend of decreasing anisotropy as the PKE degreases. We define a region with greater anisotropy between 1.8 eV and 2.8 eV, and a region that is less anisotropic between 1.8 eV and 0.4 eV and provide fits of the photoelectron angular distribution in Figure . The
value of 1.08 in panel A (higher energy region) is more isotropic, which is consistent with a greater degree of
mixing with the p Rydberg state, while the lower anisotropy of panel B (lower energy region,
) and corresponds to a photoelectron originating from an orbital with a more pure p character [Citation13,Citation44,Citation45].
Figure 7. Experimental time-resolved parameters for 3p
electronically excited nitromethane, corresponding to the time-resolved photoelectron spectrum shown in Figure . The time delays are between −100 fs and 600 fs, where negative time delays mean that the 266 nm pulse arrives first. The time steps between −100 fs and 200 fs are in 20 fs increments, and the time steps between 200 fs and 600 fs are in 100 fs increments.
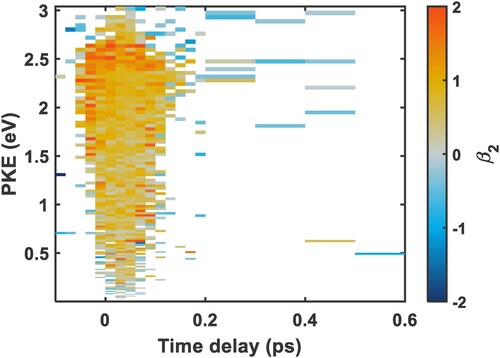
Figure 8. Experimental fits of the parameters for 3p
electronically excited nitromethane at time zero. Panel A shows the photoelectron angular distribution of the more anisotropic region, averaged between 1.8 eV and 2.8 eV, and panel B shows the photoelectron angular distribution of the less anisotropic region, averaged between 0.4 eV and 1.8 eV.
To investigate the role of NO bond cleavage, we simulate the dynamics of the 3p-Rydberg state of nitromethane. We find that three electronic surfaces are involved (the ,
and the
), and that the initial motion that takes the population out of the Franck–Condon motion is a CN stretching motion. This CN stretching motion introduces a significant
character, mediating ultrafast internal conversion to the
state. Interestingly, this is also the mechanism by which 3p Rydberg states relax to 3s Rydberg states in aliphatic amines [Citation47–50]. In these systems, the hole is located in the nitrogen lone pair, and initiates a stretching motion in the CN bond. This stretching motion mediates an internal conversion between the 3p Rydberg state and 3s Rydberg state by mixing
character into the electronic configuration of the 3p Rydberg state. We suggest that in Nitromethane a similar effect is at play, as the hole in this case is primarily localised on the whole NO
moiety.
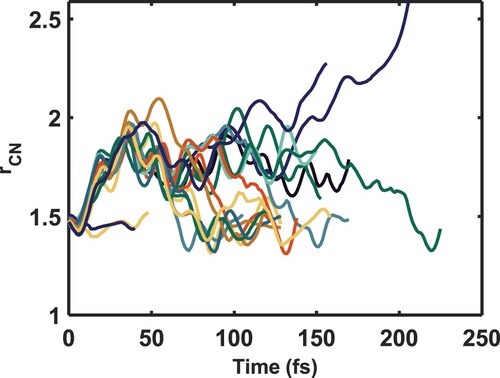
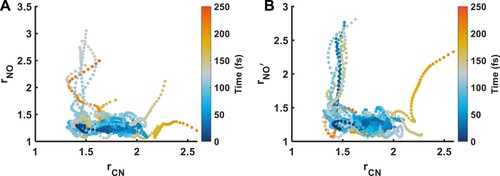
The results of the non-adiabatic dynamics simulations, following the CN stretching motion are shown in Figure , and a summary of the results with the changes of the NO distance and CN distance shown together, are seen in Figure .
Figure 9. CN distances as a function of time from the non-adiabatic molecular dynamics simulations initiated on the electronic state, calculated at the CAS(8,10)/aug-cc-pVTZ level of theory. Before 50 fs, the initial population is largely directed into a CN stretching motion, which allows more
character to mix into the Rydberg state, mediating internal conversion. Upon internal conversion, there is no longer coherent CN motion.
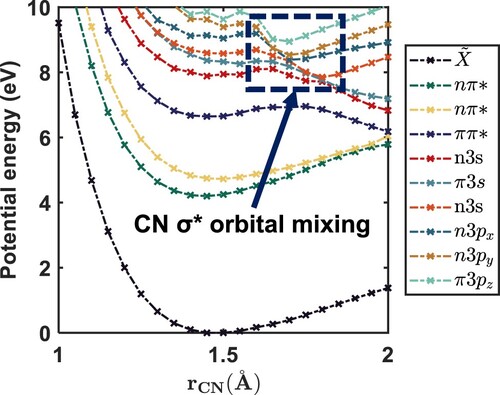
Figure 10. Calculated non-adiabatic dynamics trajectories of -excited nitromethane. The simulation shows that the major decay pathway for this reaction is the cleavage of an NO bond within 100 fs. Panel A shows the CN bond distance versus the synperiplanar NO bond (the left-hand-side NO bond in Figure ), and panel B shows the same but for the antiperiplanar NO bond (the right-hand-side NO bond in Figure ).
Upon internal conversion, mediated by Rydberg-valence mixing, the population then bifurcates: The major channel undergoes another state crossing, cleaving an NO bond, and the minor channel results in cleavage of the CN bond, on significantly longer timescales. Our dynamics simulations agree with previous findings that a major decay channel in this region is NO bond cleavage [Citation2], which we find to occur on a timescale of less than 100 fs, giving a very good agreement with our experimental data. However, we find that the multiplicity of the system is conserved along the reaction path, meaning that intersystem crossing is not necessary to explain the observed dynamics.
The dynamical simulations indicate that, even though the reaction is over within 100 fs, the dynamic motion is surprisingly complex and also quite strongly coherent. This coherence is evident from the experimental ultrashort timescale (indicating that the initially prepared wavepacket is not dispersing through all available degrees of freedom), and from the simulations which show that the reaction coordinate can be well defined by two motions, and the trajectories follow these motions in a repeatable way, which also indicates that this coherence results from the topography of the potential energy landscape. The initial motion that we see is a CN oscillation, taking the CN bond distance to an average of ca. 1.7 Å. This takes the population to a region of high electronic state mixing, allowing the system to cross to a lower-lying singlet state. This is most easily seen from Figure . From here, the population bifurcates into two primary decay channels. The major channel is NO bond cleavage, and the minor channel is CN bond cleavage. The signature of this bifurcation in the dynamics trajectories is most easily seen in Figure , where the trajectories quickly diverge after ca. 50 fs It is conceivable that, with increased time resolution, or higher probe energies, an experimental signature of both channels could be observed. However, the presently observed signal is well described by a monoexponential decay, and the probe-photon energy is too low to directly observe the fragments.
Figure 11. Calculated potential energy curves for the ground electronic state, and the first nine electronically excited states of nitromethane, following unrelaxed CN distance displacement, calculated at the CASPT2(8,10)/aug-cc-pVTZ level of theory.
4. Conclusions
To summarise, the dynamics of the 3p-Rydberg state of nitromethane has been observed using femtosecond XUV-pump UV-probe time-resolved photoelectron spectroscopy. Computationally, these dynamics have been described at the CASSCF(8,10)/aug-cc-pVTZ level of theory, yielding very good agreement between experiment and theory. The excited-state signal from the 3p-Rydberg state region decays on a surprisingly fast timescale, with a decay constant of ca. 53(5) fs. The products of this homolytic dissociation are nitrosomethane and oxygen as a major channel, and CH + NO
as a minor channel. The decay process involves three electronic states, which may be a surprising result for such a fast reaction. However, this reaction is clearly highly coherent, and the motions involved result in strong mixing of valence states with the 3p Rydberg states. The initial population by a single 9.32 eV photon prepares the
Rydberg state, which initiates a CN stretching motion. This motion strongly mixes CN
valence character into the electronic configuration, mediating internal conversion to the
, which then proceeds to the 3s state, resulting in cleavage of the NO bond.
The formation of nitrosomethane through a homolytic fission could have implications for the chemistry of nitromethane in the atmosphere. Nitrosomethane readily decomposes into nitric oxide [Citation51], which means that nitromethane may be a potential radical source in the atmosphere. Additionally, as the dynamics we observe are entirely located on the NO moiety, it would not be surprising if similar organic nitro compounds react in a similar fashion.
With respect to the role of nitro compounds, and their associated Rydberg states in this manifold, within the context of charge transfer and charge migration, there is likely a wealth of information that can be obtained with higher time resolution. This is because the reaction path is quite coherent, and involves a number of electronic states with mixed characters in a very dense manifold. With sufficient time resolution, this would be an ideal candidate molecule to study conical intersection dynamics in a neutral molecule.
Disclosure statement
There are no conflicts of interest to declare.
Additional information
Funding
References
- T. Nelson, J. Bjorgaard, M. Greenfield, C. Bolme, K. Brown, S. McGrane, R.J. Scharff and S. Tretiak, J. Phys. Chem. A 120 (4), 519–526 (2016). doi:10.1021/acs.jpca.5b09776. PMID: 26735907.
- A. Shastri, A.K. Das, K. Sunanda and B.N. Rajasekhar, J. Quant. Spectrosc. Radiat. Transf. 276, 107933 (2021). doi:10.1016/j.jqsrt.2021.107933
- J.W. Kury, R.D. Breithaupt and C.M. Tarver, Shock Waves 9 (4), 227–237 (Aug 1999). doi:10.1007/s001930050160
- I.R. Lewis, N.W. Daniel, Jr and P.R. Griffiths, Appl. Spectrosc. 51 (12), 1854–1867 (Dec 1997). doi:10.1366/0003702971939686
- K. Sekimoto, S. Inomata, H. Tanimoto, A. Fushimi, Y. Fujitani, K. Sato and H. Yamada, Atmos. Environ. (1994) 81, 523–531 (Dec 2013). doi:10.1016/j.atmosenv.2013.09.031
- S. Inomata, Y. Fujitani, A. Fushimi, H. Tanimoto, K. Sekimoto and H. Yamada, Atmos. Environ. (1994) 96, 301–309 (Oct 2014). doi:10.1016/j.atmosenv.2014.07.058
- H. Hakkim, A. Kumar, S. Annadate, B. Sinha and V. Sinha, Atmos. Environ. X 11 (100118), (Oct 2021). doi:10.1016/j.aeaoa.2021.100118.
- O.J. Nielsen and J. Sehested, Atmospheric chemistry of nitrogen-containing species, in Chemical Processes in Atmospheric Oxidation (Springer Berlin Heidelberg, Berlin, Heidelberg, 1997), pp. 170–178.
- S.B. Howerton, J.V. Goodpaster and V.L. McGuffin, Anal. Chim. Acta 459 (1), 61–73 (May 2002). doi:10.1016/S0003-2670(02)00106-X
- S. Adachi, H. Kohguchi and T. Suzuki, J. Phys. Chem. Lett. 9 (2), 270–273 (2018). doi:10.1021/acs.jpclett.7b03032. PMID: 29257692.
- V. Svoboda, N.B. Ram, R. Rajeev and H.J. Wörner, J. Chem. Phys. 146 (8), 084301 (Feb 2017). doi:10.1063/1.4976552
- V. Svoboda, C. Wang, M.D.J. Waters and H.J. Wörner, J. Chem. Phys. 151 (10), 104306 (2019). doi:10.1063/1.5116707
- M.D.J. Waters and H.J. Wörner, Phys. Chem. Chem. Phys 24, 23340–23349 (2022). doi:10.1039/D2CP03117E
- N. Kotsina and D. Townsend, Phys. Chem. Chem. Phys. 23 (18), 10736–10755 (2021). doi:10.1039/D1CP00933H
- R. Forbes, A.E. Boguslavskiy, I. Wilkinson, J.G. Underwood and A. Stolow, J. Chem. Phys. 147 (5), 54305 (2017). doi:10.1063/1.4996461
- T.K. Allison, T.W. Wright, A.M. Stooke, C. Khurmi, J. van Tilborg, Y. Liu, R.W. Falcone and A. Belkacem, Opt. Lett. 35 (21), 3664–3666 (Nov 2010). doi:10.1364/OL.35.003664
- L. Zoppi and K.K. Baldridge, Int. J. Quantum Chem. 118 (1), e25413 (Jan 2018). doi:10.1002/qua.v118.1
- H. Li, B. Mignolet, Z. Wang, K.J. Betsch, K.D. Carnes, I. Ben-Itzhak, C.L. Cocke, F. Remacle and M.F. Kling, J. Phys. Chem. Lett. 7 (22), 4677–4682 (Nov 2016). doi:10.1021/acs.jpclett.6b02139
- J.M. Cox, M. Bain, M. Kellogg, S.E. Bradforth and S.A. Lopez, J. Am. Chem. Soc. 143 (18), 7002–7012 (May 2021). doi:10.1021/jacs.1c01506
- S. Deb, X. Cheng and P.M. Weber, J. Phys. Chem. Lett. 4 (16), 2780–2784 (Aug 2013). doi:10.1021/jz401499q
- J.C. Bush, M.P. Minitti and P.M. Weber, J. Phys. Chem. A 114 (42), 11078–11084 (Oct 2010). doi:10.1021/jp101881x
- P.M. Kraus, B. Mignolet, D. Baykusheva, A. Rupenyan, L. Horný, E.F. Penka, G. Grassi, O.I. Tolstikhin, J. Schneider, F. Jensen, L.B. Madsen, A.D. Bandrauk, F. Remacle and H.J. Wörner, Science 350 (6262), 790–795 (Nov 2015). doi:10.1126/science.aab2160
- H.J. Wörner, C.A. Arrell, N. Banerji, A. Cannizzo, M. Chergui, A.K. Das, P. Hamm, U. Keller, P.M. Kraus, E. Liberatore and P. Lopez-Tarifa, Struct. Dyn. 4 (6), 061508 (2017). doi:10.1063/1.4996505
- D.T. Matselyukh, V. Despré, N.V. Golubev, A.I. Kuleff and H.J. Wörner, Nat. Phys. 18, 1206–1213 (2022). doi:10.1038/s41567-022-01690-0.
- I. Maule, G. Razzetti, A. Restelli, A. Palmieri, C. Colombo and R. Ballini, Org. Process Res. Dev. 25 (4), 781–788 (Apr 2021). doi:10.1021/acs.oprd.0c00433
- R. Ballini and M. Petrini, Tetrahedron 60 (5), 1017–1047 (Jan 2004). doi:10.1016/j.tet.2003.11.016
- R. Ballini, G. Bosica, D. Fiorini, A. Palmieri and M. Petrini, Chem. Rev. 105 (3), 933–972 (Mar 2005). doi:10.1021/cr040602r
- R. Ballini, M. Petrini and G. Rosini, Molecules 13 (2), 319–330 (Feb 2008). doi:10.3390/molecules13020319
- F. Bureš, RSC Adv. 4 (102), 58826–58851 (Oct 2014). doi:10.1039/C4RA11264D
- S. Lee, M. Jen, T. Jang, G. Lee and Y. Pang, Sci. Rep. 12 (1), 6557 (Apr 2022). doi:10.1038/s41598-022-10565-6
- G. Noirbent and F. Dumur, Materials (Basel) 11 (12), 2425 (Nov 2018). doi:10.3390/ma11122425
- M. Muniz-Miranda, F. Muniz-Miranda and A. Pedone, ChemistrySelect 3 (30), 8698–8702 (Aug 2018). doi:10.1002/slct.v3.30
- O. Schalk, A.E. Boguslavskiy, A. Stolow and M.S. Schuurman, J. Am. Chem. Soc. 133 (41), 16451–16458 (Oct 2011). doi:10.1021/ja1114002
- C. Wang, M. Waters, P. Zhang, J. Suchan, V. Svoboda, T.T. Luu, C. Perry, Z. Yin, P. Slavicek and H.J. Wörner, Nat. Chem. 14, 1126–1132 (2022). doi:10.1038/s41557-022-01012-0
- W. Fuß, C. Kosmidis, W.E. Schmid and S.A. Trushin, Chem. Phys. Lett. 385 (5–6), 423–430 (Feb 2004). doi:10.1016/j.cplett.2003.12.114
- B.G. Levine and T.J. Martínez, Annu. Rev. Phys. Chem. 58, 613–634 (2007). doi:10.1146/annurev.physchem.57.032905.104612
- J. Quenneville and T.J. Martínez, J. Phys. Chem. A 107 (6), 829–837 (Feb 2003). doi:10.1021/jp021210w
- M. Isegawa, F. Liu, S. Maeda and K. Morokuma, J. Chem. Phys. 140 (24), 244310 (2014). doi:10.1063/1.4883916
- Y.Q. Guo, A. Bhattacharya and E.R. Bernstein, J. Phys. Chem. A 113 (1), 85–96 (2009). doi:10.1021/jp806230p
- A. von Conta, M. Huppert and H.J. Wörner, Rev. Sci. Instrum. 87 (7), 073102 (2016). doi:10.1063/1.4955263
- T. Kobayashi, K. Yokota and S. Nagakura, Bull. Chem. Soc. Jpn. 48 (2), 412–415 (1975). doi:10.1246/bcsj.48.412
- I.F. Galván, M. Vacher, A. Alavi, C. Angeli, F. Aquilante, J. Autschbach, J.J. Bao, S.I. Bokarev, N.A. Bogdanov, R.K. Carlson, L.F. Chibotaru, J. Creutzberg, N. Dattani, M.G. Delcey, S.S. Dong, A. Dreuw, L. Freitag, L.M. Frutos, L. Gagliardi, F. Gendron, A. Giussani, L. González, G. Grell, M. Guo, C.E. Hoyer, M. Johansson, S. Keller, S. Knecht, G. Kovačević, E. Källman, G.L. Manni, M. Lundberg, Y. Ma, S. Mai, J.P. Malhado, P.Å. Malmqvist, P. Marquetand, S.A. Mewes, J. Norell, M. Olivucci, M. Oppel, Q.M. Phung, K. Pierloot, F. Plasser, M. Reiher, A.M. Sand, I. Schapiro, P. Sharma, C.J. Stein, L.K. Sørensen, D.G. Truhlar, M. Ugandi, L. Ungur, A. Valentini, S. Vancoillie, V. Veryazov, O. Weser, T.A. Wesołowski, P.-O. Widmark, S. Wouters, A. Zech, J.P. Zobel and R. Lindh, J. Chem. Theory Comput. 15 (11), 5925–5964 (Sept 2019). doi:10.1021/acs.jctc.9b00532
- F. Aquilante, J. Autschbach, A. Baiardi, S. Battaglia, V.A. Borin, L.F. Chibotaru, I. Conti, L. De Vico, M. Delcey, I.F. Galván, N. Ferré, L. Freitag, M. Garavelli, X. Gong, S. Knecht, E.D. Larsson, R. Lindh, M. Lundberg, P.Å. Malmqvist, A. Nenov, J. Norell, M. Odelius, M. Olivucci, T.B. Pedersen, L. Pedraza-González, Q.M. Phung, K. Pierloot, M. Reiher, I. Schapiro, J. Segarra-Martí, F. Segatta, L. Seijo, S. Sen, D.-C. Sergentu, C.J. Stein, L. Ungur, M. Vacher, A. Valentini and V. Veryazov, J. Chem. Phys. 152 (21), 214117 (2020). doi:10.1063/5.0004835
- L.B. Klein, T.J. Morsing, R.A. Livingstone, D. Townsend and T.I. Sølling, Phys. Chem. Chem. Phys.18, 9715–9723 (2016). doi:10.1039/C5CP07910A
- G. Wu, P. Hockett and A. Stolow, Phys. Chem. Chem. Phys. 13 (41), 18447 (2011). doi:10.1039/c1cp22031d
- I.C Walker and M.A.D. Fluendy, Int. J. Mass Spectrom. 205 (1–3), 171–182 (Feb 2001). doi:10.1016/S1387-3806(00)00319-5
- M.D.J. Waters, A.B. Skov, M.A.B. Larsen, C.M. Clausen, P.M. Weber and T.I. Sølling, Phys. Chem. Chem. Phys. 21, 2283–2294 (2019). doi:10.1039/C8CP05950K
- M.D.J. Waters, W. Du, A.M. Carrascosa, B. Stankus, M. Cacciarini, P.M. Weber and T.I. Sølling, J. Phys. Chem. Lett. 12 (38), 9220–9225 (Sept 2021). doi:10.1021/acs.jpclett.1c02334
- Y. Zhang, H. Jónsson and P.M. Weber, Phys. Chem. Chem. Phys. 19, 26403–26411 (2017). doi:10.1039/C7CP05244H
- L.B. Klein, J.O.F. Thompson, S.W. Crane, L. Saalbach, T.I. Sølling, M.J. Paterson and D. Townsend, Phys. Chem. Chem. Phys. 18 (36), 25070–25079 (2016). doi:10.1039/C6CP04494H
- J.F. Arenas, J.C. Otero, D. Peláez and J. Soto, J. Org. Chem. 71 (3), 983–991 (Jan 2006). doi:10.1021/jo051897r