
 ?Mathematical formulae have been encoded as MathML and are displayed in this HTML version using MathJax in order to improve their display. Uncheck the box to turn MathJax off. This feature requires Javascript. Click on a formula to zoom.
Abstract
Gas-phase electronic spectra of HO@C
and D
O@C
are presented. These data were obtained by one-photon dissociation of weakly bound helium complexes synthesised in a 3 K ion trap. Measurements were recorded in the vicinity of the
electronic transitions of the C
cage. Two-colour hole burning experiments enabled nuclear spin isomer pure data to be obtained. The spectra are rich in structure with many absorptions attributed to internal excitation of the encapsulated molecule accompanying the C
electronic transition. The experimental data are complemented with density functional theory calculations using the B3LYP functional and 6-31++G** basis set.
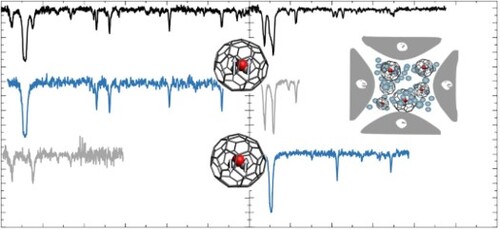
GRAPHICAL ABSTRACT
1. Introduction
Molecular surgery has enabled the synthesis of macroscopic quantities of endohedral C fullerenes that contain small molecules such as H
[Citation1], H
O [Citation2, Citation3], HF [Citation4] and CH
[Citation5]. These developments have allowed experimental investigation into their unique properties. The endohedral of relevance to the present work is H
O@C
. The encapsulated water is an asymmetric top rotor and displays nuclear spin isomerism, with total nuclear spin
or
, referred to as ortho and para, respectively. The ortho isomer is threefold degenerate while para is non-degenerate, resulting in a 3:1 ortho:para ratio in the high-temperature limit. As protons are fermions, the Pauli principle dictates that the overall wave function (
) is antisymmetric with respect to exchange of the two H-nuclei. In the gas phase, ortho and para H
O do not readily interconvert allowing experiments to reveal differences in their chemical reactivity [Citation6].
A consequence of nuclear spin statistics is the connection between the symmetry of rotational () and nuclear spin (
) wavefunctions. The rotations of an asymmetric top are denoted
, where
and
are projections in the prolate and oblate symmetric top limits. In the lowest vibrational level of the ground electronic state of gas-phase water and H
O@C
[Citation7–9], the ortho nuclear spin isomer is associated with
odd levels and para with
even. These combinations can switch if the symmetry of one of the other contributing parts of the total wavefunction is changed, which happens, for example, when odd quanta of the asymmetric stretching mode of H
O are excited [Citation7] and upon ionisation to the ground state of H
O
[Citation10].
Rotational transitions of the encapsulated HO in H
O@C
have been observed with IR [Citation7], THz spectroscopy [Citation11, Citation12] and inelastic neutron scattering [Citation8, Citation9]. The experimental results resemble the rotational pattern of free H
O but the surrounding cage affected the rotational constants of H
O [Citation7]. Furthermore, in the solid phase, the degeneracy of the rotational
ortho ground state of H
O is lifted due to crystal field effects [Citation8, Citation9, Citation13, Citation14]. By observing the intensity change of the rotational transitions in the condensed phase it was possible to show that slow spin forbidden ortho
para interconversion takes place and to assign the transitions to the different spin isomers [Citation7, Citation8]. A change in dielectric constant was also observed upon ortho–para conversion [Citation15]. The decreased intensity of transitions originating from
was confirmed by a loss of NMR signal, because of the NMR-inactivity of the para spin isomer [Citation15, Citation16].
The carbon cage resembles a spherical potential around HO which is subject to strong quantum effects [Citation17, Citation18]. For example, the confinement is responsible for the quantisation of H
O translational modes [Citation7, Citation11, Citation12]. Additionally, computational work [Citation19] predicts frustrated vibrations and rotations, which are yet to be observed in experiments. However, there are features observed in THz spectroscopy [Citation11] attributed to hot bands based on temperature-dependent experiments [Citation12] but these remain unassigned to particular translational or rotational motions. The dipole moment of the H
O molecule is also shielded significantly by the C
surrounding [Citation15, Citation19, Citation20].
The influence of HO on the cage has also been studied [Citation21, Citation22] and the UV-Vis spectrum of H
O@C
showed negligible difference to the electronic transition(s) of the empty cage in solution [Citation2].
C NMR studies of the endohedral showed no reduced symmetry of the cage in H
O@C
[Citation23]. However, the singly charged cation H
O@C
has not been thoroughly investigated yet. As C
is an open shell system, it is expected to show more significant interactions between the encapsulated molecule and the surrounding carbon cage. In this contribution, gas-phase electronic spectra of H
O@C
are presented and contrasted to that of C
[Citation24]. The data were obtained using He tagging at cryogenic temperatures. The contributions of para and ortho H
O are separated by two-colour hole burning experiments. The assignment of features in the spectra is supported by DFT calculations.
Sections 2 and 3 describe the experimental and computational methods employed, respectively. Section 4 contains the electronic spectra of HO@C
and D
O@C
and a discussion of the observed transitions along with their proposed assignments, while conclusions are given in Section 5.
2. Experimental
The HO@C
sample was synthesised following a synthetic route known as ‘molecular surgery’ [Citation2, Citation3]. A few mg of
filled H
O@C
(D
O@C
) were heated in an oven to
C. Singly charged parent ions were produced from the neutral gas using electron impact at 40 eV. The experiments were carried out using the apparatus described in detail in Refs. [Citation25, Citation26], and only the parameters specific to the present work are given here.
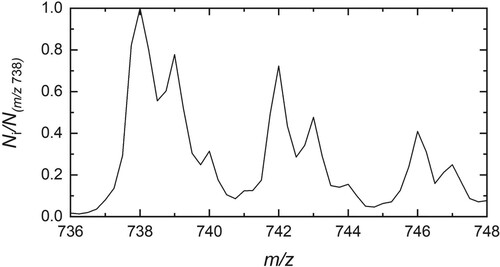
In ion trapping experiments, species with m/z below 738 (740) were removed using the first quadrupole mass spectrometer. The nominal trap temperature was 4 K and the He buffer gas number density was 10 cm
. These low trap temperatures and high He number densities, coupled with long interaction times (several hundred ms), allow H
O@C
−He
(D
O@C
−He
) complexes to form, which can be seen in Figure . For example, to generate the spectrum in Figure , H
O@C
cations were loaded into the trap for 200 ms by lowering the potential applied to the axial entrance electrode. During the first 500 ms they interact with helium buffer gas, which was subsequently pumped out for 420 ms before the trap contents were extracted and analysed by the second quadrupole mass spectrometer. The trapping process was repeated at a repetition rate of 1 Hz.
Figure 1. Mass spectrum recorded after storage of HO@C
in helium buffer gas at 4 K.
Photofragmentation spectra of HO@C
−He (D
O@C
−He) were recorded by irradiation of the ion cloud with a continuous wave Ti:Sap laser for 30 ms at the end of the trapping cycle. The irradiation time was controlled by use of a mechanical shutter. The mass-channel of the H
O@C
−He (D
O@C
−He) complexes with m/z = 742 (744) is monitored on alternating cycles with (
) and without (
) exposure to the radiation to obtain the depletion of complexes as a function of the laser frequency and account for fluctuations in the number of stored ions. For the two-colour experiments, a second near-infrared CW laser (diode) was used to continuously irradiate the ions during the entire trapping cycle at a fixed (resonant) frequency. This enabled the depletion of ions belonging to one nuclear spin isomer. In this case, the number of H
O@C
−He
(D
O@C
−He
) complexes remaining in the trap following exposure to both (
) lasers or only the diode laser (
) were monitored to reveal nuclear spin isomer pure spectra.
3. Computational
The equilibrium structure of HO@C
was determined with density functional theory in the unrestricted formalism, using the B3LYP functional and the 6-31++G** basis set. The B3LYP functional was selected for these calculations owing to its generally good performance for large conjugated systems and specifically because it was previously employed to study C
[Citation27], in conjunction with its generally smaller spin contamination compared to hybrid functionals with larger contributions of HF exchange [Citation28]. In addition, weak dispersion-like intra- and inter-molecular noncovalent interactions were included via the D3(BJ) correction term [Citation29–31]. An integral accuracy cutoff of 10
in combination with an ultrafine integration grid were requested during the Hessian calculations. Geometry optimisation and vibrational frequency calculations were carried out using the Gaussian16 suite of programs [Citation32]. Gaussian16 evaluates the molecular Hessian in Cartesian coordinates, and the vibrational frequencies of any isotopically substituted species may therefore easily be obtained on the basis of the full Hessian by changing the atomic masses. The vibrational frequencies for D
O@C
were then correlated with those of H
O@C
by computing the Duschinsky rotation matrix for the two sets of vibrational normal modes [Citation33]. The optimised geometry displayed a modest spin contamination, with a final value of S
resulting in 0.7539. The nature of the stationary point was assessed by vibrational frequency calculations that resulted to be all real. The final H
O@C
structure has no symmetry elements and is slightly distorted from
, with the two OH bond lengths being 0.965 and
and the HOH angle measuring
.
4. Results and discussion
4.1. Electronic spectrum of H O@C: comparison with C
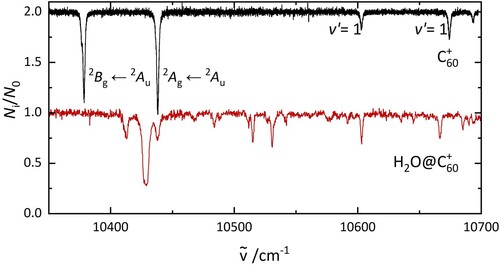
The gas-phase electronic spectrum of C below 10 K is presented in Figure in comparison to that of H
O@C
. The former shows two intense bands at 10,378 and 10,438 cm
and two weaker absorptions at 10,603 and 10,674 cm
. The two intense features were assigned to the origin bands of the
B
A
and
A
A
electronic transitions of C
based on calculations, which predicted a Jahn–Teller distortion of the C
cage [Citation27]. The lowest energy vibrational mode (∼230 cm
) of C
in the
B
and
A
states causes the bands at 10,603 and 10,674 cm
. Comparison of the electronic spectra shown in Figure suggests that only one electronic transition is observed in the H
O@C
spectrum instead of the two observed for C
. The strongest absorption feature of H
O@C
appears at 10,429 cm
, which lies between the two C
origin bands.
Figure 2. The electronic spectrum of C (top) and H
O@C
(bottom), recorded under the same laboratory conditions. The data are photofragmentation spectra of C
−He and H
O@C
−He complexes.
Additionally, the HO@C
spectrum shows several less prominent features with varying intensities close to 10,429 cm
. The energy separation between the observed bands with respect to the strongest absorption is between 9 and 250 cm
. Most of these fall below the lowest frequency cage vibration and are also too low in energy to be associated with vibrational modes of (free) H
O. However, these energy separations are suggestive of rotational levels of gas-phase H
O or translational modes associated with confinement in the cage, which were observed in H
O@C
[Citation7]. These features of the H
O@C
spectrum indicate that excitations of the encapsulated H
O molecule may accompany the electronic transition of the C
cage. The calculations reported here indicate that similar energy separations to those observed in the experimental spectrum are expected for vibrational and translational modes of H
O in the ground electronic state of H
O@C
, as presented in Table .
Table 1. Vibrational and translational modes obtained from calculations.
Note that although these experiments are carried out on weakly bound HO@C
−He complexes, the exohedral helium is expected to be a minor perturbation to the electronic transitions of H
O@C
, as was the case for C
(see supplementary information). The following discussion and assignment of the rich spectrum is made on this basis and the assumption that the exohedral, weakly bound, helium atom does not affect the symmetry of
.
4.2. Ortho/para ratio
More information on the cause of the band pattern can be gained by observations of the absolute number of complexes depleted following irradiation on resonance because the broad width of the 10,429 cm band in the electronic spectrum shown in Figure indicates saturation. Even with a high laser fluence, a significant number of complexes remained in the trap after irradiating them at 10,438 cm
, as indicated in Figure . It was observed that the number of remaining ions varied depending on the particular transition excited.
Figure 3. Number of HO@C
−He complexes (N
) as a function of laser fluence upon irradiation at 10,438 cm
. Without exposure to laser radiation, 1100±60 ions with m/z = 742 were in the trap. 800±30 complexes remain after irradiation, corresponding to 73±5% of the population.
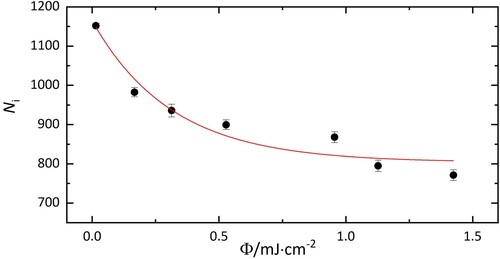
The conversion between nuclear spin states is forbidden and takes several hours in the condensed phase [Citation8, Citation16]. In our gas phase experiment, the high spin temperature ortho/para ratio is expected to be conserved. This is consistent with the data shown in Figure , where 73±5% ions do not interact with the laser at 10,438 cm. The 27±5% that absorb at this energy are therefore attributed to para H
O@C
.
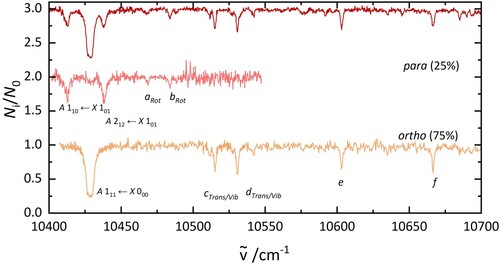
4.3. Separation of ortho and para nuclear spin isomers by 2 colour experiments
As it was possible to remove one group of nuclear spin isomers from the trap, a two-colour setup was used to record nuclear spin isomer pure electronic spectra. These are presented in Figure . The spectra were assigned to ortho and para based on the fraction of ions that were depleted. The ortho spectrum shows one intense transition at 10,429 cm, two bands at 10,515 and 10,530 cm
, one band at 10,603 cm
, and one more at 10,666 cm
. Four bands of para H
O@C
were observed, all at energies below 10,500 cm
.
Figure 4. Electronic spectra of HO@C
(top), p-H
O@C
(middle), and o-H
O@C
(bottom). The lower two traces were obtained in 2 colour experiments. The middle spectrum was recorded by fragmenting all complexes that absorb at 10,429 cm
. The bottom spectrum was recorded after irradiation at 10,438 cm
.
4.4. Assignment of the absorption features
To allow assignment of the bands in the spectrum, the energy differences between the band at 10,429 cm and the others are compared to the rotational energy levels of free water. The three transitions from the ortho and para rotational ground state are
,
and
. The energy separation between these transitions resembles the pattern observed for H
O@C
, as shown in Figure . Alternative explanations involving hot bands or Q-branch transitions were explored but do not agree with the observed energy separations.
Figure 5. PGopher simulations of the rotational pattern of an electronic transition of HO. The details of the simulations are explained in the text. The middle trace uses the parameters based on a geometry optimisation (B3LYP/6-31++G**) while the upper one shows a fit involving a geometry change of H
O between ground and excited state.
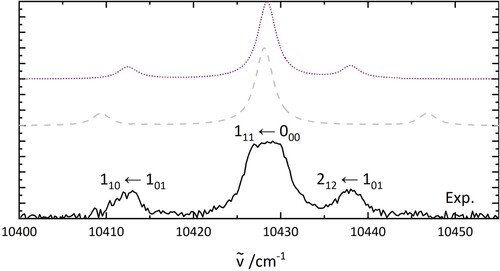
To aid the assignment, simulations of HO electronic transitions have been carried out using H
O rotational constants provided by calculations on H
O@C
. These simulations, which ignore any effects of the C
cage, have been carried out using PGopher software [Citation34] in C
symmetry. Based on the observed nuclear spin isomer ratios, the spin temperature was set to 300 K (high-temperature limit). B
electronic symmetry in the ground and excited electronic state resulted in an intensity pattern in agreement with the experiments. A rotational temperature of 5 K and full width half maximum (FWHM) of 2.5 cm
were used. The
energy was chosen in order to match the
transition to the 10,429 cm
band of the experimental spectrum. Figure shows the resemblance of the three lowest energy bands in H
O@C
with the simulated spectrum using rotational levels of free H
O (middle trace). While these results are in qualitative agreement, they can be improved when a geometry change between the ground and excited state is considered.
A simulated electronic spectrum involving a geometry change of HO between the ground and excited state is shown in the upper trace of Figure . The rotational constant
of the excited state can be derived directly from the experimental spectrum [Citation35]. Furthermore, the fitting capability of the PGopher software was used to extract the rotational constant
for the excited state, and the
energy. This fit used the calculated constants of H
O in H
O@C
in the ground states as inputs, together with
. The constants used to obtain Figure are listed in Table .
Table 2. Rotational constants used for the simulation in Figure .
The proposed assignment indicated in Figure , with the 10,429 cm absorption originating from the
level, coupled with the observation that the associated nuclear spin isomer is responsible for 75% of the total population, implies that even
are ortho in H
O@C
(or H
O@C
−He). This differs from H
O@C
, where even
rotational functions are associated with the para nuclear spin isomer, suggesting that the H
O@C
(or H
O@C
−He) electronic wave function is antisymmetric. This interpretation is reached because the Pauli principle requires the overall wavefunction to be antisymmetric with respect to exchange of the two H-nuclei. As the transition does not originate from a vibrationally excited level,
is the contributor to
that differs between H
O and H
O@C
(H
O@C
−He) for the same rotational and nuclear spin states.
There are several possibilities for assignment of the bands to a higher energy than the three shown in Figure . For example, the constants derived from the simulation lead to a near coincidence in energy for the 10,484 cm (b) absorption with an
transition (10,483 cm
) or the 10,469 cm
(a) absorption, when the A rotational constant changes by
between ground and excited state, which is observed for the other rotational constants. This hot band transition, however, is ruled out due to the absence of absorption to lower energy than 10,396 cm
which would be expected to be observed for the
transition. Therefore it appears that H
O inside the C
cage is rotationally cold in our experiment.
Band b is also close to the predicted (10,482 cm
) and
transition (10,500 cm
). The latter transition depends on
and could also appear at 10,484 cm
if the value for
varies in a reasonable %-range after electronic excitation (i.e. comparable to the other rotational constants). Here the value for the excited state rotational constant would be 22 cm
with a 10,400 cm
energy, which is similar to the constants for the excited vibrational level in neutral H
O@C
(23.15 cm
) [Citation7]. A change of
would require a slight adjustment of the origin energy to maintain the agreement in energy with the previously assigned bands, but would otherwise not influence the shape of the spectrum. However, the
transition is not a dipole-allowed transition of asymmetric top rotors and the
has
.
The and
transitions are also in the same energy region and are expected to have an energy of 10,489 and 10,460 cm
if
= 22 cm
. These are a and c-type transitions, respectively, while all the other assigned features are b-type. A component of the transition dipole along these axes would be required for such nuclear spin forbidden features.
The only transition below 10,500 cm in the spectrum of ortho-H
O@C
is assigned to
. The higher energy bands c and d at 10,515 and 10,531 cm
lie 119 and 135 cm
from the predicted
energy. Previous DFT calculations [Citation19] at the PBEO/6-311++G** level of theory indicated that frustrated vibrations and translations of water inside neutral C
could be observed. In DFT (B3LYP/6-311++G**) calculations of the charged H
O@C
system, three translational modes between 125 and 128 cm
and three frustrated vibrational modes (34, 101 and 111 cm
) were found in the electronic ground state. Therefore the bands c and d are consistent with the excitation of either a frustrated vibrational mode or with translations that are quantised due to the spacial confinement. Translations have also been observed experimentally at 110 cm
in H
O@C
[Citation7], which is similar to the energy inferred here. Based on these computational results, it seems plausible that the bands c and d could be due to either quantised translations or frustrated vibrations.
The 10,603 and 10667 cm absorptions, e and f, have an energy separation of 206 and 270 cm
from
, which is close to the ∼230cm
energy of the C
cage vibration. The ∼270 cm
energy separation of absorption f also corresponds to twice the energy separation of band d with respect to the
energy. These two bands could therefore be caused by the excitation of two quanta of the same vibration or translation. A summary of the potential assignments is given in Table .
Table 3. Absorption energies and proposed assignment of bands in the HO@C
and D
O@C
spectra.
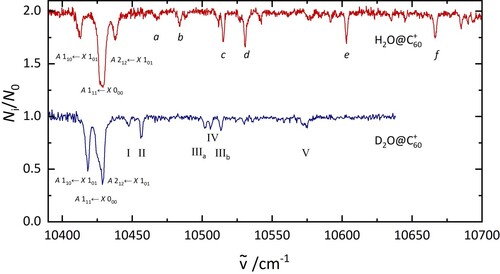
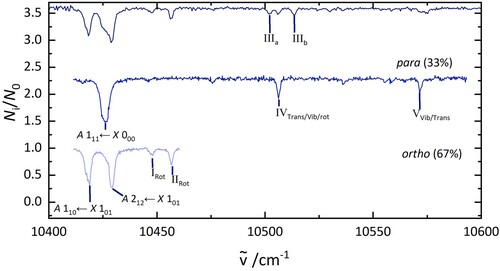
4.5. Electronic spectrum of DO@C: comparison with HO@C
Further experiments on DO@C
were performed to support the assignments of the bands in the H
O@C
electronic spectrum. Figure shows the spectrum of D
O@C
recorded under similar conditions to those used for H
O@C
. The intensity pattern of the bands is significantly different from the observations in H
O@C
, and the energy separations between the bands are smaller as expected due to the isotope effect. After irradiation at 10,418 cm
, 37±3% of the complexes remain in the trap while at 10,425 cm
, 63±3% of the complexes remain. These values correspond well to the 2:1 o/p ratio of D
O observed in the high-temperature limit, as expected from the H
O@C
experiment.
Figure 6. A comparison of the electronic spectrum of HO@C
(top) and D
O@C
(bottom) recorded under similar laboratory conditions. The labels are discussed in the text.
Substitution of H with D in HO@C
affects vibrations, rotations and translations of the encapsulated molecule differently. In D
O an energy of
of the same H
O vibrational mode would be expected. The rotational constants of D
O are lower than those of H
O by about a factor of 2, if both molecules have the same geometry. In translations, motion of the whole molecule in the constrained environment is involved, and the effect of the isotope substitution is less severe. Translations of D
O would have
times the energy of those of H
O [Citation36].
4.6. Confirmation of assignment(s) based on isotope effect
To confirm the assignment of the lowest energy rotational transitions in HO@C
, the same rotational transitions were simulated for D
O@C
. The results are shown in Figure and the constants are listed in Table . Values of the rotational constants in the ground state were
of those used for the simulation of H
O, and the
energy was changed accordingly. The excited state rotational constants were obtained from PGopher fits. The good agreement between the simulation and the experimental results appears to support the previous assignment of the rotational transitions in H
O@C
. Two-colour spectra of D
O@C
are shown in Figure .
Figure 7. PGopher simulations of the rotational pattern of an electronic transition of DO in comparison with the experimental results on D
O@C
(bottom). The rotational constants for the simulation are derived as described in the text.
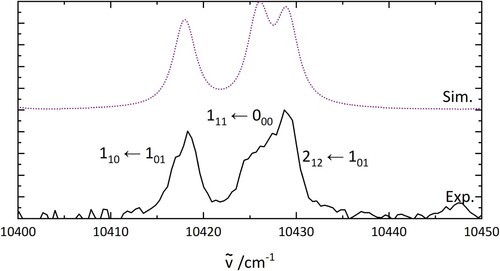
Figure 8. Electronic spectra of DO@C
(top), para-D
O@C
(middle), and ortho-D
O@C
(bottom). The middle trace was recorded by fragmenting all complexes that absorb at 10,418 cm
and the bottom trace was recorded by irradiating at 10,426 cm
.
The simulation has some further implications for the interpretation of the spectra and the structure of the two molecules. The experimentally derived of the excited state of D
O@C
has a value of 2.7 cm
. This is smaller than the 3.2 cm
which would be expected from
. This indicates that the geometries of H
O@C
and D
O@C
are slightly different or that centrifugal distortion also contributes.
Another consequence of the simulation is that the energy varies between the different isotopologues. Based on the assignments it is possible to estimate the energy for
. This energy (10,409 cm
) is around 13 cm
higher than the estimated
of H
O@C
at 10,396 cm
. It is assumed that differences in zero-point energies cause the blue shift of the
energy of D
O@C
with respect to H
O@C
.
Based on the energy separations between the calculated energy and the other bands in H
O@C
, the corresponding rotation, translation and vibrational modes expected to be seen in measurements on D
O@C
could be estimated. The prediction can be compared to the experimental spectrum, to identify bands associated with translational, vibrational or rotational excitation.
In HO@C
, the bands marked as a and b lie 74 and 89 cm
from
. When dividing these energy separations by two and adding these values to the
transition of D
O@C
, the corresponding rotational levels in D
O@C
are predicted at 10,444 and 10,452 cm
. The two observed bands at 10,447 and 10,453 cm
in D
O@C
indicate that the bands at a and b are caused by rotational transitions of the encapsulated H
O molecule and, based on the isomer separation, that these transitions are excited from the
rotational level. As described for H
O@C
, several forbidden rotational transitions are in a similar energy range, as presented in Table , but it can not be concluded which of these transitions is observed. However, it can be ruled out that these bands are due to translations or vibrations based on the predictions for D
O@C
.
Bands c and d are observed in the spectrum of the ortho isomer of HO@C
. Rotational transitions are excluded from the possible explanations because there are no corresponding bands in D
O@C
. However, predicted translational (10,521 and 10,535 cm
) and vibrational transitions (10,493 and 10,503 cm
), present two options for assignment. Bands III
and III
in D
O@C
are in a similar energy range but are not observed, as expected, in the para spectrum of D
O@C
. On the other hand band IV at 10,506 cm
is a close match to the predicted vibration at 10,504 cm
of para-D
O@C
(band d in H
O@C
).
Considering the isotope effect for band e, the equivalent vibration in DO@C
would show at 10,555 cm
and the rotation at 10,513 cm
. The predicted vibration is 15 cm
lower than the observed band V and the rotation is also close to band IV in D
O@C
, so it cannot be unambiguously assigned.
In the HO@C
electronic spectrum the band f at 10,666 cm
is close to the energy expected for the C
-cage vibration. The measurement for D
O@C
only covered an energy range up to 10,650 cm
. If this band is caused by a vibrational mode of the C
cage the effect of the isotopes would be minimal and then it would show at similar energies for both isotopologues when including the blue shift of the
energy for D
O@C
.
A summary of the above assignment discussion is presented in Table . The three lowest energy bands along with a and b can be classified as rotational transitions. The three bands in DO@C
III
, IV and III
are only separated by a few wavenumbers and it is therefore difficult to assign them with certainty. Especially because band III
and III
of D
O@C
do not correspond to bands with the same rovibronic symmetry in H
O@C
, they could also be caused by transitions not observed in H
O@C
.
5. Conclusion
Electronic spectra of HO@C
and D
O@C
were recorded in the gas phase at temperatures below
in the vicinity of the near-IR C
electronic transitions by photodissociation of weakly bound He complexes. Two-colour experiments allowed the removal of one nuclear spin isomer from the trap, allowing spin isomer pure spectra of these species to be obtained. The ortho/para ratio determined spectroscopically agrees with the high-temperature limit. The rich spectra obtained include contributions assigned to rotational excitation of the encapsulated H
O (D
O) molecules that appear to be relaxed to their ground states by buffer gas cooling in the trap. In contrast to C
, only one of the two expected electronic transitions in this region was observed for the endohedral cations.
While not all of the observed spectral features have been assigned, the comparison of DO@C
and H
O@C
spectra make it possible to exclude certain explanations and narrow down the possible assignments. For example, the isotope effect shows that there are more rotational transitions observed than the three allowed transitions from the rotational ground state of H
O (D
O). The results also imply that some of these bands could be caused by frustrated vibrational modes of the encapsulated molecule, which are yet to be observed in experiments on H
O@C
or H
O@C
.
Supplemental Material
Download MS Word (2.5 MB)Disclosure statement
No potential conflict of interest was reported by the author(s).
Additional information
Funding
References
- K. Komatsu, M. Murata and Y. Murata, Science 307, 238 (2005). doi:10.1126/science.1106185
- K. Kurotobi and Y. Murata, Science 333, 613 (2011). doi:10.1126/science.1206376
- A. Krachmalnicoff, M.H. Levitt and R.J. Whitby, Chem. Commun. 50, 13037 (2014). doi:10.1039/C4CC06198E
- A. Krachmalnicoff, R. Bounds, S. Mamone, S. Alom, M. Concistrè, B. Meier, K. Kouřil, M.E. Light, M.R. Johnson, S. Rols, A.J. Horsewill, A. Shugai, U. Nagel, T. Rõõm, M. Carravetta, M.H. Levitt and R.J. Whitby, Nat. Chem. 8, 953 (2016). doi:10.1038/nchem.2563
- S. Bloodworth, G. Sitinova, S. Alom, S. Vidal, G.R. Bacanu, S.J. Elliott, M.E. Light, J.M. Herniman, G.J. Langley, M.H. Levitt and R.J. Whitby, Angew. Chem. Int. Ed. 58, 5038 (2019). doi:10.1002/anie.201900983
- A. Kilaj, H. Gao, D. Rösch, U. Rivero, J. Küpper and S. Willitsch, Nat. Commun. 9, 2096 (2018). doi:10.1038/s41467-018-04483-3
- A. Shugai, U. Nagel, Y. Murata, Y. Li, S. Mamone, A. Krachmalnicoff, S. Alom, R.J. Whitby, M.H. Levitt and T. Rõõm, J. Chem. Phys. 154, 124311 (2021). doi:10.1063/5.0047350
- C. Beduz, M. Carravetta, J.Y.C. Chen, M. Concistrè, M. Denning, M. Frunzi, A.J. Horsewill, O.G. Johannessen, R. Lawler, X. Lei, M.H. Levitt, Y. Li, S. Mamone, Y. Murata, U. Nagel, T. Nishida, J. Ollivier, S. Rols, T. Rõõm, R. Sarkar, N.J. Turro and Y. Yang, Proc. Natl. Acad. Sci. U.S.A.109, 12894 (2012). doi:10.1073/pnas.1210790109
- K.S.K. Goh, M. Jiménez-Ruiz, M.R. Johnson, S. Rols, J. Ollivier, M.S. Denning, S. Mamone, M.H. Levitt, X. Lei, Y. Li, N.J. Turro, Y. Murata and A.J. Horsewill, Phys. Chem. Chem. Phys. 16, 21330 (2014). doi:10.1039/C4CP03272A
- T.R. Huet, C.J. Pursell, W.C. Ho, B.M. Dinelli and T. Oka, J. Chem. Phys. 97, 5977 (1992). doi:10.1063/1.463735
- S.S. Zhukov, V. Balos, G. Hoffman, S. Alom, M. Belyanchikov, M. Nebioglu, S. Roh, A. Pronin, G.R. Bacanu, P. Abramov, M. Wolf, M. Dressel, M.H. Levitt, R.J. Whitby, B. Gorshunov and M. Sajadi, Sci. Rep. 10, 18329 (2020). doi:10.1038/s41598-020-74972-3
- A. Melentev, S. Zhukov, V. Balos, G. Hoffman, S. Alom, M. Belyanchikov, E. Zhukova, M. Dressel, G.R. Bacanu, P. Abramov, M.H. Levitt, R. Whitby, B. Gorshunov and M. Sajadi, J. Phys. Conf. Ser. 1984, 012012 (2021). doi:10.1088/1742-6596/1984/1/012012
- P.M. Felker, V. Vlček, I. Hietanen, S. Fitzgerald, D. Neuhauser and Z. Bačić, Phys. Chem. Chem. Phys. 19, 31274 (2017). doi:10.1039/C7CP06062A
- O. Carrillo-Bohórquez, A. Valdés and R. Prosmiti, Chem. Phys. Chem. 23, e202200034 (2022). doi:10.1002/cphc.202200034
- B. Meier, S. Mamone, M. Concistrè, J. Alonso-Valdesueiro, A. Krachmalnicoff, R.J. Whitby and M.H. Levitt, Nat. Commun. 6, 1 (2015). doi:10.1038/ncomms9112
- S. Mamone, M. Concistrè, E. Carignani, B. Meier, A. Krachmalnicoff, O.G. Johannessen, X. Lei, Y. Li, M. Denning, M. Carravetta, K. Goh, A.J. Horsewill, R.J. Whitby and M.H. Levitt, J. Chem. Phys. 140, 194306 (2014). doi:10.1063/1.4873343
- M.H. Levitt, Philos. Trans. A Math. Phys. Eng. Sci. 371, 20130124 (2013). doi:10.1098/rsta.2012.0429
- Z. Bačić, V. Vlček, D. Neuhauser and P.M. Felker, Faraday Discuss. 212, 547 (2018). doi:10.1039/C8FD00082D
- A. Varadwaj and P.R. Varadwaj, Chem. Eur. J. 18, 15345 (2012). doi:10.1002/chem.201200969
- B. Ensing, F. Costanzo and P.L. Silvestrelli, J. Phys. Chem. A 116, 12184 (2012). doi:10.1021/jp311161q
- S.P. Jarvis, H. Sang, F. Junqueira, O. Gordon, J.E.A. Hodgkinson, A. Saywell, P. Rahe, S. Mamone, S. Taylor, A. Sweetman, J. Leaf, D.A. Duncan, T.L. Lee, P.K. Thakur, G. Hoffman, R.J. Whitby, M.H. Levitt, G. Held, L. Kantorovich, P. Moriarty and R.G. Jones, Commun. Chem. 4, 135 (2021). doi:10.1038/s42004-021-00569-0
- S.J. Elliott, C. Bengs, K. Kouřil, B. Meier, S. Alom, R.J. Whitby and M.H. Levitt, ChemPhysChem 19, 251 (2018). doi:10.1002/cphc.201701330
- G.R. Bacanu, G. Hoffman, M. Amponsah, M. Concistrè, R.J. Whitby and M.H. Levitt, Phys. Chem. Chem. Phys. 22, 11850 (2020). doi:10.1039/D0CP01282C
- E.K. Campbell, M. Holz, D. Gerlich and J.P. Maier, Nature 523, 322 (2015). doi:10.1038/nature14566
- E.K. Campbell, M. Holz, J.P. Maier, D. Gerlich, G.A.H. Walker and D. Bohlender, Astrophys. J. 822, 17 (2016). doi:10.3847/0004-637X/822/1/17
- E.K. Campbell and P.W. Dunk, Rev. Sci. Instrum. 90, 103101 (2019). doi:10.1063/1.5116925
- A.O. Lykhin, S. Ahmadvand and S.A. Varganov, J. Phys. Chem. Lett. 10, 115 (2018). doi:10.1021/acs.jpclett.8b03534
- A.S. Menon and L. Radom, J. Phys. Chem. A 112, 13225 (2008). doi:10.1021/jp803064k
- S. Grimme, J. Antony, S. Ehrlich and H. Krieg, J. Chem. Phys. 132, 154104 (2010). doi:10.1063/1.3382344
- L. Goerigk and S. Grimme, Modeling of Molecular Properties (John Wiley & Sons, Hoboken, 2011), pp. 1–16.
- S. Grimme, S. Ehrlich and L. Goerigk, J. Comput. Chem. 32, 1456 (2011). doi:10.1002/jcc.21759
- M.J. Frisch, G.W. Trucks, H.B. Schlegel, G.E. Scuseria, M.A. Robb, J.R. Cheeseman, G. Scalmani, V. Barone, G.A. Petersson, H. Nakatsuji, X. Li, M. Caricato, A.V. Marenich, J. Bloino, B.G. Janesko, R. Gomperts, B. Mennucci, H.P. Hratchian, J.V. Ortiz, A.F. Izmaylov, J.L. Sonnenberg, D. Williams-Young, F. Ding, F. Lipparini, F. Egidi, J. Goings, B. Peng, A. Petrone, T. Henderson, D. Ranasinghe, V.G. Zakrzewski, J. Gao, N. Rega, G. Zheng, W. Liang, M. Hada, M. Ehara, K. Toyota, R. Fukuda, J. Hasegawa, M. Ishida, T. Nakajima, Y. Honda, O. Kitao, H. Nakai, T. Vreven, K. Throssell, J.A. Montgomery, Jr. J.E. Peralta, F. Ogliaro, M.J. Bearpark, J.J. Heyd, E.N. Brothers, K.N. Kudin, V.N. Staroverov, T.A. Keith, R. Kobayashi, J. Normand, K. Raghavachari, A.P. Rendell, J.C. Burant, S.S. Iyengar, J. Tomasi, M. Cossi, J.M. Millam, M. Klene, C. Adamo, R. Cammi, J.W. Ochterski, R.L. Martin, K. Morokuma, O. Farkas, J.B. Foresman and D.J. Fox, Gaussian16 Revision A.03 (Gaussian Inc., Wallingford, CT, 2016).
- F. Duschinsky, Acta Physicochim. URSS 7, 551 (1937).
- C.M. Western and J. Quant, Spectrosc. Radiat. Transf. 186, 221 (2017). doi:10.1016/j.jqsrt.2016.04.010
- P. Bunker and P. Jensen, Fundamentals of Molecular Symmetry (1st ed., CRC Press, Boca Raton, 2005), p. 101.
- T. Rõõm, L. Peedu, M. Ge, D. Hüvonen, U. Nagel, S. Ye, M. Xu, Z. Bačić, S. Mamone, M.H. Levitt, M. Carravetta, J.Y. Chen, X. Lei, N.J. Turro, Y. Murata and K. Komatsu, Phil. Trans. A Math. Phys. Eng. Sci. 371, 20110631 (2013). doi:10.1098/rsta.2011.0631