
ABSTRACT
Genetic variation at variable number tandem repeat (VNTR) markers was used to assess population structure and diversity among 296 Fusarium graminearum isolates from northern Europe (Finland, northwestern Russia, and Norway), southern Europe (southwestern and western Russia), and Asia (Siberia and the Russian Far East). We identified at least two highly differentiated and geographically structured genetic populations (E1 and E2) in Eurasia (ΦPT = 0.35). Isolates from northern Europe were almost exclusively from the E1 population (95.6%) and had the 3ADON (3-acetyldeoxynivalenol) trichothecene genotype (97.3%). In contrast, all isolates from southern Europe were from the E2 population and 94.4% had the 15ADON (15-acetyldeoxynivalenol) genotype. The E2 population also predominated in the Asian sampling locations (92.7%) where 3ADON and 15ADON genotypes occurred at nearly equal frequencies. Southern European isolates were more closely related to those from Asia (ΦPT = 0.06) than to geographically closer populations from northern Europe (ΦPT ≥ 0.31). Northern European populations also harbored substantially less genetic diversity (Ne ≤ 2.1) than populations in southern Europe or Asia (Ne ≥ 3.4), indicative of a selective sweep or recent introduction and subsequent range expansion in northern Europe. Bayesian analyses incorporating previously described genetic populations from North America (NA1 and NA2) surprisingly identified NA2 and E2 as a single genetic population, consistent with hypotheses of a recent Eurasian origin for NA2. Additionally, more than 10% of the isolates from Asia and southern Europe were assigned to the NA1 population, indicating recent introductions of NA1 into parts of Eurasia. Collectively, these results demonstrate that there are at least three genetic populations of F. graminearum in the Northern Hemisphere and indicate that population-level diversity in Eurasia and North America has been shaped by recent transcontinental introductions.
INTRODUCTION
Fusarium head blight (FHB) is an important disease of small grain cereals that can cause severe quality and yield losses and may lead to mycotoxicosis in humans and animals worldwide (Goswami and Kistler Citation2004; McMullen et al. Citation1997). This has led to the implementation of regulatory or advisory levels as well as routine monitoring for several Fusarium mycotoxins, including deoxynivalenol (DON), in cereal grains worldwide. FHB was first described in Europe in England in 1884 (Parry et al. Citation1995). By 1924, FHB was also found in Russia, Sweden, France, Italy, Germany, the Netherlands, and Norway. Currently, FHB is present in all European agricultural countries, and the severity of FHB on wheat, barley, and oats varies from year to year. Combination of high precipitation and relative humidity and warm temperatures during and after anthesis favors FHB development in spring wheat and oats (Hietaniemi et al. Citation2016; Hjelkrem et al. Citation2017).
Fusarium graminearum is the most common cause of FHB and trichothecene contamination in wheat, barley, and other small grain cereals in many parts of the world (Goswami and Kistler Citation2004; McMullen et al. Citation1997), including much of Europe (van der Lee et al. Citation2015). According to Sundheim et al. (Citation2013), the first F. graminearum isolate in Norway was found from oat in 1911, whereas in Finland the fungus was reported in 1932 (Rainio Citation1932). In Finland, “red mouldy oats” (“punahomeinen kaura” in Finnish) infected by Fusarium caused the first epidemic among farm animals in 1930–1931 (Hintikka Citation1983; Rainio Citation1932). In the Russian Far East, FHB was first officially reported in 1882, but poisoning of animals and local people due to the disease “pink grain” occurred long before that year (Gagkaeva et al. Citation2021; Naumov Citation1916). FHB was a major disease of cereals in the Russian Far East in the 19th century (Jaczewski Citation1904; Voronin Citation1890) and continues to be a threat to cereal production in the 21st century (Gagkaeva et al. Citation2011; Yli-Mattila and Gagkaeva Citation2010, Citation2016). The fungus Gibberella saubinetii Sacc. (= G. zeae, anamorph and present official name F. graminearum) was identified as the principal cause of FHB (Jaczewski Citation1904; Palchevsky Citation1891; Voronin Citation1890) in the region.
F. graminearum and related species within the Graminearum Clade (Laraba et al. Citation2021) typically produce type B trichothecene mycotoxins. Three type B trichothecene chemotypes have been described (Miller et al. Citation1991) among these species and are characterized by production of primarily deoxynivalenol (DON) or nivalenol (NIV) along with their biosynthetic precursors: primarily DON and 3-acetyl-DON (3ADON chemotype), primarily DON and 15-acetyl-DON (15ADON chemotype), and primarily NIV and 4,15-diacetyl-NIV (NIV chemotype). Recently, strains of F. graminearum have been identified with a novel chemotype characterized by production of primarily 3α-acetoxy-7α,15-dihydroxy-12,13-epoxytrichothec-9-ene, a type A trichothecene (NX-2 chemotype) (Kelly et al. Citation2016; Liang et al. Citation2014; Varga et al. Citation2015). Although type A trichothecenes are biosynthetic precursors of type B trichothecenes, and type A trichothecene intermediates and shunt metabolites may be detected in strains of the three main F. graminearum chemotypes, production of primarily a type A trichothecene among F. graminearum is a unique feature of the NX-2 chemotype.
The genetic basis for trichothecene chemotype differences has been identified (Alexander et al. Citation2009; Lee et al. Citation2002; Varga et al. Citation2015), which enabled the development of validated molecular markers for the rapid and accurate inference of the major trichothecene chemotypes based on genotypic differences (referred to here as trichothecene genotyping). Trichothecene genotyping has been widely utilized over the last two decades to understand the diversity, evolution, and distribution of trichothecene types worldwide (Del Ponte et al. Citation2022). It should be noted that trichothecene genotyping assesses the genetic potential of an isolate to produce a particular set of trichothecenes, whereas trichothecene chemotypes are the product of genetic potential and the environment. As such, the specific profile of trichothecene metabolites, intermediates, and shunt metabolites detectable by chemical analyses may differ to some extent based on growth conditions (Crippin et al. Citation2020, Citation2019; Desjardins Citation2006; Pasquali et al. Citation2011; Villafana et al. Citation2019).
Previous analyses demonstrated significant regional differences in trichothecene genotype frequencies among F. graminearum across Eurasia. The 3ADON genotype of F. graminearum is most common in northern Europe (including northwestern Russia, Norway, Sweden, and Finland), whereas the 15ADON genotype is most common in southern Russia and elsewhere in southern and western Europe, and roughly equal frequencies of these trichothecene types were observed in the Russian Far East (Aaemot et al. Citation2015; Boutigny et al. Citation2014; Fredlund et al. Citation2013; Pasquali et al. Citation2016; Prodi et al. Citation2011; Przemieniecki et al. Citation2014; Yli-Mattila et al. Citation2009a, Citation2011). The 3ADON genotype has been spreading from Nordic countries to northwestern Russia, whereas the 15ADON genotype has been spreading from southern Europe to Denmark, Norway, and Lithuania (Aaemot et al. Citation2015; Nielsen et al. Citation2011; Suproniene et al. Citation2010; Yli-Mattila Citation2010; Yli-Mattila and Gagkaeva Citation2010), and the 3ADON genotype has become more common in Russian Far East (Yli-Mattila and Gagkaeva Citation2010).
Population-level analyses using neutral genetic markers have previously documented recent introductions or shifts in F. graminearum populations and significant differences in trichothecene genotype frequencies between distinct genetic populations of this species in other regions (Gale et al. Citation2007; Ward et al. Citation2008; Zhang et al. Citation2012). The aim of the present work was to improve understanding of Eurasian F. graminearum population dynamics by evaluating population structure and genetic diversity among isolates from sampling locations in Finland and northwestern Russia, southwestern Russia, and the Russian Far East where differences in trichothecene genotype prevalence have been documented (Yli-Mattila et al. Citation2009a). By utilizing VNTR markers (Suga et al. Citation2004) that have served as the basis for several population investigations, we were also able to make comparisons with previously characterized populations from Norway and North America (Aaemot et al. Citation2015; Kelly et al. Citation2015; Ward et al. Citation2008).
MATERIALS AND METHODS
Isolate collections.—
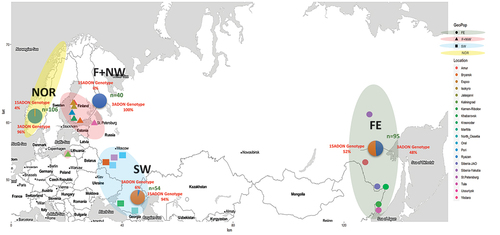
In the current study, we aassessed genetic variation and population structure among 190 F. graminearum isolates from Finland and Russia. Among these isolates, 180 were selected from a collection that was previously analyzed in a multilocus genotyping assay for the determination of phylogenetic species and trichothecene genotype (Yli-Mattila et al. Citation2009b). In addition, we included 10 isolates from western Russia near the Ukrainian border. All 190 of these isolates were deposited in the Agricultural Research Service (ARS) Culture Collection (https://nrrl.ncaur.usda.gov/). To provide a broader context for interpreting genetic variation observed in Finland and Russia, the data collected in this study were combined with previously published data from F. graminearum collected in Norway (106 isolates), the United States (109 isolates), and Canada (129 isolates) (Aaemot et al. Citation2015; Bec et al. Citation2015; Gale et al. Citation2007; Ward et al. Citation2008). Strain histories and genetic data for all isolates are provided in SUPPLEMENTARY TABLE 1. A map depicting the sampling locations across Eurasia () was constructed using RStudio ggmap package (3.0.0; Kahle and Wickham Citation2013).
Figure 1. Map showing the four major geographic sampling locations in Eurasia and their trichothecene genotype frequencies: Norway (highlighted yellow), Finland and northwestern Russia (highlighted pink), southwestern Russia (highlighted blue), and Siberia and the Russian Far East (highlighted green).
VNTR genotyping.—
Genotypes from eight previously published variable number tandem repeat (VNTR) markers (Suga et al. Citation2004) were collected for the 190 isolates from Finland and Russia. VNTR loci included HK913, HK1043, HK1073, HK967, HK977, HK1059, HK630, and HK957. VNTR data from the current and previous studies (Aaemot et al. Citation2015; Bec et al. Citation2015; Gale et al. Citation2007; Ward et al. Citation2008) were collected on the same ABI3100 genetic analyzer (Applied Biosystems, Waltham, MA, USA) and were scored as described by Kelly et al. (Citation2015) using identical allele-size bins in GeneMapper 3.7 (Thermo Fisher Scientific, Waltham, Massachusetts, USA).
Data analysis.—
Bayesian analyses of population structure and population assignment based on VNTR genotype data were conducted using Structure 2.3 (Pritchard et al. Citation2000). All analyses were performed using 100 000 Markov chain Monte Carlo (MCMC) iterations following a 10 000 iteration burn-in for each run and 1 to 5 simulated clusters (K). Ten replicate runs were performed for each value of K, and Structure Harvester (Earl and vonHoldt Citation2011) was used to select the value of K that accounted for the major genetic structure in the data based on the rate of change (ΔK) in likelihood values between successive values of K (Evanno et al. Citation2005). Clumpak (Kopelman et al. Citation2015) was used to compare and visualize Structure results across runs. For individual isolates, the coefficient of membership (q) in each of the K clusters was estimated via Structure and used for population assignment (q > 0.5). Fisher exact probability tests were used to evaluate differences in genetic population frequencies in relation to sampling location and to evaluate differences in trichothecene genotype frequencies among genetic populations.
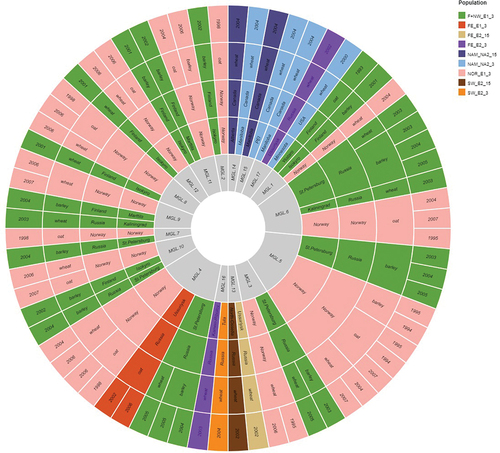
We used an analysis of molecular variance (AMOVA) procedure in GenAlEx 6.5 (Peakall and Smouse Citation2012) to assess genetic differentiation based on ΦPT, an analogue of FST for haploid data, and to estimate the number of migrants (Nm) exchanged between populations. The null hypothesis of no genetic differentiation between pairs of populations was tested using 1000 random permutations of the data. Following Bonferroni correction for multiple tests, pairwise tests with P < .05 were considered statistically significant. We also used GenAlEx 6.5 to assess population-level diversity by estimating the number of effective alleles over loci (Ne), unbiased gene diversity (H), and the number of private alleles (PAS) for geographic and genetic populations. To identify and analyze shared multilocus genotypes (MLGs), the original data set was clone corrected, leaving only one individual per MLG represented per population based on VNTR profile, sampling year, chemotype, host, genetic population (E1, E2, NA1, NA2), and location (). MLG analysis was done using the R package poppr (2.9.3; Kamvar et al. Citation2014).
RESULTS
Initial analyses were conducted to evaluate population structure and genetic diversity among isolates from four geographic populations in Eurasia. European sampling locations included Finland and northwestern Russia (F+NW), southwestern and western Russia (SW), and Norway (NOR). Asian isolates from Siberia and the Russian Far East (FE) constituted a fourth geographic population, separated from the European populations by approximately 8000 km (). Pairwise estimates of population differentiation (ΦPT) and the number of migrants (Nm) between sampling locations () indicated that the F. graminearum population in NOR was not significantly different from F+NW. However, geographic populations from Norway and F+NW were highly differentiated from those in the other regions that were sampled (ΦPT ≥ 0.31). Differentiation between the SW and FE populations was surprisingly low (ΦPT ≤ 0.06) but statistically significant. The F+NW and NOR populations harbored similar levels of genetic diversity, which were substantially lower than was observed in the SW and FE sampling regions (). 3ADON was the only trichothecene genotype observed in F+NW (100%) and was found at a similar frequency in NOR (96.2%). In contrast, the 15ADON genotype was predominant in the SW population (94.4%), and the FE population had a balanced trichothecene genotype composition (). The NIV and NX genotypes were not observed.
Table 1. Genetic differentiation, trichothecene genotype composition, and genetic diversity for four groups of Eurasian isolates defined by sampling location: Finland and northwestern Russia (F+NW), southwestern and western Russia (SW), the Russian Far East (FE), and Norway (NOR).
Bayesian analyses were conducted to further assess genetic structure within and between the four geographic populations sampled from Eurasia. Bayesian clustering was conducted via simulations using the admixture model and independent allele frequencies. However, simulations with models based on correlated allele frequencies, the no admixture model, and models that incorporated information on sampling location produced similar results. Although simulations with K = 5 produced the highest likelihood probabilities, simulations with K = 2 provided the greatest change in likelihood values (ΔK = 835.4) and captured the major genetic structure within the data (). Population assignments based on coefficient of membership (q) values derived from simulation with K = 2 resulted in 49.7% of isolates being assigned to Eurasian population 1 (E1) and 50.3% of isolates being assigned to Eurasian population 2 (E2). The vast majority of isolates (97.0%) were assigned to a population with high coefficient of membership values (q ≥ 0.8), and only nine isolates had intermediate values of q suggestive of admixture. Ten replicate simulation runs with K = 2 produced nearly identical results (similarity score = 0.998).
Figure 2. Bayesian analyses of population structure and admixture based on VNTR data for a total of 296 isolates from Finland and northwestern Russia (F+NW), western and southwestern Russia (SW), Siberia and the Russian Far East (FE), and Norway (NOR). Colored bars indicate Bayesian estimates of ancestry (q) for each isolate in simulations with 2 to 5 genetic clusters (K).
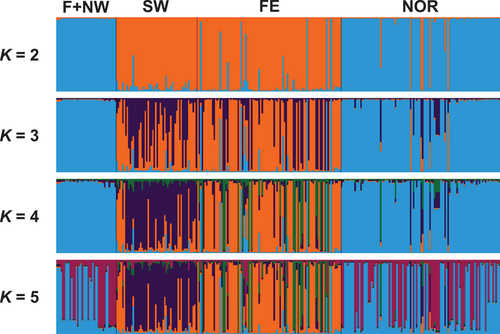
Significant differences (P < .001) in the prevalence of genetic populations E1 and E2 were observed across the locations sampled in Russia, Finland, and Norway ( and ). E1 consisted mostly of isolates from northern Europe, i.e., all isolates from Finland and northwestern Russia, as well as 94.3% of the isolates from Norway. In contrast, E2 was mostly represented by isolates from southern Europe and the Russian Far East, including all isolates from western and southwestern Russia as well as 92.7% of the isolates from the Russian Far East. Simulations with higher values of K (3–5) indicated some additional substructuring of E2, differentiating E2 populations in southern Europe (SW) and Asia (FE). In addition, simulations with K = 5 suggested that two subpopulations may be present across the sampling location in northern Europe (F+NW and NOR). However, support for this additional substructuring was limited, as K = 3 produced a relatively modest improvement in likelihood scores (ΔK = 114.2) and negligible improvements in likelihood were observed with K = 4 (ΔK = 0.3) or K = 5 (ΔK = 2.7).
The geographic partitioning of genetic populations inferred via Bayesian clustering analyses with K = 2 was consistent with pairwise estimates of population differentiation (ΦPT) among sampling locations in distinguishing a predominantly northern European genetic population from a second population that predominates in the western, southwestern, and far eastern parts of Russia. Genetic differentiation between E1 and E2 was high (ΦPT = 0.35; Nm = 0.93), and these two genetic populations harbored different levels of genetic diversity (). Estimates of gene diversity (H) and the effective number of alleles (Ne) in E2 were approximately twice as high as those for E1. Genetic populations in Eurasia were also distinguished by significant differences (P < .001) in trichothecene genotype frequencies, as 98.6% of E1 isolates had the 3ADON genotype and 69.1% of E2 isolates had the 15ADON genotype ().
Table 2. Genetic differentiation, trichothecene genotype composition, and genetic diversity for four genetic populations from Eurasia (E1 and E2) and North America (NA1 and NA2).
We compared the genetic populations identified in Russia, Finland, and Norway (E1 and E2) with those previously reported in North America, which are referred to as NA1 and NA2 in Liang et al. (Citation2014). Genetic diversity among NA1 isolates was relatively high and comparable to that observed for E2, whereas NA2 exhibited reduced genetic diversity similar to that of E1 (). Pairwise estimates of ΦPT () were surprising in that genetic differentiation between E2 and NA2 was relatively low (ΦPT = 0.11) in relation to all other pairwise comparisons (ΦPT ≥ 0.21) and was much lower than for pairs of populations within North America (ΦPT = 0.37) or Eurasia (ΦPT = 0.35).
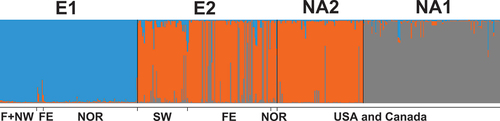
Given this result, Bayesian clustering analyses were conducted as described above to assess population structure and assignment in this larger data set without considering previously defined genetic population identity or geographic origin. A model with three genetic clusters (K = 3) was identified as the optimal model in that it produced the greatest rate of change in likelihood values between successive values of K (ΔK = 682.6). Models with more than three genetic clusters produced very small improvements in likelihood (ΔK < 10.5). Population assignments based on K = 3 clearly distinguished isolates associated with E1 and NA1 but failed to differentiate the E2 and NA2 populations, assigning 84.5% of E2 and 97.8% of NA2 isolates to a common genetic cluster (). Interestingly, 13.4% of E2 isolates were assigned to a cluster dominated by NA1 isolates. Among all E2 isolates, 14.8% had intermediate q values (q < 0.8) suggestive of admixture, and two of these isolates weren’t assigned to any of the genetic clusters at q > 0.5.
Figure 3. Bayesian analyses of population structure and admixture based on VNTR data for a total of 534 isolates from four previously defined genetic populations (E1, E2, NA1, and NA2) from Finland and northwestern Russia (F+NW), western and southwestern Russia (SW), Siberia and the Russian Far East (FE), Norway (NOR), and the USA and Canada. Bayesian estimates of ancestry (q) were determined in simulations with 1 to 5 genetic clusters (K). Colored bars reflect individual q value assignments for each isolate derived from a model with three genetic clusters (K = 3), which was identified as the optimal model in that it produced the greatest rate of change in likelihood values between successive values of K.
Seventeen shared MLGs were identified based on the clone corrected data set. Nearly half of the shared MLGs (41.2%) connected the Norway and F+NW populations (), which is consistent with the very close genetic relationship between these northern European sampling locations. MLG analyses further indicated that some genotypes had a broad geographic and host distribution and persisted over relatively long periods of time. For example, MLG5 was observed among wheat, oat, and barley isolates collected between 1994 and 2007 from Norway and northwestern Russia. Three of the 17 shared MLGs were present in both Europe and Asia. MLG4 was observed among isolates from Norway (oat and wheat, 1998–2006), northwestern Russia (wheat and barley, 2004–2005), and Ussuriysk in the Russian Far East (oat, 2002–2006). MLG13 and MLG16 were shared between FE and SW populations. Interestingly, MLG17 was shared between Asian and North American populations, having been isolated from wheat in the Russian Far East, Canada, and the United States.
Figure 4. Graph showing shared multilocus genotypes inferred from a clone corrected data set consisting of one individual per MLG represented per population based on VNTR profile, sampling year, chemotype, host, genetic population (E1, E2, NA1, NA2), and location. Seventeen shared MLGs were identified on this basis.
DISCUSSION
In the present study of allelic variation across eight VNTR loci, we demonstrate that there are at least two highly differentiated genetic populations (E1 and E2) of F. graminearum in Europe. The level of genetic differentiation between the E1 and E2 genetic populations (ΦPT = 0.35) was similar to that observed for the NA1 and NA2 genetic populations in North America (; Ward et al. Citation2008; Kelly et al. Citation2015). Although some level of local population substructuring consistent with that reported by Aaemot et al. (Citation2015) in Norway was detectable, accounting for this substructure had a negligible impact on likelihood scores. Our results indicate that genetic substructure within the sampled geographic populations is minimal, as was previously observed in a genome-wide analysis of F. graminearum populations in Germany (Talas and McDonald Citation2015).
In our sampling from locations in Europe, E1 and E2 were geographically distinct and were characterized by significant differences in trichothecene genotype frequencies. In northern Europe, all isolates from Finland and northwestern Russia, and all but six isolates (two 3ADON and four 15ADON isolates) from Norway, belong to the E1 genetic population. All isolates of the E1 population in northern Europe have the 3ADON trichothecene genotype. In contrast, all isolates from central and southwestern Russia belong to the E2 genetic population, and 94.4% of these isolates had the 15ADON trichothecene genotype. Trichothecene genotyping of more than 1100 F. graminearum isolates from across 17 European countries previously demonstrated the predominance of 3ADON in northern Europe and 15ADON in southern, central, and western Europe (Pasquali et al. Citation2016). Differences in isoenzyme patterns and the distribution of intergenic sequence (IGS) and β-tubulin alleles were also observed between representatives of these two regional groups (Gagkaeva and Yli-Mattila Citation2004). Results from analyses of population structure in the present study are consistent with the previously hypothesized regional differentiation of northern and southern European populations (Pasquali et al. Citation2016; Yli-Mattila et al. Citation2013). However, analyses of neutral genetic variation from a much broader set of sampling locations will be needed to fully assess the distributions of E1 and E2 across southern, central, and western Europe.
Analyses of Asian sampling locations in the Russian Far East (FE) indicate that the E2 population may be widespread in Eurasia. The E2 population accounted for 92.8% of FE isolates, and only seven representatives (five 3ADON and two 15ADON isolates) of the E1 population were observed from these Asian sampling locations. Unlike the E2 population that we identified in Europe, the E2 population in Asia displayed nearly equal frequencies of the 3ADON and 15ADON trichothecene genotypes, indicating that trichothecene genotype is not always a reliable proxy for genetic population identity. This is to be expected given that trichothecene genotype composition is likely impacted by selection in addition to the evolutionary and demographic histories of populations (Kelly and Ward Citation2018; Ward et al. Citation2002). F. graminearum is common in many parts of Asia, including northern and northeastern China (van der Lee et al. Citation2015; Zhang et al. Citation2012), and northern Japan (Suga et al. Citation2008), which are relatively close to the Russian Far East. The 15ADON genotype is predominant among F. graminearum from both areas, but the 3ADON genotype was found among 30% of F. graminearum isolates from Japan (Suga et al. Citation2008; Xu et al. Citation2021; Zhang et al. Citation2012) and was also present in Harbin, China (Yli-Mattila et al. Citation2009b). Analyses of diversity and population structure based on neutral genetic variation would be useful in determining how these, and other, geographic populations in Asia are connected to the E1 and E2 genetic populations described in the present study.
Comparisons between the Asian and European sampling locations analyzed in the present study unexpectedly revealed that F. graminearum in southwestern Russia (SW) have a much closer genetic relationship (ΦPT = 0.06) to isolates from the Russian Far East (FE) than to isolates from closer sampling locations in northern Europe (ΦPT ≥ 0.31). The observation of a high number of shared MLGs in Norway and F+NW further demonstrates a much closer genetic relationship and high level of migration and gene flow within northern Europe. However, the strong genetic differentiation and low level of migration that we observed between southern and northern European sampling locations is incongruent with the propensity for high gene flow across large geographic distances that has previously been observed for F. graminearum (Miedaner et al. Citation2008) and may indicate an ecological or other barrier is limiting migration and subsequent genetic homogenization of these populations.
Yli-Mattila et al. (Citation2013) suggested that the F. graminearum in northern Europe may be more specialized to oats than are isolates from southern Europe. Similarly, Pasquali et al. (Citation2016) interpreted their occurrence data as confirming oats as a preferential host for isolates with the 3ADON genotype in northern Europe while also noting the limited maize production in northern Europe as compared with other parts of the continent. These hypotheses were recently supported by the results of field experiments using a small number of 3ADON isolates from Finland and 15ADON isolates from southern Russia (Yli-Mattila et al. Citation2022). However, the genetic population identities of those isolates were not determined. Associations between different hosts and FHB species, genetic populations, or trichothecene genotypes have been widely reported (Basler Citation2016; Boutigny et al. Citation2011; Carter et al. Citation2002; Del Ponte et al. Citation2022; Lee et al. Citation2010; Suga et al. Citation2008; Zhang et al. Citation2012). However, the reasons for such associations can be complex and are likely to be multifactorial. Ultimately, understanding population-specific differences in ecological or host adaptations will require integrating information on population structure with experimental analyses of pathogen fitness in relation to different hosts and environmental factors.
The lack of genetic exchange between our sampling locations in northern Europe and southwestern Russia may also be reflective of the demographic and evolutionary history of the populations. The populations in southwestern Russia and the Russian Far East have similar levels of genetic diversity, a relatively low level of genetic differentiation, and a small number of shared MLGs consistent with expectations under an isolation by distance model. However, the population in northern Europe is genetically distinct and harbors substantially less genetic variation than was found in the other sampling regions. This may reflect a recent selective sweep of genetic variation in the northern European population or a relatively recent introduction and subsequent range expansion for this population in northern Europe, as was reported for the NA2 population in North America (Gale et al. Citation2007; Ward et al. Citation2008).
When Eurasian isolates were compared with North American isolates via Bayesian analyses, it was interesting that the NA2 population from North America could not be distinguished from the E2 population that was predominant in the SW and FE regions of Russia (). Previous analyses demonstrated that the NA2 population was rare in North American collections prior to 2004 before rapidly increasing in frequency within the Upper Midwest of the United States and western Canada where it has largely displaced the dominant NA1 genetic population (Kelly et al. Citation2015; Ward et al. Citation2008). Gale et al. (Citation2007) and Ward et al. (Citation2008) hypothesized that the NA2 population in North America was attributable to a relatively recent transcontinental introduction. The results of our analyses are consistent with this hypothesis and further indicate a potential Eurasian origin for NA2, although analyses of global population structure and diversity within F. graminearum will be needed to fully evaluate the potential NA2 source population. Although the NA1 population is not closely related to the genetic populations in Eurasia, a surprisingly large number of isolates (>10%) from SW and FE Russia have NA1 genetic backgrounds, indicating recent migration of NA1 isolates into parts of Eurasia. Only one such isolate was observed from our sampling locations in northern Europe. Taken together, our results demonstrate that there are at least three genetic populations of F. graminearum in the Northern Hemisphere and that population-level diversity in Eurasia and North America has likely been shaped by recent transcontinental migration.
DISCLAIMER
The mention of company names or trade products does not imply that they are endorsed or recommended by the US Department of Agriculture (USDA) over other companies or similar products not mentioned. USDA is an equal opportunity provider and employer.
Supplemental Material
Download MS Excel (71.3 KB)ACKNOWLEDGMENTS
The authors acknowledge Nathane Orwig and Thomas Usgaard from United States Department of Agriculture Agriculture Research Service (USDA-ARS), Peoria, Illinois, USA, for skilled technical assistance. We also thank Päivi Parikka from Luke, Finland, and Tatiana Gagkaeva from All-Russian Institute of Plant Protection, Russia, for collecting and morphological identification of the Finnish and Russian F. graminearum isolates and Heidi Aamot from NIBIO (Norwegian Institute for Bioeconomy Research), Emre Yoruk from Istanbul Yeni Yuzyil University, Asmaa Abbas from the University of Turku, and Susan McCormick from USDA-ARS for their comments on the manuscript.
DISCLOSURE STATEMENT
No potential conflict of interest was reported by the author(s).
SUPPLEMENTARY MATERIAL
Supplemental data for this article can be accessed online at https://doi.org/10.1080/00275514.2023.2198927
Additional information
Funding
LITERATURE CITED
- Aaemot HU, Ward TJ, Brodal G, Vrålstad T, Larsen GB, Klemsdal SS, Elameen A, Uhlig S, Hofgaard IS. 2015. Genetic and phenotypic diversity within the Fusarium graminearum species complex in Norway. Eur J Plant Pathol 142:1–19.
- Alexander NJ, Proctor RH, McCormick SP. 2009. Genes, gene clusters, and biosynthesis of trichothecenes and fumonisins in Fusarium. Toxin Rev. 28:198–215.
- Basler R. 2016. Diversity of Fusarium species isolated from UK forage maize and the population structure of F. graminearum from maize and wheat. PeerJ. 4:e2143. doi:10.7717/peerj.2143.
- Bec S, Ward T, Farman M, O’Donnell K, Hershman DE, Van Sanford DA, Vaillancourt LJ. 2015. Characterization of Fusarium strains recovered from wheat with symptoms of head blight in Kentucky. Plant Dis. 99:1622–1632. doi:10.1094/PDIS-06-14-0610-RE.
- Boutigny A-L, Ward TJ, Ballois N, Iancu G, Ioos R. 2014. Diversity of the Fusarium graminearum species complex on French cereals. Eur J Plant Pathol. 138:133–148. doi:10.1007/s10658-013-0312-6.
- Boutigny A-L, Ward TJ, Van Coller GJ, Flett B, Lamprecht SC, O’Donnell K, Viljoen A. 2011. Analysis of the Fusarium graminearum species complex from wheat, barley and maize in South Africa provides evidence of species-specific differences in host preference. Fungal Genet Biol. 48:914–920. doi:10.1016/j.fgb.2011.05.005.
- Carter J, Rezanoor H, Holden D, Desjardins AE, Plattner ED, Nicholson P. 2002. Variation in pathogenicity associated with the genetic diversity of Fusarium graminearum. Eur J Plant Pathol. 108:573–583. doi:10.1023/A:1019921203161.
- Crippin T, Limay-Rios V, Renaud JB, Schaafsma AW, Sumarah MW, Miller JD. 2020. Fusarium graminearum populations from corn and wheat in Ontario, Canada. World Mycotoxin J. 13(3):355–366. doi:10.3920/WMJ2019.2532.
- Crippin T, Renaud JB, Sumarah MW, Miller JD. 2019. Comparing genotype and chemotype of Fusarium graminearum from cereals in Ontario. Canada PLoS ONE. 14(5):e0216735. doi:10.1371/journal.pone.0216735.
- Del Ponte E, Moreira G, Ward T, O’Donnel K, Nicolli C, Machado F, Duffeck M, Alves K, Tessmann D, Waalwijk C, et al. 2022. Fusarium graminearum species complex: a bibliographic analysis and web-accessible database for global mapping of species and trichothecene toxin chemotype. Phytopathol. 112(4):741–751. doi:10.1094/PHYTO-06-21-0277-RVW.
- Desjardins AE. 2006. Fusarium mycotoxins: chemistry, genetics, and biology. St. Paul (MN): American Phytopathology Society Press.
- Earl DA, vonHoldt BM. 2011. STRUCTURE HARVESTER: a website and program for visualizing STRUCTURE output and implementing the Evanno method. Conserv Genet Resour. 4:359–361. doi:10.1007/s12686-011-9548-7.
- Evanno G, Regnaut S, Goudet J. 2005. Detecting the number of clusters of individuals using the software structure: a simulation study. Mol Ecol. 14:2611–2620. doi:10.1111/j.1365-294X.2005.02553.x.
- Fredlund E, Gidlund A, Sulyok M, Börjesson T, Krska R, Olsen M, Lindblad M. 2013. Deoxynivalenol and other selected Fusarium toxins in Swedish oats-occurrence and correlation to specific Fusarium species. Int J Food Microbiol. 167:276–283. doi:10.1016/j.ijfoodmicro.2013.06.026.
- Gagkaeva T, Gavrilova OP, Yli-Mattila T, Loskutov IG. 2011. Evaluation of oat germplasm for resistance to Fusarium head blight. Plant Breed and Seed Sci. 64:15–22. doi:10.2478/v10129-011-0040-z.
- Gagkaeva T, Orina A, Gavrilova O. 2021. Fusarium head blight in the Russian Far East: 140 years after description of the ‘drunken bread’ problem. PeerJ. 9:e12346. doi:10.7717/peerj.12346.
- Gagkaeva T, Yli-Mattila T. 2004. Genetic diversity of populations of Fusarium graminearum in Europe and Asia. Eur J Plant Pathol. 110:551–562. doi:10.1023/B:EJPP.0000032395.11246.d0.
- Gale LR, Ward TJ, Balmas V, Kistler HC. 2007. Population subdivision of Fusarium graminearum sensu stricto in the upper Midwestern United States. Phytopathology. 97:1434–1439. doi:10.1094/PHYTO-97-11-1434.
- Goswami RS, Kistler HC. 2004. Heading for disaster: Fusarium graminearum on cereal crops. Mol Plant Pathol. 5:515–525. doi:10.1111/j.1364-3703.2004.00252.x.
- Hietaniemi V, Ramo S, Yli-Mattila T, Jestoi M, Peltonen S, Kartio M, Sievilainen E, Koivisto T, Parikka P. 2016 May 3. Updated survey of Fusarium species and toxins in Finnish cereal grains. Food Addit Contam Part A Chem Anal Control Expo Risk Assess. 33(5):831–848.
- Hintikka EL. 1983. Toxicosis and natural occurrence of trichothecenes in Finland. In: Ueno Y, editor. Trichothecenes - chemical, biological and toxicological aspects. Amsterdam (The Netherlands): Elsevier. p. 221–228.
- Hjelkrem A-GR, Torp T, Brodal G, Aamot HU, Strand E, Nordskog B, Dill-Macky R, Edwards SG, Hofgaard IS. 2017. DON content in oat grains in Norway related to weather conditions at different growth stages. Eur J Plant Pathol. 148:577–594. doi:10.1007/s10658-016-1113-5.
- Jaczewski AA. 1904. About tempulent corn. Sheet Inf Dis, Cont. 11:89–92. (in Russian).
- Kahle D, Wickham H. 2013. ggmap: spatial visualization with ggplot2. R J. 51:144–61. doi:10.32614/RJ-2013-014
- Kamvar ZN, Tabima JF, Grünwald NJ. 2014. Poppr: an R package for genetic analysis of populations with clonal, partially clonal, and/or sexual reproduction. PeerJ. 2:e281. doi:10.7717/peerj.281.
- Kelly AC, Clear RM, O’Donnell K, McCormick S, Turkington K, Tekauz A, Gilbert J, Kistler HC, Busman M, Ward TJ. 2015. Diversity of Fusarium head blight populations and trichothecene toxin types reveals regional differences in pathogen composition and temporal dynamics. Fungal Genet Biol. 82:22–31. doi:10.1016/j.fgb.2015.05.016.
- Kelly AC, Proctor RH, Belzile F, Chulze S, Clear RM, Cowger C, Lee T, Obanor F, Waalwijk C, Ward TJ. 2016. The geographic distribution and complex evolutionary history of the NX-2 trichothecene chemotype from Fusarium graminearum. Fungal Genet Biol. 95:39–48. doi:10.1016/j.fgb.2016.08.003.
- Kelly AC, Ward TJ 2018 Mar. 27. Population genomics of Fusarium graminearum reveals signatures of divergent evolution within a major cereal pathogen. Plos One. 13:e0194616. doi:10.1371/journal.pone.0194616.
- Kopelman NM, Mayzel J, Jakobsson M, Rosenberg NA, Mayrose I. 2015. Clumpak: a program for identifying clustering modes and packaging population structure inferences across K. Mol Ecol Resour. 15:1179–1191. doi:10.1111/1755-0998.12387.
- Laraba I, McCormick SP, Vaughan MM, Geiser DM, O’Donnell K. 2021 Jan 12. Phylogenetic diversity, trichothecene potential, and pathogenicity within Fusarium sambucinum species complex. PLoS One. 16(1):e0245037. doi:10.1371/journal.pone.0245037. Erratum in: PLoS One. 2021 Apr 22;16(4):e0250812. PMID: 33434214; PMCID: PMC7802971.
- Lee SH, Lee J, Nam YJ, Lee S, Ryu JG, Lee T. 2010. Population structure of Fusarium graminearum from maize and rice in 2009 in Korea. Plant Pathol. J. 226:321–327. doi:10.5423/PPJ.2010.26.4.321.
- Lee T, Han YK, Kim KH, Yun SH, Lee YW. 2002. Tri13 and Tri7 determine deoxynivalenol-and nivalenol-producing chemotypes of Gibberella zeae. Appl Environ Microbiol. 68:2148–54. doi:10.1128/AEM.68.5.2148-2154.2002.
- Liang J, Xayamongkhon H, Broz K, Dong Y, McCormick SP, Abramova S, Ward TJ, Ma ZH, Kistler HC. 2014. Temporal dynamics and population genetic structure of Fusarium graminearum in the upper Midwestern United States. Fungal Genet Biol. 73:83–92. doi:10.1016/j.fgb.2014.10.002.
- McMullen M, Jones R, Gallenberg D. 1997. Scab of wheat and barley: a re-emerging disease of devastating impact. Plant Dis. 81(12):1340–1348. doi:10.1094/PDIS.1997.81.12.1340.
- Miedaner T, Cumagun CJ, Chakraborty S. 2008. Population genetics of three important head blight pathogens Fusarium graminearum, F. pseudograminearum, and F. culmorum. J Phytopathol. 156:129–139. doi:10.1111/j.1439-0434.2007.01394.x.
- Miller JD, Greenhalgh R, Wang Y, Lu M. 1991. Trichothecene chemotypes of three Fusarium species. Mycologia. 83:121–130. doi:10.1080/00275514.1991.12025988.
- Naumov NA. 1916. Drunken bread observations under some species of genus Fusarium. Bureau of Mycology and Phytopathology. Petrograd (In Russian).
- Nielsen LK, Jensen JD, Nielsen GC, Jensen JE, Spliid NH, Thomsen IK, Justesen AF, Collinge DB, Jorgensen LN. 2011. Fusarium head blight of cereals in Denmark: species complex and related mycotoxins. Phytopathology. 101:960–969. doi:10.1094/PHYTO-07-10-0188.
- Palchevsky NA. 1891. Diseases of cultivated cereals of the South Ussuri region. Public Benefit Partnership, Saint Petersburg (In Russian).
- Parry DW, Jenkins P, McLeod L. 1995. Fusarium ear blight (scab) in small grain cereals – a review. Plant Pathol. 44:207–238.
- Pasquali M, Beyer M, Bohn T, Hoffmann L. 2011. Comparative analysis of genetic chemotyping methods for Fusarium: tri13 polymorphism does not discriminate between 3- and 15-acetylated deoxynivalenol chemotypes in Fusarium graminearum. J Phytopathol. 159:700–704. doi:10.1111/j.1439-0434.2011.01824.x.
- Pasquali M, Beyer M, Logrieco A, Audenaert K, Balmas V, Basler R, Boutigny A-L, Chrpová J, Czembor E, Gagkaeva T, et al. 2016 Apr 6. A European database of Fusarium graminearum and F. culmorum trichothecene genotypes. Front Microbiol. 7:406. doi:10.3389/fmicb.2016.00406.
- Peakall R, Smouse PE. 2012. GenAlEx 6.5: genetic analysis in excel. Population genetic software for teaching and research—an update. Bioinformatics. 28:2537–2539. doi:10.1093/bioinformatics/bts460.
- Pritchard JK, Stephens M, Donnelly P. 2000. Inference of population structure using multilocus genotype data. Genetics. 155:945–959. doi:10.1093/genetics/155.2.945.
- Prodi A, Purahong W, Tont S, Salomoni D, Nipoti P, Covarell L, Pisi A. 2011. Difference in chemotype composition of Fusarium graminearum populations isolated from durum wheat in adjacent areas separated by the Apennines in Northern-Central Italy. Plant Pathol J. 27:354–359. doi:10.5423/PPJ.2011.27.4.354.
- Przemieniecki SW, Kurowski TP, Korzekwa K. 2014. Chemotypes and geographic distribution of the Fusarium graminearum species complex. Environ Biotechnol. 10(2):45–59. doi:10.14799/ebms241.
- Rainio AJ. 1932. Punahome Fusarium roseum Link. - Gibberella saubinetii (Mont.) Sacc. ja sen aiheuttamat myrkytykset kaurassa. Valtion Maatalouskoetoiminnan. Julkaisuja. 50:1–45. (in Finnish, abstract in German).
- Suga H, Gale LR, Kistler HC. 2004. Development of VNTR markers for two Fusarium graminearum clade species. Mol Ecol Notes. 4:468–470. doi:10.1111/j.1471-8286.2004.00703.x.
- Suga H, Karugia GW, Ward TJ, Gale LR, Tomimura K, Nakajima T, Miyasaka A, Koizumi S, Kageyama K, Hyakumachi M. 2008. Molecular characterization of the Fusarium graminearum species complex in Japan. Phytopathology. 98:159–166. doi:10.1094/PHYTO-98-2-0159.
- Sundheim L, Brodal G, Hofgaard IS, Rafoss T. 2013. Temporal variation of mycotoxin producing fungi in Norwegian cereals. Microorganisms. 1:188–198. doi:10.3390/microorganisms1010188.
- Suproniene S, Justesen AF, Nicolaisen M, Mankeviciene A, Dabkevicius Z, Semaskiene R, Leistrumait A. 2010. Distribution of trichothecene and zearalenone producing Fusarium species in grain of different cereal species and cultivars grown under organic farming conditions in Lithuania. Ann Agric Environ Medicin. 17:73–80.
- Talas F, McDonald BA. 2015. Genome-wide analysis of Fusarium graminearum field populations reveals hotspots of recombination. BMC Genomics. 16:996. doi:10.1186/s12864-015-2166-0).
- van der Lee T, Zhang H, van Diepeningen A, Waalwijk C. 2015. Biogeography of Fusarium graminearum species complex and chemotypes: a review. Food Addit Contam Part A Chem Anal Control Expo Risk Assess. 32:453–460. doi:10.1080/19440049.2014.984244.
- Varga E, Wiesenberger G, Hametner C, Ward TJ, Dong Y, Schöfbeck D, McCormick S, Broz K, Stückler R, Schuhmacher R, et al. 2015. New tricks of an old enemy: isolates of Fusarium graminearum produce a type A trichothecene mycotoxin. Environ Microbiol. 17:2588–2600. doi:10.1111/1462-2920.12718.
- Villafana RT, Ramdass AC, Rampersad SN. 2019. Selection of Fusarium trichothecene toxin genes for molecular detection depends on TRI gene cluster organization and gene function. Toxins. 11:36. doi:10.3390/toxins11010036.
- Voronin MC. 1890. About tempulent corn in the South-Ussuriiskij region. Botanical Notes. SPb, Russia. 3:13–21. (in Russian).
- Ward TJ, Bielawski JP, Kistler HC, Sullivan E, O’Donnell K 2002. Ancestral polymorphism and adaptive evolution in the trichothecene mycotoxin gene cluster of phytopathogenic Fusarium. Proc Nat Acad Sci USA. 99:9278–9283.
- Ward TJ, Clear RM, Rooney AP, O’Donnell K, Gaba D, Patrick S, Starkey DE, Gilbert J, Geiser DM, Nowicki TW. 2008. An adaptive evolutionary shift in Fusarium head blight pathogen populations is driving the rapid spread of more toxigenic Fusarium graminearum in North America. Fungal Genet Biol. 45:473–484. doi:10.1016/j.fgb.2007.10.003.
- Xu F, Liu W, Song YL, Zhou YL, Xu XM, Yang GQ, Wang J, Zhang J, Lu L. 2021. The distribution of Fusarium graminearum and Fusarium asiaticum causing Fusarium head blight of wheat in relation to climate and cropping system. Plant Dis. 105:2830–2835. doi:10.1094/PDIS-01-21-0013-RE.
- Yli-Mattila T. 2010. Ecology and evolution of toxigenic Fusarium species in cereals in Northern Europe and Asia. J Plant Pathol. 92:7–18.
- Yli-Mattila T, Gagkaeva T. 2016. Fusarium toxins in cereals in Northern Europe and Asia. In: Deshmukh S, Misra JK, Tewari JP, Papp T, editors. Applications of fungi and their management strategies. CRC Press. p. 293–317.
- Yli-Mattila T, Gagkaeva T. 2010. Molecular chemotyping of Fusarium graminearum, F. culmorum and F. cerealis isolates from Finland and Russia. In: Gherbawy Y, Voigt K, editors. Molecular identification of fungi. Berlin (Heidelberg, New York, Germany): Springer Verlag. p. 159–177.
- Yli-Mattila T, Gagkaeva T, Ward TJ, Aoki T, Kistler HC, O’Donnell K. 2009b. A novel Asian clade within the Fusarium graminearum species complex includes a newly discovered cereal head blight pathogen from the Russian Far East. Mycologia. 101:841–852. doi:10.3852/08-217.
- Yli-Mattila T, Hussien T, Abbas A. 2022. Host specialization in Fusarium graminearum on wheat and oats in Europe. J Plant Pathol. doi:10.1007/s42161-022-01233-9.
- Yli-Mattila T, Parikka P, Lahtinen T, Ramo S, Kokkonen M, Rizzo A. 2009a. Fusarium DNA levels in Finnish cereal grains. In: Gherbawy Y, Mach L, Rai M, editors. Current advances in molecular mycology. New York (USA): Nova Science Publishers Inc. p. 107–138.
- Yli-Mattila T, Rämö S, Hussien T, Carlobos-Lopez AL, Cumagun CJR. 2013. Molecular quantification and genetic diversity of toxigenic Fusarium species in Northern Europe as compared to those in Southern Europe. Microorganisms. 1:162–174. doi:10.3390/microorganisms1010162.
- Yli-Mattila T, Rämö S, Tanner R, Loiveke H, Hietaniemi V. 2011. Fusarium DNA levels as compared to mycotoxin levels in Finnish and Estonian grain samples. Plant Breed Seed Sci. 64:131–140. doi:10.2478/v10129-011-0036-8.
- Zhang H, van der Lee T, Waalwijk C, Chen WQ, Xu J, Xu JS, Zhang Y, Feng J. 2012. Population analysis of the Fusarium graminearum species complex from wheat in China show a shift to more aggressive isolates. PLoS One. 7:e31722. doi:10.1371/journal.pone.0031722.