
ABSTRACT
Species of the phylum Blastocladiomycota, early-diverging zoosporic (flagellated) lineages of fungi, are vastly understudied. This phylum includes the genus Coelomomyces, which consists of more than 80 fungal species that are obligate parasites of arthropods. Known Coelomomyces species lack a complete asexual life cycle, instead surviving through an obligate heterecious alternation of generations life cycle. Despite their global distribution and interesting life cycle, little is known about the genomics of any Coelomomyces species. To address this, we generated three draft-level genomes and annotations for C. lativittatus representing its haploid meiospore, orange gamete, and amber gamete life stages. These draft genome assemblies ranged in size from 5002 to 5799 contigs, with a total length of 19.8–22.8 Mb and a mean of 7416 protein-coding genes. We then demonstrated the utility of these genomes by combining the draft annotations as a reference for analysis of C. lativittatus transcriptomes. We analyzed transcriptomes from across host-associated life stages, including infected larvae and excised mature sporangia from the mosquito Anopheles quadrimaculatus. We identified differentially expressed genes and enriched GO terms both across and within life stages and used these to make hypotheses about C. lativittatus biology. Generally, we found the C. lativittatus transcriptome to be a complex and dynamic expression landscape; GO terms related to metabolism and transport processes were enriched during infection and terms related to dispersal were enriched during sporulation. We further identified five high mobility group (HMG)-box genes in C. lativittatus, three belonging to clades with mating type (MAT) loci from other fungi, as well as four ortholog expansions in C. lativittatus compared with other fungi. The C. lativittatus genomes and transcriptomes reported here are a valuable resource and may be leveraged toward furthering understanding of the biology of these and other early-diverging fungal lineages.
INTRODUCTION
Fungi contribute to critical roles in the global ecosystem, yet knowledge of their biology, genetics, and biochemistry largely stems from observations of only two phyla, the Ascomycota and Basidiomycota (i.e., the Dikarya). Zoosporic (flagellated) lineages of fungi make up additional fungal phyla (including the Blastocladiomycota and Chytridiomycota) but are generally understudied (James et al. Citation2020). The phylogenetic placement of these early-diverging zoosporic lineages is controversial and under constant revision as new genomic data become available (James et al. Citation2020; Li et al. Citation2021). For example, fungi belonging to the Blastocladiomycota were originally placed together with lineages in the Chytridiomycota, but now Blastocladiomycota is its own phylum (James et al. Citation2006; Porter et al. Citation2011). In addition, recent phylogenetic efforts have suggested that Blastocladiomycota may be more closely related to the Dikarya than the Chytridiomycota (Amses et al. Citation2022).
Within the Blastocladiomycota, the genus Coelomomyces (Blastocladiales; Coelomomycetaceae) consists of more than 80 highly fastidious fungal species that are obligate fatal parasites, primarily of mosquitoes and microcrustaceans (Couch and Bland Citation1985; Powell Citation2017; Shen et al. Citation2020; Whisler et al. Citation1975). These fungi have a worldwide distribution and over the last hundred years have been reported infecting all major genera of mosquitoes, i.e., Aedes, Culex, and Anopheles, each of which contains many species that transmit pathogens that cause medically important diseases such as malaria, filariasis, and various viral encephalitides. Moreover, because it is difficult to detect Coelomomyces infections in larval and adult mosquitoes, it is estimated that there are more than several hundred species worldwide yet to be described (Couch and Bland Citation1985), making these fungi a very large group for which we know virtually nothing about their genomes and biochemistry. This lack of knowledge is due to the failure, despite numerous attempts, to culture any species of Coelomomyces in vitro. One major difficulty is the lack of a cell wall on hyphae growing in the vegetative stages of their mosquito and copepod hosts. As far as is known, Coelomomyces species lack a complete asexual life cycle, instead surviving through an obligate alternation of generations in which a sporophytic phase parasitizes mosquitoes (e.g., larva) and a gametopytic phase parasitizes microcrustaceans (e.g., copepods) () (Couch and Bland Citation1985; Federici and Chapman Citation1977; Whisler et al. Citation1975). This type of life cycle is uncommon in fungi, although a similar heterecious life cycle is observed in the rust fungi (Duplessis et al. Citation2021).
Figure 1. Alternation of generations life cycle of Coelomomyces lativittatus.Diagram showing the general alternation of generations life cycle of C. lativittatus between copepod and mosquito hosts. The different life stages that were used in this study are circled and highlighted. Genomic sequencing was performed on haploid stages: including orange gametes (orange), amber gametes (yellow), and meiospores (purple). RNA sequencing was performed on diploid stages, including mosquito larval infection stages (green) as well as sporangial stages excised from mosquito larva (blue).
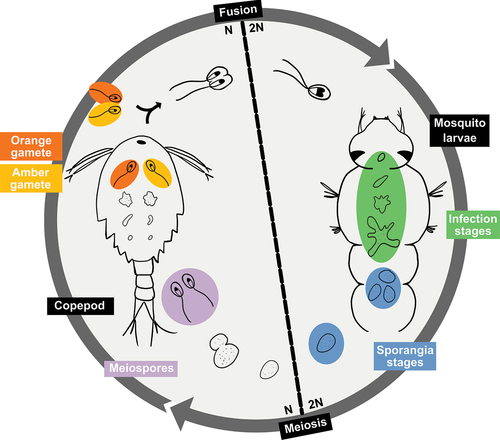
The Coelomomyces life cycle begins when a biflagellate zygote encounters a mosquito larva. The motile spore encysts on the intersegmental membrane of the mosquito cuticle, a process facilitated by the secretion of adhesion vesicles (Travland Citation1979). The encysted spore develops an appressorium and penetration tube, which penetrates through the host cuticle (Zebold et al. Citation1979). Once inside the mosquito larva, the so-called hyphagens grow into coenocytic hyphae that ramify within the hemocoel over a period of 7 to 10 days, which then form sporangia at their tips (Couch and Bland Citation1985; Federici and Chapman Citation1977). The mosquito larva subsequently dies and putrefies, liberating the sporangia. Meiosis then occurs in the sporangia, resulting in haploid uniflagellate meiospores, which after sporangial dehiscence seek out and infect a crustacean host (typically copepods, although ostracods can serve as hosts as in some Coelomomyces species [Whisler et al. Citation2009]).
The penetration of copepods is thought to occur in a manner similar to that of the mosquito larva (Federici and Chapman Citation1977; Zebold et al. Citation1979), after which hyphae of the gametophyte form a holocarpic gametangium that cleaves into gametes. The meiospores that infect the copepods are of opposite mating types, thus forming gametangia in the copepod host that can generate gametes of opposite mating types. When gametogenesis is complete, the gametangium bursts, killing the copepod host and allowing the gametes to escape through fissures in the intersegmental membranes. If a copepod is infected by meiospores of each mating type, the gametangia burst simultaneously and gametes of opposite mating types mate, forming biflagellate zygotes within the dead copepod, which then seek out a mosquito larval host after release, thereby completing the alternations of generations life cycle (Whisler et al. Citation1975). If only a single mating type gametangium develops within a copepod, the gametes swim to the surface where they seek a mate in the water in which the mosquito larvae are breeding. In some species, such as C. punctatus and C. dodgei, the gametangia and gametes of different mating types, much like those of Blastocladiella emersonii, are of different colors, apparently due to different levels of β-carotene, with one isoform being bright orange and the other light amber (Federici Citation1977; Federici and Thompson Citation1979).
As noted above, despite their worldwide distribution and relatively unique life cycle, little is known about the biology, biochemistry, or genomic landscape of Coelomomyces species. Modern molecular and genomic techniques allow us to circumvent the need for in vitro culturing and to expand foundational knowledge of this enigmatic fungal genus. Toward this goal, we have established an in vivo culture of C. lativittatus, a close relative of C. dodgei and C. punctatus (Couch and Bland Citation1985; Federici Citation1979), which we maintain using the mosquito Anopheles quadrimaculatus and the copepod Acanthocyclops vernalis. The research presented here represents the first exploratory investigation of Coelomomyces genomics and the C. lativittatus transcriptome.
To begin to answer questions related to Coelomomyces biology, we generated draft genomes and annotations for C. lativittatus from three life stages: (i) meiospores, (ii) orange gametes, and (iii) amber gametes. We generated transcriptomes from across life stages, including infection of An. quadrimaculatus hosts and excising of sporangia from An. quadrimaculatus, to elucidate genes involved in the unique biology and alternation of generations life cycle of this fungus. We then searched for mating type loci in C. lativittatus, as well as looked at expansions of orthologous genes compared with close relatives in the Blastocladiomycota and Chytridiomycota. The C. lativittatus genomes and transcriptomes reported here provide an invaluable foundational resource for understanding the biology of this and other unique and important understudied fungal lineages in various worldwide aquatic ecosystems.
MATERIALS AND METHODS
Study system.—
Larvae and copepods used for maintenance of the in vivo culture of C. lativittatus were, respectively, Anopheles quadrimaculatus and Acanthocyclops vernalis. These were maintained in culture as described previously (Federici Citation1983).
DNA extraction methods and sequencing.—
We sought to generate genomes from three haploid life stages: (i) meiospores, (ii) orange gametes, and (iii) amber gametes. To obtain C. lativittatus meiospores, mosquito larvae with advanced infections were collected when full of sporangia, within a day or two of death. To induce germination of sporangia, each larva was surface-sterilized by rinsing it in 70% ethanol for 20s, after which each was placed in 1 mL of double-distilled water in a 22-mm plastic Petri dish at room temperature. The larvae were dissected with jeweler’s forceps, and most of the cuticle and midgut were removed from the water. Typically, the sporangia dehisced, releasing meiospores, 48–72 h after incubation at room temperature. Meiospore samples were collected using a 1-mL pipette and centrifuged using a tabletop mini-centrifuge for 3 s to sediment any sporangia in the sample. The meiospores were then pelleted by centrifugation at 16 000 × g for 2 min. To obtain C. lativittatus gametes, infected copepods containing the orange and amber mating types were separated prior to copepod lysis. Liquid was removed, then copepods were surface-sterilized by rinsing in 70% ethanol and then washed with double-distilled water to reduce contaminants. After the gametes were released from the copepods, the copepod carcasses were removed by allowing them to settle in the microcentrifuge tube and the supernatant containing the gametes was transferred to a new tube. Samples were spun for 3 min at 6000 × g to pellet the gametes, and the supernatant was removed.
DNA was extracted from the resulting meiospore and gamete pellets using a Qiagen genomic DNA purification kit with Qiagen 20/G genomic-tips following the standard manufacturer protocol (Qiagen, Hilden, Germany). DNA was then amplified using the Qiagen REPLI-g whole genome amplification kit according to the standard manufacturer protocol. Illumina libraries were prepared with the NEBNext Ultra DNA Library Prep Kit (New England Biolabs, Ipswich, Massachusetts). Libraries were sequenced on an Illumina HiSeq 2500 system (San Diego, California) with 100 bp paired-end sequencing by the University of California Riverside Genomics Core Facilities.
RNA extraction and library preparation.—
For transcriptome analysis of the sporophyte, hyphae were excised from infected fourth instar larvae of An. quadrimaculatus during either early, middle, or late stages of fungal development. For the purpose of this study, we define early, middle, and late infection stages as follows. Typically, the early stage of obvious infection appears as a few unpigmented, i.e., white, sporangia at the tips of hyphae about 6 days after molting to the fourth instar. The fat body in these larvae is quite well developed, and hyphae can be seen adhering to this tissue in each of the larval abdominal segments and in the thorax. The middle stage occurs over days 7 and 8, during which the number of sporangia increases significantly, with most being mature, meaning rusty brown in color. The late stage occurs during days 9 and 10, by which time many larvae are full of sporangia and die, although many other larvae survive another 4 to 5 days before dying. These larvae continue to grow, being at least twice the size at which healthy larvae pupate. Two replicate samples were collected from each time point.
For the sporangial transcriptomes, mosquito larvae with advanced infections were collected when full of sporangia, within a day or two of death. To induce sporangia to undergo meiosis and germinate, each larva was surface-sterilized by rinsing it in 70% ethanol for 20s, after which each was placed in 1 mL of double-distilled water in a 22-mm plastic Petri dish at room temperature. The sporangia were excised from the larvae using jeweler’s forceps, after which the cuticle and midgut were removed from the water. Typically, the sporangia dehisced, releasing meiospores, 48–72 h after incubation at room temperature. Sporangia were collected at 0, 24, 36, and 48 h time points starting from the period the sporangia were excised from the mosquito larva (0 h) through dehiscence (48 h), when the uniflagellate meiospores burst out of the sporangia. Samples were collected using a 1-mL pipette and centrifuged using a tabletop mini-centrifuge for 3 s to obtain the sporangia in the sample. Two replicate samples were collected from each time point.
RNA from all samples was extracted with TRIzol (Life Technologies, Grand Island, New York) as per the manufacturer protocol; 1.2 μg of RNA was used as the starting material for the NEBNext Ultra Directional RNA Library Prep Kit for Illumina (New England BioLabs, Ipswich, Massachusetts). Poly-A RNA was purified as per instructions and converted to adapter-ligated, size-selected cDNA. An aliquot of the library was cloned into pJET1.2 (Thermo Fisher Scientific, Waltham, Massachusetts) and clones sequenced with standard methods to check library quality. An aliquot was also run on a 2100 Bioanalyzer system (Agilent Technologies, Santa Clara, California). The resulting sequencing libraries were sequenced by the Institute for Integrative Genome Biology Core Facility at the University of California Riverside using the MiSeq instrument with 100 bp paired-end reads (Illumina).
Genome assembly.—
Genomes for the meiospore (MEIOSPORE), orange gamete (ORANGE), and amber gamete (AMBER) libraries were assembled using the Automatic Assembly of the Fungi (AAFTF) pipeline 0.2.3 (Stajich and Palmer Citation2019). Briefly, this involved first trimming and filtering reads using bbduk.sh from BBTools 37.76 (Bushnell Citation2014). Next, assemblies were produced using the “assemble” command in AAFTF, which relies on SPAdes 3.12.0 (Prjibelski et al. Citation2020) run with default parameters to select optimal k-mer size, and screened for contaminant vectors with AAFTF “vecscreen” step using National Center for Biotechnology Information (NCBI) BLAST (Camacho et al. Citation2009). The AAFTF “sourpurge” step was run, which utilizes sourmash 3.5.0 (Brown et al. Citation2016) to further purge any remaining contaminant contigs, and AAFTF “rmdup” step using Minimap2 2.17 (Li Citation2018) was run to identify duplicate contigs for removal. Finally, AAFTF “polish” step ran Pilon 1.22 (Walker et al. Citation2014) to polish the resulting contigs in each assembly to remove potentially mis-called consensus nucleotides or indels by SPAdes.
Assembly evaluation for each genome was performed using QUAST 5.0.0 (Gurevich et al. Citation2013) and BUSCO 5.0.0 (Simão et al. Citation2015) against both the eukaryote_odb10 and fungi_odb10 gene sets. BUSCO assessment was also performed for reference genomes from other fungal lineages for comparison (for lineages, see SUPPLEMENTARY TABLE 1). We performed telomere searches against the Coelomomyces assemblies using find_telomeres.py (https://github.com/markhilt/genome_analysis_tools) to test for telomeric repeats at the ends of the scaffolds and determine chromosome completeness (Hiltunen et al. Citation2021).
Contamination screen and removal.—
Given the obligate nature of C. lativittatus with its hosts, microbial contamination was assessed in each assembly using the BlobTools2 pipeline (SUPPLEMENTARY FIG. 1) (Challis et al. Citation2020). This involved first assigning taxonomy against the UniProt Reference Proteomes database (2020_10) to each contig using DIAMOND (2.0.4) and command line BLAST 2.2.30+ (Buchfink et al. Citation2021; Camacho et al. Citation2009). Next, read coverage was calculated by aligning the reads from the MEIOSPORE, AMBER, and ORANGE libraries to their respective genome assemblies with BWA 0.7.17 (Li and Durbin Citation2009) and sorted using SAMtools 1.11 (Li et al. Citation2009). Finally, the BlobToolKit Viewer was used to visualize the GC content, read coverage, and predicted taxonomies of contigs to identify contaminants. This approach flagged 1969, 11, and 24 contigs as putative contaminants in the AMBER, MEIOSPORE, and ORANGE assemblies, respectively.
Microbial contamination was further assessed with the anvi’o 7 pipeline (Eren et al. Citation2015, Citation2021), a complementary method, for the AMBER assembly given the large number of contaminants predicted by BlobTools2 (SUPPLEMENTARY FIG. 1). This involved first obtaining read coverage from each of the three genomic samples (AMBER, ORANGE, and MEIOSPORE) to the AMBER assembly with bowtie2 2.4.2 (Langmead et al. Citation2009) and SAMtools 1.11 (Li et al. Citation2009). A contig database for the AMBER assembly was then generated using “anvi-gen-contigs-database,” which uses Prodigal 2.6.3 (Hyatt et al. Citation2010) to predict open reading frames (ORFs). This command also identifies single-copy bacterial (Lee Citation2019), archaeal (Lee Citation2019), and protist (Delmont Citation2018) genes using HMMER 3.2.1 (Eddy Citation2011) and ribosomal RNA genes using barrnap (Seemann Citation2018). We predicted taxonomy for each predicted ORF using Kaiju 1.7.2 (Menzel et al. Citation2016) with the NCBI BLAST non-redundant protein database nr including fungi and microbial eukaryotes, 2020-05-25 update. We then constructed anvi’o profiles for each sample (AMBER, ORANGE, and MEIOSPORE) using “anvi-profile” with the “–cluster-contigs” option and a contig length cutoff of >2.5 kbp. These profiles were then merged using “anvi-merge.” Contaminant contigs in the AMBER assembly were then identified through “anvi-interactive” using a combination of hierarchical clustering based on coverage and tetranucleotide frequency, taxonomic identity, and GC content. This second method identified 1127 contaminant contigs in the AMBER assembly.
Contaminant contigs (e.g., any contig identified by the BlobTools2 pipeline as assigned to bacteria, archaea, or viruses and any contig identified using the anvi’o pipeline) were subsequently removed from the draft assemblies. For the AMBER assembly, this meant conservatively removing a total of 2091 contaminant contigs (1005 identified by both methods, 964 contigs identified by BlobTools2 only, and 122 identified by anvi’o only).
Genome annotation.—
Genome annotation was performed using the Funannotate pipeline 1.7.4 (Palmer and Stajich Citation2020). This first involved using RepeatModeler 1.0.11 (Flynn et al. Citation2020) and RepeatMasker 4.0.7 (Smit et al. Citation2013–2015) to generate a library of predicted repetitive elements and then soft mask these elements in the draft genomes. Next the RNA-sequencing (RNAseq) data were assembled using Trinity 2.10.0 in Genome-Guided mode and aligned with PASA 2.3.3 to train the ab initio gene prediction algorithms AUGUSTUS and SNAP (Grabherr et al. Citation2011; Haas et al. Citation2003). Consensus gene models were generated using EVidenceModeler 1.1.1 (Haas et al. Citation2008) on predicted protein-coding gene models from a combination of algorithms including CodingQuarry 2.0, AUGUSTUS 3.3.3, GeneMark-ETS 4.38, GlimmerHMM, and SNAP 2013_11_29 (Korf Citation2004; Majoros et al. Citation2004; Stanke et al. Citation2006; Ter-Hovhannisyan et al. Citation2008; Testa et al. Citation2015). Transfer rRNA genes were predicted using tRNAscan-SE 1.3.1 (Lowe and Eddy Citation1997). Protein annotations were predicted for the consensus gene models based on similarity to Pfam (Finn et al. Citation2014), CAZyme domain (Huang et al. Citation2018; Lombard et al. Citation2014), MEROPS (Rawlings et al. Citation2014), eggNOG 1.0.3 (Huerta-Cepas et al. Citation2016), InterProScan 5 (Jones et al. Citation2014), and Swiss-Prot (Boutet et al. Citation2016) databases using HMMER 3 (Eddy Citation2011) or DIAMOND BLASTp (Buchfink et al. Citation2015). Phobius (Käll et al. Citation2004) and SignalP 4.1c (Armenteros et al. Citation2019) were also run to predict transmembrane proteins and secreted proteins, respectively. Any problematic gene models that were flagged by Funannotate were manually curated as needed. The annotation results were summarized in custom code written in R 4.0.3 using the tidyverse 1.3.0 package (R Core Team Citation2020; Wickham et al. Citation2019). The annotated genomes of the MEIOSPORE, ORANGE, and AMBER assemblies were aligned and mapped to the RNA sequencing reads using HISAT2 (Kim et al. Citation2019).
Transcriptome analysis.—
Given the obligate relationship of Coelomomyces with its hosts, we chose a reference-based transcriptome approach, as initial results from de novo approaches revealed host contamination even after removal using a reference host transcriptome. To provide a more comprehensive gene set to use as a reference for transcriptome analysis, we combined the predicted transcript sets from all three genome annotations. We then used CD-HIT-EST to cluster transcripts at 90% sequence identity and evaluated this combined set (AOM90) with BUSCO 5.0.0 (Fu et al. Citation2012; Simão et al. Citation2015). For comparative purposes, a protein alignment of C. lativittatus with other fungal lineages (for lineages, see SUPPLEMENTARY TABLE 1), was constructed using the PHYling_unified (https://github.com/stajichlab/PHYling_unified) pipeline, which uses HMMER 3 (Eddy Citation2011) and ClipKIT (Steenwyk et al. Citation2020) to search for markers in the protein sequences and build and trim an alignment based on BUSCO fungi_odb10 hidden Markov models (HMMs). A maximum likelihood phylogeny was built from this alignment using IQ-TREE2 2.2.0 (Minh et al. Citation2020). BUSCO fungi_odb10 gene partitions were provided to IQ-TREE2 using -p (Chernomor et al. Citation2016) and ModelFinder Plus was run using -m MFP to ensure use of the best evolutionary model for each partition based on Bayesian information criterion (BIC) (Kalyaanamoorthy et al. Citation2017).
Mosquito host transcripts were removed from the transcriptome data using BBMap against an An. quadrimaculatus (accession: GBTE00000000) reference transcriptome prior to read quantification (Bushnell Citation2014; Desjardins et al. Citation2015). Host-filtered transcriptome read counts were quantified against the AOM90 transcript set using kallisto (Bray et al. Citation2016). The count data were then imported into R for analysis with the DESeq2, ggplot2, and GSEABase packages (Love et al. Citation2014; Morgan et al. Citation2022; R Core Team Citation2020; Wickham Citation2009).
General expression trends across all samples were visualized using variance-stabilized count data. We then used DESeq2 to identify differentially expressed transcripts between life stages (e.g., sporangial vs. infection). Significant genes were defined as transcripts with a false discovery rate–adjusted P-value of <0.01 and a |log2 fold change| >2. Gene Ontology (GO) enrichment analysis was performed to assess whether the differentially expressed transcripts were significantly enriched in any particular functions (P < 0.05). This analysis was performed at each of three GO classes: biological processes (BP), molecular functions (MF), and cellular components (CC). Significantly enriched GO terms were simplified using REVIGO with the default settings (Supek et al. Citation2011).
In order to identify transcripts that show change in expression across the development time course conditions within each sporangial (e.g., 0 h vs. 24 h vs. 32 h vs. 48 h) and infection (e.g., early vs. middle vs. late infection) stage, we performed a likelihood-ratio test (LRT). Significant transcripts from LRTs were filtered with a false discovery rate–adjusted P-value of <0.01 and a |log2 fold change| >2. The DEGreport package was used to cluster genes with similar expression profiles based on the LRT results across different time series conditions (Pantano Citation2022). A GO enrichment analysis was performed to identify enriched GO terms in each of the clusters with similar expression patterns (P < 0.05). GO terms were simplified using REVIGO with default settings (Supek et al. Citation2011).
Identification of mating type (MAT) loci in C. lativittatus.—
To identify high mobility group–box (HMG-box) genes putatively involved in mating in the C. lativittatus genomes, we used HMMsearch 3.3.2 for Pfam PF00505, with an e-value of 1e-15 (Eddy Citation2011). Given that genes neighboring HMG-boxes are thought to be involved in mating in other fungi (van de Vossenberg et al. Citation2019), we used clinker (Gilchrist and Chooi Citation2021) and cblaster (Gilchrist et al. Citation2021) to assess the syntenic regions surrounding the HMG-boxes in the Coelomomyces assemblies to identify conserved regions neighboring HMG-boxes. To confirm phylogenetic placement of the identified HMG-box genes, we aligned the candidate genes from C. lativittatus with those of other fungi (for fungi used, see SUPPLEMENTARY TABLE 1) using HMMalign (Eddy Citation2011). We then constructed a maximum likelihood phylogenetic tree of the HMG-box genes using IQ-TREE using the VT+R6 model, which was selected by ModelFinder Plus (Minh et al. Citation2020). Finally, to compare expression of HMG-box genes across C. lativittatus life stages, the variance-stabilized expression levels of the HMG-box genes were plotted using ggplot2 (Wickham Citation2009). Pairwise t-tests were performed to assess differential expression between life stages.
Identification of orthologous gene expansions relative to other fungal lineages.—
OrthoFinder 2.5.4 was used to identify whether any differentially expressed transcripts represented genes expanded in copy number in C. lativittatus compared with other fungi (for fungi used, see SUPPLEMENTARY TABLE 1) (Emms and Kelly Citation2019). We filtered the OrthoFinder results to orthogroups containing genes with differentially expressed transcripts in the RNAseq data. These results were subsetted by orthogroups that were at least |log2 fold change| > 2 higher in copy number in C. lativittatus compared with the other fungi. Orthogroup expansions were confirmed through phylogenetic analyses. Briefly, a nucleotide alignment of all genes in an orthogroup of interest was produced using MUSCLE 5.1, and then a phylogenetic tree was built with IQ-TREE2 using -m MFP, which runs ModelFinder Plus (Kalyaanamoorthy et al. Citation2017).
RESULTS
Over half of the genomic landscape is represented in C. lativittatus assemblies and annotations.—
After successful contaminant removal, the draft genome assemblies ranged in size from 5002 to 5799 contigs, with a total length between 19.8 and 22.8 Mb (). Although the assemblies were fragmented, with an average N50 of 6128 bp, BUSCO assessment found that the draft assemblies were halfway complete (SUPPLEMENTARY TABLE 2). Mean completeness values in “genome” mode were 43.1% and 56.3% using the fungi_odb10 and eukaryota_odb10 sets, respectively. Although these values were lower than those of other blastoclads on average (fungi_odb10: 75.5%, eukaryota_odb10: 83.8%), including a recent long-read genome from B. emersonii (fungi_odb10: 81.8%) (Leonard et al. Citation2022), it is important to note that BUSCO sets are biased against early-diverging fungal lineages. Nonetheless, these draft assemblies provide a valuable starting point for further improvement and refinement moving forward.
Table 1. Genome assembly and annotation statistics.
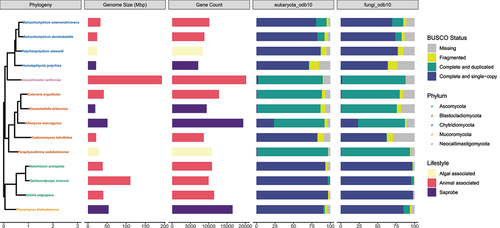
Annotation of the three assemblies with Funannotate identified on average 7416 protein-coding genes and 59 tRNA genes, with 63.2% of these having a hit to at least one functional database (). We combined the three predicted transcript sets together at 90% identity using CD-HIT-EST to generate a comprehensive final gene set (AOM90) of 8645 transcripts, leading to improved BUSCO “protein” scores of 62.5% and 82.8% using the fungi_odb10 and eukaryota_odb10 sets, respectively (SUPPLEMENTARY TABLE 2; SUPPLEMENTARY FIG. 2). Despite being slightly lower than the average scores for other blastoclads (; fungi_odb10: 84.1, eukaryota_odb10: 90.1%), the AOM90 transcript set represents a promising and robust reference for beginning to elucidate C. lativittatus biology.
Figure 2. C. lativittatus protein set is comparable to those of other fungal taxa.From left to right, first, a maximum likelihood phylogeny that shows the relationship of C. lativittatus to other fungal lineages. This tree was generated using IQ-TREE2 on an alignment of BUSCO fungi_odb10 HMMs constructed using the PHYling_unified pipeline. Taxon labels in the phylogeny are shown colored by assigned fungal phylum. Next, in association with this phylogeny, a bar chart of the draft genome size (Mbp) for each taxon with genome size colored by fungal lifestyle (saprobe = purple, algal associated = yellow, animal associated = pink), followed by a bar chart of predicted gene counts for each taxon with counts colored by fungal lifestyle. Next, bar charts of BUSCO “protein” completion status for the eukaryota_odb10 and fungal_odb10 sets. Bars show the percentage of genes found in each genome annotation as a percentage of the total gene set and are colored by BUSCO status (missing = gray, fragmented = yellow, complete and duplicated = green, complete and single copy = blue). The values depicted here for C. lativittatus gene counts and BUSCO scores are based on the combined clustered transcript set (AOM90), and the genome size is the average size across all three assemblies. The BUSCO scores for individual C. lativittatus assemblies can be seen in SUPPLEMENTARY FIG. 2.
Differential expression analysis reveals distinct expression profiles between life stages.—
Initial analysis of the transcriptome profiles supported a distinct divide between infection and sporangial life stages, with each stage clustering separately () and clear differences in expression in the most abundant differentially expressed transcripts (). We followed this analysis with differential transcript expression analysis using DESeq2 to identify specific transcripts responsible for these patterns.
Figure 3. Transcript expression differs between C. lativittatus life stages. A. Principal component analysis (PCA) of variance-stabilized transcriptomic count data. Samples are colored by time points, whereas shapes are used to broadly represent life stages (circle = infection, triangle = sporangial). Ellipses represent the 95% confidence interval around the centroid of each life stage. Replicate samples may be overlapping. B. Heatmap showing the variance-stabilized counts of the 25 most expressed transcripts with differential expression across life stages. Replicates are indicated by “A” or “B.”
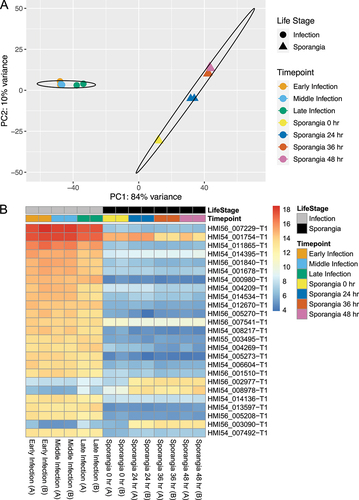
We found 1262 differentially expressed transcripts between life stages, with 395 transcripts enriched during infection compared with 867 enriched during sporangial life stages (P < 0.01, log2 fold change > 2). Of these, 575 (45.6%) had no matches to any of the databases used for annotation. Interestingly, although more transcripts were enriched in sporangial stages, many of the most abundant transcripts were representative of transcripts enriched in the infection stages and many of these transcripts were unannotated. For example, of the top 25 most abundant differentially expressed transcripts, 22 were up-regulated during infection relative to sporangial stages (). Further, 18 of these 25 transcripts had no significant similarity to any features in the annotation databases, and only one transcript was fully annotated, HMI54_014395 (ERG10), an acetyl-CoA C-acetyltransferase.
We performed GO enrichment analysis on the differentially expressed transcripts to identify enriched GO terms of interest (SUPPLEMENTARY TABLE 3; P < 0.05). For the infection stages, GO terms from 38 biological processes (BP), 9 cellular compartments (CC), and 46 molecular functions (MF) were identified. Of these, seven of the top 10 significantly enriched BP were metabolic processes (e.g., GO:0006082: organic acid metabolic process, GO:0046394: carboxylic acid biosynthetic process) and three were transport related (GO:0006848: pyruvate transport, GO:1905039: carboxylic acid transmembrane transport, GO:1901475: pyruvate transmembrane transport). For the sporangial stages, GO terms from 35 BP, 26 CC, and 41 MF were identified. Of these, the most significantly enriched BP was related to reproduction (GO:0000003: reproduction), with four of the top 10 significantly enriched biological processes related to metabolic and biosynthetic processes (GO:0005975: carbohydrate metabolic process, GO:0006183: GTP biosynthetic process, GO:0006228: UTP biosynthetic process, GO:0006793: phosphorus metabolic process) and three related to movement or organization of cellular machinery (GO:0006928: movement of cell or subcellular component, GO:0007010: cytoskeleton organization, GO:0007017: microtubule-based process).
Differential expression analysis reveals complex pattern of expression clusters within life stages.—
Identification of differentially expressed transcripts across the development time course within sporangial and infection stages was done using a likelihood-ratio test (LRT). We found 380 transcripts that were significantly differentially expressed between infection stages (P < 0.01). Of these, we found two clusters of differentially expressed transcripts with similar expression patterns in each, group 1 and group 2 with 167 and 213 transcripts, respectively (). The same analysis with the sporangial stages indicated 3701 differentially expressed transcripts (P < 0.01), out of which we identified seven clusters, each including differentially expressed transcripts with similar patterns of expression. There were 1083, 965, 859, 219, 355, 156, and 64 genes in groups 1 to 7, respectively ().
Figure 4. Transcript expression differs across the development time course conditions in each sporangial and infection stage. A. The plots on the left are the two possible groups with specific transcript expression patterns across early, middle, and late infection time points and number of transcripts in each group. The table on the right shows the top five enriched GO terms for each of the groups of transcripts. B. The plots on the left are the seven groups with specific transcript expression patterns across the 0, 24, 36, and 48 h time points within the sporangial life stages. The table on the right shows the top five enriched GO terms for each of the seven groups of transcripts.
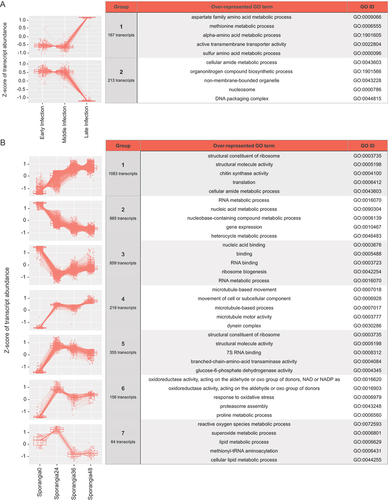
In order to identify enriched GO terms of interest, we performed GO enrichment analysis on the differentially expressed transcripts across the developmental conditions within infection and sporangial stages (SUPPLEMENTARY FIG. 3; P < 0.05). Within the infection stages, we found 30 BP, 12 CC, and 33 MF enriched GO terms. Of these, the top significantly enriched GO terms were in the CC category (GO:0000786: nucleosome, GO:0043228: non-membrane-bounded organelle, GO:0043232: intracellular non-membrane-bounded organelle, GO:0044815: DNA packaging complex, GO:0032993: protein-DNA complex) and were also seen in group 2, with decreasing expression across infection stages ().
Furthermore, we found 19 BP, 10 CC, and 28 MF enriched GO terms represented within the sporangial stages, of which the most significantly enriched GO terms were related to structural molecule activity and binding (GO:0005488: binding, GO:0003735: structural constituent of ribosome, GO:0004100: chitin synthase activity, GO:0005198: structural molecule activity, GO:0003779: actin binding) as well as the GO terms related to peptide biological processes (GO:0006412: translation, GO:0043043: peptide biosynthetic process, GO:0006518: peptide metabolic process). Terms related to structural molecule activity and binding were generally seen in expression pattern groups 1 and 5, both of which generally increased in expression over time ().
HMG-box loci were identified with differential expression across life stages.—
A total of five unique HMG-box genes were identified, with all five HMG-box genes present in the MEIOSPORE assembly and three in each of the AMBER and ORANGE assemblies. The identified HMG-box genes were found on small, fragmented contigs (average: 8300 bp) that contained only a few neighboring genes (average: 3 genes). Despite their small size, synteny analysis across the three assemblies found that the AMBER and ORANGE assemblies share two HMG-box loci with each other. The third HMG-box genes in the ORANGE and AMBER assemblies were only shared with the MEIOSPORE assembly, which has four syntenic orthologous HMG-boxes (SUPPLEMENTARY FIG. 4). We tested the five HMG-box loci in C. lativittatus for synteny against Allomyces macrogynus to determine whether neighboring genes around HMG-boxes are conserved in sexually reproducing chytrids (Lee et al. Citation2010). We were unable to determine synteny of neighboring genes around HMG-box loci, possibly due to the fragmented scaffolds where these genes are found in our C. lativittatus assemblies. Phylogenetic analyses of the HMG-box genes showed that four of the HMG-box genes generally fell in clades with other blastoclads or chytrids, whereas HMI54_015288 fell into a clade with Dikarya. Further, three of the five HMG-box orthologs from C. lativitattus (HMI56_006544, HMI55_007199, and HMI54_004920) were present in a clade containing known mating-related HMG-boxes (SUPPLEMENTARY FIG. 5). HMI56_006544 and HMI54_004920 were present in all three C. lativitattus assemblies, whereas HMI55_007199 was only present in the ORANGE assembly. Interestingly, HMI56_006544 is closely related to SexM in Phycomyces blakesleeanus; however, we were unable to identify a SexP homolog in C. lativitattus. The number of identified HMG-box genes here is in line with that of other blastoclads (i.e., Blastocladiella britannica and Catenaria anguillulae; ). Of the five identified HMG-box genes, HMI54_015288 was significantly overexpressed in the infection stages compared with the sporangial stages (SUPPLEMENTARY FIG. 6; P < 0.01).
Figure 5. C. lativittatus copy number for HMG-box, RIF1, chitin deacetylase, Egh16-like, and AMPK1 gene orthogroups compared with other fungi. A heatmap is depicted here, organized by fungal phylogenetic relationships, depicting the copy number of orthologous genes, representing differentially expressed transcripts, with expanded gene counts in C. lativittatus relative to other fungi. The colors of the gene counts are normalized per gene family, with red indicating a high normalized count and blue indicating a low count. The phylum for each taxon is indicated by the colored row labels on the left. The dendrogram above the heatmap clusters the columns by similarity in counts between the different gene families. Validated HMG-boxes were found in two orthogroups, which are shown combined here for simplicity.
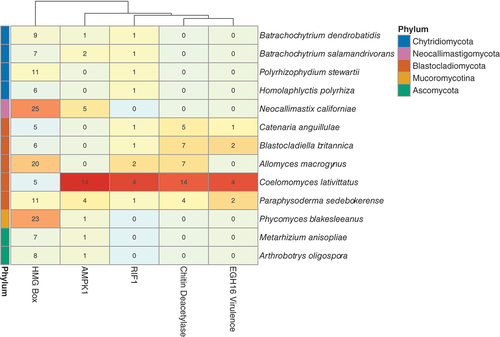
C. lativittatus may have expanded gene families of orthologs related to its unique life history.—
In order to determine whether gene families expanded in C. lativittatus, we performed OrthoFinder analysis, comparing C. lativittatus with other fungal taxa. In total, we identified 37 398 orthogroups among the fungal taxa. Of these, 182 orthogroups were exclusively present in C. lativittatus and absent in all other fungal taxa.
We identified 10 orthogroups that both contained genes with differentially expressed transcripts and were expanded in copy number compared with other fungi. Of these 10 orthogroups, only four had predicted functional annotations (). We tested the four orthogroups for duplication errors and removed any sequences that appeared truncated or had 100% sequence similarity to an ortholog from a different C. lativittatus assembly. Most of the copy number expansions for these four orthogroups appeared to occur on clades exclusive to C. lativittatus. The putative functions for the four validated orthogroups were replication timing regulatory factor 1 (RIF1), chitin deacetylase, adenosine monophosphate (AMP)-activated protein kinase 1 (AMPK1), and Egh16-like virulence factor. Within these orthogroups, only the RIF1 orthogroup contained a gene that had higher expression in infection stages; the other three orthogroups had genes with higher expression during sporangial stages.
DISCUSSION
C. lativittatus annotated genomes are an important community resource.—
The genomes assembled and annotated here, though partial, are a promising and critical community resource, as little genomic data exist for members of the Blastocladiomycota. The smallest public genome is B. britannica, with a genome size of 19 Mb with 9431 predicted gene models, and the largest is Allomyces macrogynus, with a genome size of 47 Mb and 19 446 predicted genes (Grigoriev et al. Citation2014). C. lativittatus falls on the shorter end of this range, with an average genome length of 21.5 Mb and average 7475 predicted gene models, possibly due to the incomplete nature of the draft genomes reported here. Although the three C. lativittatus genomes assembled and annotated in this study are partial, we think that they provide much needed community resources for study of these obligate fungi. For example, the phylogenetic placement of Blastocladiomycota has been disputed, but inclusion of additional genomes such as those reported here can help elucidate these ancient phylogenetic relationships (Amses et al. Citation2022).
Transcriptomic landscape of C. lativittatus life stages provides insight into Blastocladiomycota biology.—
The transcriptome of C. lativittatus is a complex, dynamic, and underexplored landscape. The results of this study highlight a need for future refinement and exploration of gene annotation in this species, as evidenced by the 45.6% of differentially expressed transcripts with no annotation and the majority of the top 25 abundant differentially expressed transcripts lacking functional annotation. In spite of these shortcomings, we were able to gain generalizable insights into C. lativittatus biology from the subset of transcripts that were annotated with GO terms. Overall, during infection, GO terms related to metabolism and transport processes were enriched, whereas during sporangial stages GO terms related to dispersal (i.e., cell signaling, locomotion, and transport machinery) were enriched. Looking at the expression patterns within life stages, we can begin to see more complicated trends emerge.
Within infection stages, we identified two different patterns of gene expression. In the first pattern, gene expression increased over the course of development time (early, middle, and late infection), with enriched GO terms related to membrane transport and metabolic processes. In the second pattern, gene expression decreased over time, with enriched GO terms related to DNA replication and nucleic acid and amino acid biosynthetic processes.
The enrichment of metabolism and membrane transport processes in the transcriptomes during infection stages is similar to reports from other early-diverging fungal lineages. Up-regulation of transport-related pathways has been reported in chytrid infection of frog hosts, which the authors suggest might be related to nutrient availability and proliferation related to host association (Ellison et al. Citation2017). Further, in Vavraia culicis (Microsporidia), enriched GO terms for growth, metabolism, and replication were identified and posited to be related to its generalist lifestyle and ability to infect multiple types of hosts (Desjardins et al. Citation2015). Here, we observed an enrichment of metabolism terms as part of a pattern of increasing expression (group 1, ) and an enrichment of replication-related terms as part of a pattern of decreasing expression (group 2, ). Thus, we may be observing a shift in priorities during infection, with early infection stages marked by increased replication as hyphagens grow into coenocytic hyphae inside the host and later infection stages marked by increased metabolism as the fungus proliferates and begins preparing to make sporangia.
Within sporangial stages, we identified seven expression patterns, with two patterns displaying higher expression over these developmental stages, two patterns displaying lower expression, and three patterns with a relatively higher gene expression at the second time point (24 h), followed by stable or decreasing expression. In general, expression patterns with higher expression were enriched in GO terms related to chitin activity as well as terms related to dispersal- and microtubule-based processes. In decreasing expression patterns, the enriched GO terms were mostly related to metabolism and transcription. The other three expression patterns, which displayed the highest expression at the second developmental time point, were functionally different from each other. One group was enriched in GO terms related to dispersal and structural machinery, another in terms related to oxidative stress responses, and the third in terms related to lipid metabolism. Similarly, time series clustering of the transcriptome profiles of differentially expressed genes during the sporulation of the blastoclad Blastocladiella emersonii showed eight different patterns (Vieira and Gomes Citation2010).
The enrichment of reproduction- and dispersal machinery–related mechanisms during the sporangial stages likely relates to the production of meiospores. For example, signal transduction and microtubule and cytoskeleton biogenesis were similarly reported to be enriched during sporulation in B. emersonii (Vieira and Gomes Citation2010). These authors also observed a decrease in transcription and metabolism during sporulation, which they attributed to the nutritional starvation required in order to sporulate. Additionally, previous investigations into protein synthesis in chytrids (Léjohn and Lovett Citation1966) and blastoclads (Lovett Citation1968; Schmoyer and Lovett Citation1969) suggest that translation does not occur until zoospore germination and that zoospores are likely partially dependent on maternal mRNA and ribosomes for initial protein production. Laundon et al. (Citation2022) posited that the chytrid zoospore life stage is optimized for dispersal to new hosts rather than general metabolism. The authors also reported complex lipid dynamics throughout the life cycle of the chytrid Rhizoclosmatium globosum. Of particular note, they observed increased expression of genes related to lipid transport and metabolism in zoospores, which often have large amounts of intracellular storage lipids. In this study, across sporangial stages, we observed an enrichment of dispersal- and microtubule-based terms as part of patterns with increasing expression and transcription terms as part of patterns with decreasing expression (). We also observed one pattern of increasing and then decreasing expression related to lipid metabolism (group 7, ). Therefore, here we may be discerning the metabolic preparation and production of meiospores for optimal dispersal, survival, and host identification.
Later stages of host association are likely characterized by increased immune response in the host and countered by increased stress response by the fungus in order to continue to evade the host immune system. Up-regulation of stress response genes has been reported in the plant pathogen Zymoseptoria tritici during late stages of sporulation in its host, which the authors posited might be protective (Keon et al. Citation2005). Similarly, we observed an enrichment of terms related to oxidative stress responses in the later stages of sporulation (group 6, ), which we speculate may assist Coelomomyces evade host defenses during meiospore production.
Mating type genes may be useful for future work on evolution of sex in fungi.—
Unlike in animals and plants, which have sex-specific chromosomes, sex determination in fungi is regulated by only a handful of genes. These mating type (MAT) loci include HMG-box genes (Benkhali et al. Citation2013). Although MAT loci in Dikarya have been widely studied (Wallen and Perlin Citation2018), the MAT loci of early-diverging lineages of fungi have received relatively less attention (Idnurm et al. Citation2008). Given its obligate sexual two-host alternation of generations life cycle and the ability to separate sexed haploid gametes by color (orange or amber), C. lativittatus provides an intriguing system for investigating the evolution of sex in early-diverging fungi. Using the genomes generated here, we identified five putative HMG-box genes, including one gene, HMI54_0015288, that was differentially expressed between life stages and three genes that were in a clade with known mating-related genes. Additionally, HMI56_006544, which was highly expressed during the sporangial stage, is homologous to the SexM gene of Phycomyces blakesleeanus. Interestingly, the three C. lativitattus HMG-boxes within the clade containing mating-related genes were up-regulated in the sporangial stage. Future work should tease apart the role in mating of these putative HMG-box genes in C. lativittatus and also place these genes in a comparative framework in order to further investigate the evolution of sex determination in fungi.
Ortholog expansions in C. lativittatus may be related to host association.—
Compared with other fungal lineages, C. lativittatus genomes had an enriched number of gene copies in four orthologs with functional annotations representing chitin deacetylase, AMPK1, Egh16-like virulence factor, and RIF1 (). We believe these expanded orthogroups may be good candidates for future investigations elucidating mechanisms behind C. lativittatus–host interactions.
In C. lativittatus, we found that members of the chitin deacetylase orthogroup were up-regulated during sporangial stages and that “chitin synthase activity” was also an enriched GO term in group 1, which is a group represented by increasing expression (). Chitin deacetylases catalyze the deacetylation of chitin, an important structural component of fungal cell walls and insect cuticles, and have been previously reported in many fungal species (Zhao et al. Citation2010). Chitin-binding proteins and chitin deacetylation are thought to protect fungal pathogens against plant chitinases during infection (Gueddari et al. Citation2002; van den Burg et al. Citation2006) and have also been shown to be up-regulated during infection of amphibian hosts by the chytrid pathogen Batrachochytrium dendrobatidis (Ellison et al. Citation2017). Further, the B. dendrobatidis genome has gene expansions of chitin-binding proteins, which can confer protection against chintanse activity when expressed in the fungus Trichoderma reeseii (Abramyan and Stajich Citation2012; Liu and Stajich Citation2015). Thus, it is possible that the expansion in the chitin deacetylase orthogroup here may be related to C. lativittatus defense against its two hosts.
AMPK1 genes are sensors that modulate energy metabolism and homeostasis and can be important for regulating stress responses (Hardie et al. Citation2012). These genes can also be used to alter host energy metabolism by microbial pathogens (Mesquita et al. Citation2016). Increased counts of AMPK1 orthologs and higher expression in sporangial stages in C. lativittatus may be related to regulation of increased stress during its two-host life cycle or to evasion of host immune detection.
In C. lativittatus, we found that members of the Egh16-like expanded orthogroup displayed higher expression during sporangial stages. Egh16-like virulence factors are proteins related to appressorium formation and pathogenesis that are present in pathogenic fungi, including insect pathogens such as Metarhizium acridum (Cao et al. Citation2012; Grell et al. Citation2003). Egh16-like factors have been postulated to aid in the penetration of insect cuticles (Cao et al. Citation2012). Thus, it is possible that the expanded Egh16-like virulence factor orthogroup is contributing to C. lativittatus virulence.
RIF1 is important for telomere length control and subtelomeric silencing in fungi and other eukaryotes (Sreesankar et al. Citation2012). Subtelomeric regions have increased variability, caused by duplications and rearrangements that can result in functional novelty, including secondary metabolites related to pathogenicity and virulence. Silencing of subtelomeric regions is one way pathogens can control secondary metabolite expression (Diotti et al. Citation2021; Wyatt et al. Citation2020). Given the increased expression of members of the expanded RIF1 ortholog during infection, these genes may have roles in silencing subtelomeric regions and may be another tool in the C. lativittatus toolbox for interacting with its hosts.
CONCLUSION
We generated three draft genomes and annotations for C. lativittatus and characterized the C. lativittatus transcriptome landscape across infection and sporangial life stages. Little is known about the genomic landscapes of blastoclads or zoosporic fungi; thus, the genomic and transcriptomic data described here represent a valuable foundational resource. In the transcriptome investigation, we identified differentially expressed transcripts and enriched GO terms that provide insight into the blastoclad life cycle, with infection stages marked by an enrichment of metabolism and transport processes and sporangial stages by dispersal-related processes. Further, C. lativittatus has an interesting obligate alternation of generations life cycle with two hosts, and here we found several ortholog expansions in virulence-related genes that may have roles in modulating its host-associated life cycle. As additional genomic data from other blastoclads and zoosporic fungi are generated, more powerful comparative approaches can be used to assess the evolutionary relationships of these lineages to other fungi, as well as better understand their complex life histories. We hope that this work sets the stage for these future studies by providing some foundational knowledge of these unique fungi.
Supplemental Material
Download Zip (2.7 MB)ACKNOWLEDGMENTS
We thank Jericho Ortañez for assistance in experiments for generating genomic DNA and RNA.
DISCLOSURE STATEMENT
No potential conflict of interest was reported by the author(s).
DATA AVAILABILITY STATEMENT
The decontaminated C. lativittatus genome assemblies and annotation are deposited at DDBJ/ENA/GenBank under the accessions JADGJU000000000, JADGJV000000000, and JADHYY000000000. The versions described in this paper are JADGJU010000000, JADGJV010000000, and JADHYY010000000. The raw sequence reads for the genome assemblies are available through BioProjects PRJNA631428, PRJNA631429, and PRJNA631430. The raw sequence reads for the transcriptome work are available under GEO accession GSE222209. Analysis scripts for this work are available on GitHub (https://github.com/stajichlab/Chytrid_Coelomomyces_Project) and archived in Zenodo (https://doi.org/10.5281/zenodo.7435008).
SUPPLEMENTARY MATERIAL
Supplemental data for this article can be accessed online at https://doi.org/10.1080/00275514.2023.2228182.
Additional information
Funding
LITERATURE CITED
- Abramyan J, Stajich JE. 2012. Species-specific chitin-binding module 18 expansion in the amphibian pathogen Batrachochytrium dendrobatidis. mBio. 3:e00150–12.
- Amses KR, Rabern Simmons D, Longcore JE, Mondo SJ, Seto K, Jerônimo GH, Bonds AE, Alisha Quandt C, Davis WJ, Chang Y, et al. 2022. Diploid-dominant life cycles characterize the early evolution of Fungi. Proc Natl Acad Sci. 119:e2116841119. doi:10.1073/pnas.2116841119.
- Armenteros JJA, Tsirigos KD, Sønderby CK, Petersen TN, Winther O, Brunak S, von Heijne G, Nielsen H. 2019. SignalP 5.0 improves signal peptide predictions using deep neural networks. Nat Biotechnol. 37:420–23.
- Benkhali JA, Coppin E, Brun S, Peraza-Reyes L, Martin T, Dixelius C, Lazar N, van Tilbeurgh H, Debuchy R. 2013. A network of HMG-box transcription factors regulates sexual cycle in the fungus Podospora anserina. PLoS Genet. 9:e1003642. doi:10.1371/journal.pgen.1003642.
- Boutet E, Lieberherr D, Tognolli M, Schneider M, Bansal P, Bridge AJ, Poux S, Bougueleret L, Xenarios I. 2016. UniProtKB/Swiss-Prot, the manually annotated section of the UniProt KnowledgeBase: how to use the entry view. Methods Mol Biol. 1374:23–54.
- Bray NL, Pimentel H, Melsted P, Pachter L. 2016. Near-optimal probabilistic RNA-seq quantification. Nat Biotechnol. 34:525–27. doi:10.1038/nbt.3519.
- Brown CT, Titus Brown C, Irber L. 2016. Sourmash: a library for MinHash sketching of DNA. J Open Source Softw. 1:27. doi:10.21105/joss.00027.
- Buchfink B, Reuter K, Drost H-G. 2021. Sensitive protein alignments at tree-of-life scale using DIAMOND. Nat Methods. 18:366–68. doi:10.1038/s41592-021-01101-x.
- Buchfink B, Xie C, Huson DH. 2015. Fast and sensitive protein alignment using DIAMOND. Nat Methods. 12:59–60. doi:10.1038/nmeth.3176.
- Bushnell B. 2014. BBMap: short read aligner for DNA and RNA-seq data. https://sourceforge.net/projects/bbmap/.
- Camacho C, Coulouris G, Avagyan V, Ma N, Papadopoulos J, Bealer K, Madden TL. 2009. BLAST+: architecture and applications. BMC Bioinform. 10:1–9. doi:10.1186/1471-2105-10-421.
- Cao Y, Zhu X, Jiao R, Xia Y. 2012. The Magas1 gene is involved in pathogenesis by affecting penetration in Metarhizium acridum. J Microbiol Biotechnol. 22:889–93. doi:10.4014/jmb.1111.11055.
- Challis R, Richards E, Rajan J, Cochrane G, Blaxter M. 2020. BlobToolKit – interactive quality assessment of genome assemblies. G3 Genes|Genomes|Genetics. 10:1361–74. doi:10.1534/g3.119.400908.
- Chernomor O, von Haeseler A, Minh BQ. 2016. Terrace aware data structure for phylogenomic inference from supermatrices. Syst Biol. 65:997–1008.
- Couch JN, Bland CE. 1985. The genus Coelomomyces. Orlando (FL): Academic Press, Inc.
- Delmont T. 2018. Assessing the completion of eukaryotic bins with anvi’o. http://merenlab.org/delmont-euk-scgs.
- Desjardins CA, Sanscrainte ND, Goldberg JM, Heiman D, Young S, Zeng Q, Madhani HD, Becnel JJ, Cuomo CA. 2015. Contrasting host–pathogen interactions and genome evolution in two generalist and specialist microsporidian pathogens of mosquitoes. Nat Commun. 6:7121. doi:10.1038/ncomms8121.
- Diotti R, Esposito M, Shen CH. 2021. Telomeric and sub-telomeric structure and implications in fungal opportunistic pathogens. Microorganisms. 9. p. 1405.
- Duplessis S, Lorrain C, Petre B, Figueroa M, Dodds PN, Aime MC. 2021. Host adaptation and virulence in heteroecious rust fungi. Annu Rev Phytopathol. 59:403–22. doi:10.1146/annurev-phyto-020620-121149.
- Eddy SR. 2011. Accelerated profile HMM searches. PLoS Comput Biol. 7:e1002195.
- Ellison AR, DiRenzo GV, McDonald CA, Lips KR, Zamudio KR. 2017. First in vivo Batrachochytrium dendrobatidis transcriptomes reveal mechanisms of host exploitation, host-specific gene expression, and expressed genotype shifts. G3 Genes|Genomes|Genetics. G3(7):269–78.
- Emms DM, Kelly S. 2019. OrthoFinder: phylogenetic orthology inference for comparative genomics. Genome Biol. 20:238. doi:10.1186/s13059-019-1832-y.
- Eren AM, Murat Eren A, Esen ÖC, Quince C, Vineis JH, Morrison HG, Sogin ML, Delmont TO. 2015. Anvi’o: an advanced analysis and visualization platform for ‘omics data. PeerJ. 3:e1319. doi:10.7717/peerj.1319.
- Eren AM, Murat Eren A, Kiefl E, Shaiber A, Veseli I, Miller SE, Schechter MS, Fink I, Pan JN, Yousef M, et al. 2021. Community-led, integrated, reproducible multi-omics with anvi’o. Nat Microbiol. 6:3–6. doi:10.1038/s41564-020-00834-3.
- Federici BA. 1977. Differential pigmentation in the sexual phase of Coelomomyces. Nature. 267:514–15. doi:10.1038/267514a0.
- Federici BA. 1979. Experimental hybridization of Coelomomyces dodgei and Coelomomyces punctatus. Proc Natl Acad Sci USA. 76:4425–28. doi:10.1073/pnas.76.9.4425.
- Federici BA. 1983. Species-specific gating of gametangial dehiscence as a temporal reproductive isolating mechanism in Coelomomyces. Proc Natl Acad Sci USA. 80:604–07.
- Federici BA, Chapman HC. 1977. Coelomomyces dodgei: establishment of an in vivo laboratory culture. J Invertebr Pathol. 30:288–97. doi:10.1016/0022-2011(77)90136-7.
- Federici BA, Thompson SN. 1979. β-Carotene in the gametophytic phase of Coelomomyces dodgei. Exp Mycol. 3:281–84. doi:10.1016/S0147-5975(79)80053-5.
- Finn RD, Bateman A, Clements J, Coggill P, Eberhardt RY, Eddy SR, Heger A, Hetherington K, Holm L, Mistry J, et al. 2014. Pfam: the protein families database. Nucleic Acids Res. 42:D222–30. doi:10.1093/nar/gkt1223.
- Flynn JM, Hubley R, Goubert C, Rosen J, Clark AG, Feschotte C, Smit AF. 2020. RepeatModeler2 for automated genomic discovery of transposable element families. Proc Natl Acad Sci USA. 117:9451–57.
- Fu L, Niu B, Zhu Z, Wu S, Li W. 2012. CD-HIT: accelerated for clustering the next-generation sequencing data. Bioinformatics. 28:3150–52. doi:10.1093/bioinformatics/bts565.
- Gilchrist CLM, Booth TJ, van Wersch B, van Grieken L, Medema MH, Chooi Y-H. 2021. cblaster: a remote search tool for rapid identification and visualization of homologous gene clusters. Bioinform Adv. 1:vbab016. doi:10.1093/bioadv/vbab016.
- Gilchrist CLM, Chooi Y-H. 2021. Clinker & clustermap.js: automatic generation of gene cluster comparison figures. Bioinformatics. 37:2473–75. doi:10.1093/bioinformatics/btab007.
- Grabherr MG, Haas BJ, Yassour M, Levin JZ, Thompson DA, Amit I, Adiconis X, Fan L, Raychowdhury R, Zeng Q, et al. 2011. Full-length transcriptome assembly from RNA-Seq data without a reference genome. Nat Biotechnol. 29:644–52. doi:10.1038/nbt.1883.
- Grell MN, Mouritzen P, Giese H. 2003. A Blumeria graminis gene family encoding proteins with a C-terminal variable region with homologues in pathogenic fungi. Gene. 311:181–92. doi:10.1016/S0378-1119(03)00610-3.
- Grigoriev IV, Nikitin R, Haridas S, Kuo A, Ohm R, Otillar R, Riley R, Salamov A, Zhao X, Korzeniewski F, et al. 2014. MycoCosm portal: gearing up for 1000 fungal genomes. Nucleic Acids Res. 42:D699–704. doi:10.1093/nar/gkt1183.
- Gueddari NEE, El Gueddari NE, Rauchhaus U, Moerschbacher BM, Deising HB. 2002. Developmentally regulated conversion of surface-exposed chitin to chitosan in cell walls of plant pathogenic fungi. New Phytol. 156:103–12. doi:10.1046/j.1469-8137.2002.00487.x.
- Gurevich A, Saveliev V, Vyahhi N, Tesler G. 2013. QUAST: quality assessment tool for genome assemblies. Bioinformatics. 29:1072–75. doi:10.1093/bioinformatics/btt086.
- Haas BJ, Delcher AL, Mount SM, Wortman JR, Smith RK Jr, Hannick LI, Maiti R, Ronning CM, Rusch DB, Town CD, et al. 2003. Improving the Arabidopsis genome annotation using maximal transcript alignment assemblies. Nucleic Acids Res. 31:5654–66. doi:10.1093/nar/gkg770.
- Haas BJ, Salzberg SL, Zhu W, Pertea M, Allen JE, Orvis J, White O, Buell CR, Wortman JR. 2008. Automated eukaryotic gene structure annotation using EVidenceModeler and the program to assemble spliced alignments. Genome Biol. 9:R7. doi:10.1186/gb-2008-9-1-r7.
- Hardie DG, Ross FA, Hawley SA. 2012. AMPK: a nutrient and energy sensor that maintains energy homeostasis. Nat Rev Mol Cell Biol. 13:251–62. doi:10.1038/nrm3311.
- Hiltunen M, Ament-Velásquez SL, Johannesson H. 2021. The assembled and annotated genome of the fairy-ring fungus Marasmius oreades. Genome Biol Evol. 13:evab126. doi:10.1093/gbe/evab126.
- Huang L, Zhang H, Wu P, Entwistle S, Li X, Yohe T, Yi H, Yang Z, Yin Y. 2018. dbCAN-seq: a database of carbohydrate-active enzyme (CAZyme) sequence and annotation. Nucleic Acids Res. 46:D516–D521. doi:10.1093/nar/gkx894.
- Huerta-Cepas J, Szklarczyk D, Forslund K, Cook H, Heller D, Walter MC, Rattei T, Mende DR, Sunagawa S, Kuhn M, et al. 2016. eggNOG 4.5: a hierarchical orthology framework with improved functional annotations for eukaryotic, prokaryotic and viral sequences. Nucleic Acids Res. 44:D286–93.
- Hyatt D, Chen G-L, Locascio PF, Land ML, Larimer FW, Hauser LJ. 2010. Prodigal: prokaryotic gene recognition and translation initiation site identification. BMC Bioinform. 11:119. doi:10.1186/1471-2105-11-119.
- Idnurm A, Walton FJ, Floyd A, Heitman J. 2008. Identification of the sex genes in an early diverged fungus. Nature. 451:193–96. doi:10.1038/nature06453.
- James TY, Letcher PM, Longcore JE, Mozley-Standridge SE, Porter D, Powell MJ, Griffith GW, Vilgalys R. 2006. A molecular phylogeny of the flagellated fungi (Chytridiomycota) and description of a new phylum (Blastocladiomycota). Mycologia. 98:860–71. doi:10.1080/15572536.2006.11832616.
- James TY, Stajich JE, Hittinger CT, Rokas A. 2020. Toward a fully resolved fungal tree of life. Annu Rev Microbiol. 74:291–313. doi:10.1146/annurev-micro-022020-051835.
- Jones P, Binns D, Chang H-Y, Fraser M, Li W, McAnulla C, McWilliam H, Maslen J, Mitchell A, Nuka G, et al. 2014. InterProScan 5: genome-scale protein function classification. Bioinformatics. 30:1236–40.
- Käll L, Krogh A, Sonnhammer ELL. 2004. A combined transmembrane topology and signal peptide prediction method. J Mol Biol. 338:1027–36. doi:10.1016/j.jmb.2004.03.016.
- Kalyaanamoorthy S, Minh BQ, Wong TKF, von Haeseler A, Jermiin LS. 2017. ModelFinder: fast model selection for accurate phylogenetic estimates. Nat Methods. 14:587–89. doi:10.1038/nmeth.4285.
- Keon J, Rudd JJ, Antoniw J, Skinner W, Hargreaves J, Hammond-Kosack K. 2005. Metabolic and stress adaptation by Mycosphaerella graminicola during sporulation in its host revealed through microarray transcription profiling. Mol Plant Pathol. 6:527–40. doi:10.1111/j.1364-3703.2005.00304.x.
- Kim D, Paggi JM, Park C, Bennett C, Salzberg SL. 2019. Graph-based genome alignment and genotyping with HISAT2 and HISAT-genotype. Nat Biotechnol. 37:907–15. doi:10.1038/s41587-019-0201-4.
- Korf I. 2004. Gene finding in novel genomes. BMC Bioinform. 5:59. doi:10.1186/1471-2105-5-59.
- Langmead B, Trapnell C, Pop M, Salzberg SL. 2009. Ultrafast and memory-efficient alignment of short DNA sequences to the human genome. Genome Biol. 10:R25. doi:10.1186/gb-2009-10-3-r25.
- Laundon D, Chrismas N, Bird K, Thomas S, Mock T, Cunliffe M. 2022. A cellular and molecular atlas reveals the basis of chytrid development. eLife. 11:e73933. doi:10.7554/eLife.73933.
- Lee MD. 2019. GToTree: a user-friendly workflow for phylogenomics. Bioinformatics. 35:4162–64. doi:10.1093/bioinformatics/btz188.
- Lee SC, Ni M, Li W, Shertz C, Heitman J. 2010. The evolution of sex: a perspective from the fungal kingdom. Microbiol Mol Biol Rev. 74:298–340. doi:10.1128/MMBR.00005-10.
- Léjohn HB, Lovett JS. 1966. Ribonucleic acid and protein synthesis in Rhizophlyctis rosea zoospores. J Bacteriol. 91:709–17. doi:10.1128/jb.91.2.709-717.1966.
- Leonard G, Galindo LJ, Milner DS, Avelar GM, Gomes-Vieira AL, Gomes SL, Richards TA. 2022. A genome sequence assembly of the phototactic and optogenetic model fungus Blastocladiella emersonii reveals a diversified nucleotide-cyclase repertoire. Genome Biol Evol. 14:evac157. doi:10.1093/gbe/evac157.
- Li H. 2018. Minimap2: pairwise alignment for nucleotide sequences. Bioinformatics. 34:3094–100. doi:10.1093/bioinformatics/bty191.
- Li H, Durbin R. 2009. Fast and accurate short read alignment with Burrows-Wheeler transform. Bioinformatics. 25:1754–60. doi:10.1093/bioinformatics/btp324.
- Li H, Handsaker B, Wysoker A, Fennell T, Ruan J, Homer N, Marth G, Abecasis G, Durbin R; 1000 Genome Project Data Processing Subgroup. 2009. The sequence alignment/map format and SAMtools. Bioinformatics. 25:2078–79. doi:10.1093/bioinformatics/btp352.
- Li Y, Steenwyk JL, Chang Y, Wang Y, James TY, Stajich JE, Spatafora JW, Groenewald M, Dunn CW, Hittinger CT, et al. 2021. A genome-scale phylogeny of the kingdom Fungi. Curr Biol. 31:1653–1665.e5. doi:10.1016/j.cub.2021.01.074.
- Liu P, Stajich JE. 2015. Characterization of the Carbohydrate binding module 18 gene family in the amphibian pathogen Batrachochytrium dendrobatidis. Fungal Genet Biol. 77:31–39. doi:10.1016/j.fgb.2015.03.003.
- Lombard V, Golaconda Ramulu H, Drula E, Coutinho PM, Henrissat B. 2014. The carbohydrate-active enzymes database (CAZy) in 2013. Nucleic Acids Res. 42:D490–5. doi:10.1093/nar/gkt1178.
- Love MI, Huber W, Anders S. 2014. Moderated estimation of fold change and dispersion for RNA-seq data with DESeq2. Genome Biol. 15:550. doi:10.1186/s13059-014-0550-8.
- Lovett JS. 1968. Reactivation of ribonucleic acid and protein synthesis during germination of Blastocladiella zoospores and the role of the ribosomal nuclear cap. J Bacteriol. 96:962–69. doi:10.1128/jb.96.4.962-969.1968.
- Lowe TM, Eddy SR. 1997. tRNAscan-SE: a program for improved detection of transfer RNA genes in genomic sequence. Nucleic Acids Res. 25:955–64. doi:10.1093/nar/25.5.955.
- Majoros WH, Pertea M, Salzberg SL. 2004. TigrScan and GlimmerHMM: two open source ab initio eukaryotic gene-finders. Bioinformatics. 20:2878–79. doi:10.1093/bioinformatics/bth315.
- Menzel P, Ng KL, Krogh A. 2016. Fast and sensitive taxonomic classification for metagenomics with Kaiju. Nat Commun. 7:11257. doi:10.1038/ncomms11257.
- Mesquita I, Moreira D, Sampaio-Marques B, Laforge M, Cordeiro-da-Silva A, Ludovico P, Estaquier J, Silvestre R. 2016. AMPK in pathogens. In: Cordero M, Viollet B, editors. AMP-activated protein Kinase. Cham (Switzerland): Springer; p. 287–323.
- Minh BQ, Schmidt HA, Chernomor O, Schrempf D, Woodhams MD, von Haeseler A, Lanfear R. 2020. IQ-TREE 2: new models and efficient methods for phylogenetic inference in the genomic era. Mol Biol Evol. 37:1530–34. doi:10.1093/molbev/msaa015.
- Morgan M, Falcon S, Gentleman R. 2022. GSEABase: gene set enrichment data structures and methods. http://bioconductor.org/packages/GSEABase/.
- Palmer JM, Stajich J. 2020. Funannotate v1.8.1: eukaryotic genome annotation. http://doi.org/10.5281/zenodo.4054262.
- Pantano L. 2022. DEGreport: report of DEG analysis. http://lpantano.github.io/DEGreport/.
- Porter TM, Martin W, James TY, Longcore JE, Gleason FH, Adler PH, Letcher PM, Vilgalys R. 2011. Molecular phylogeny of the Blastocladiomycota (Fungi) based on nuclear ribosomal DNA. Fungal Biol. 115:381–92. doi:10.1016/j.funbio.2011.02.004.
- Powell MJ. 2017. Blastocladiomycota. In: Archibald J, Simpson A, Slamovits C, editors. Handbook of the protists. Cham, Boston: Springer; p. 1497–521.
- Prjibelski A, Antipov D, Meleshko D, Lapidus A, Korobeynikov A. 2020. Using SPAdes de novo assembler. Curr Protoc Bioinformatics. 70:e102. doi:10.1002/cpbi.102.
- Rawlings ND, Barrett AJ, Bateman A. 2014. Using the MEROPS database for proteolytic enzymes and their inhibitors and substrates. Curr Protoc Bioinformatics. 48:1.25.1–33. doi:10.1002/0471250953.bi0125s48.
- R Core Team. 2020. R: a language and environment for statistical computing. Vienna (Austria). https://www.R-project.org/.
- Schmoyer IR, Lovett JS. 1969. Regulation of protein synthesis in zoospores of Blastocladiella. J Bacteriol. 100:854–64. doi:10.1128/jb.100.2.854-864.1969.
- Seemann T. 2018. barrnap: bAsic rapid ribosomal RNA predictor. https://github.com/tseemann/barrnap.
- Shen D, Nyawira KT, Xia A. 2020. New discoveries and applications of mosquito fungal pathogens. Curr Opin Insect Sci. 40:111–16. doi:10.1016/j.cois.2020.05.003.
- Simão FA, Waterhouse RM, Ioannidis P, Kriventseva EV, Zdobnov EM. 2015. BUSCO: assessing genome assembly and annotation completeness with single-copy orthologs. Bioinformatics. 31:3210–12. doi:10.1093/bioinformatics/btv351.
- Smit AFA, Hubley R, Green P. 2013–2015. RepeatMasker. http://www.repeatmasker.org.
- Sreesankar E, Senthilkumar R, Bharathi V, Mishra RK, Mishra K. 2012. Functional diversification of yeast telomere associated protein, Rif1, in higher eukaryotes. BMC Genom. 13:255. doi:10.1186/1471-2164-13-255.
- Stajich J, Palmer J. 2019. stajichlab/AAFTF: v0.2.3. doi:10.5281/zenodo.3437300.
- Stanke M, Keller O, Gunduz I, Hayes A, Waack S, Morgenstern B. 2006. AUGUSTUS: ab initio prediction of alternative transcripts. Nucleic Acids Res. 34:W435–9. doi:10.1093/nar/gkl200.
- Steenwyk JL, Buida TJ 3rd, Li Y, Shen X-X, Rokas A. 2020. ClipKIT: a multiple sequence alignment trimming software for accurate phylogenomic inference. PLoS Biol. 18:e3001007. doi:10.1371/journal.pbio.3001007.
- Supek F, Bošnjak M, Škunca N, Šmuc T. 2011. REVIGO summarizes and visualizes long lists of gene ontology terms. PloS One. 6:e21800. doi:10.1371/journal.pone.0021800.
- Ter-Hovhannisyan V, Lomsadze A, Chernoff YO, Borodovsky M. 2008. Gene prediction in novel fungal genomes using an ab initio algorithm with unsupervised training. Genome Res. 18:1979–90. doi:10.1101/gr.081612.108.
- Testa AC, Hane JK, Ellwood SR, Oliver RP. 2015. CodingQuarry: highly accurate hidden Markov model gene prediction in fungal genomes using RNA-seq transcripts. BMC Genom. 16:170. doi:10.1186/s12864-015-1344-4.
- Travland LB. 1979. Initiation of infection of mosquito larvae (Culiseta inornata) by Coelomomyces psorophorae. J Invertebr Pathol. 33:95–105. doi:10.1016/0022-2011(79)90136-8.
- van den Burg HA, Harrison SJ, Joosten MHAJ, Vervoort J, de Wit PJGM. 2006. Cladosporium fulvum Avr4 protects fungal cell walls against hydrolysis by plant chitinases accumulating during infection. Mol Plant-Microbe Interact. 19:1420–30. doi:10.1128/EC.00312-09.
- van de Vossenberg BTLH, Warris S, Nguyen HDT, van Gent-Pelzer MPE, Joly DL, van de Geest HC, Bonants PJM, Smith DS, André Lévesque C, van der Lee TAJ. 2019. Comparative genomics of chytrid fungi reveal insights into the obligate biotrophic and pathogenic lifestyle of Synchytrium endobioticum. Sci Rep. 9:1–14. doi:10.1038/s41598-019-45128-9.
- Vieira ALG, Gomes SL. 2010. Global gene expression analysis during sporulation of the aquatic fungus Blastocladiella emersonii. Eukaryot Cell. 9:415–23.
- Walker BJ, Abeel T, Shea T, Priest M, Abouelliel A, Sakthikumar S, Cuomo CA, Zeng Q, Wortman J, Young SK, et al. 2014. Pilon: an integrated tool for comprehensive microbial variant detection and genome assembly improvement. PLoS One. 9:e112963. doi:10.1371/journal.pone.0112963.
- Wallen RM, Perlin MH. 2018. An overview of the function and maintenance of sexual reproduction in dikaryotic fungi. Front Microbiol. 9:503. doi:10.3389/fmicb.2018.00503.
- Whisler HC, Karanja DMS, Shemanchuk JA, Zebold SL, Romney SV, Nielsen LT. 2009. The life history and in vivo culture of Coelomomyces utahensis (Blastocladiomycetes). J Invertebr Pathol. 100:40–43. doi:10.1016/j.jip.2008.09.009.
- Whisler HC, Zebold SL, Shemanchuk JA. 1975. Life history of Coelomomyces psorophorae. Proc Natl Acad Sci USA. 72:693–96. doi:10.1073/pnas.72.2.693.
- Wickham H. 2009. ggplot2: elegant graphics for data analysis. New York: Springer-Verlag.
- Wickham H, Averick M, Bryan J, Chang W, McGowan LD, François R, Grolemund G, Hayes A, Henry L, Hester J, et al. 2019. Welcome to the tidyverse. J Open Source Softw. 4:1686. doi:10.21105/joss.01686.
- Wyatt NA, Richards JK, Brueggeman RS, Friesen TL. 2020. A comparative genomic analysis of the barley pathogen Pyrenophora teres f. teres identifies subtelomeric regions as drivers of virulence. Mol Plant-Microbe Interact. 33:173–88. doi:10.1094/MPMI-05-19-0128-R.
- Zebold SL, Whisler HC, Shemanchuk JA, Travland LB. 1979. Host specificity and penetration in the mosquito pathogen Coelomomyces psorophorae. Can J Bot. 57:2766–70.
- Zhao Y, Park R-D, Muzzarelli RAA. 2010. Chitin deacetylases: properties and applications. Mar Drugs. 8:24–46. doi:10.3390/md8010024.