
ABSTRACT
The Globisporangium ultimum (formerly Pythium ultimum) species complex was previously composed of two morphological varieties: var. ultimum and var. sporangiiferum. Prior attempts to resolve this morphology-based species complex using molecular techniques have been inconclusive or conflicting. The increased availability of sequenced genomes and isolates identified as G. ultimum var. ultimum and var. sporangiiferum has allowed us to examine these relationships at a higher resolution and with a broader scope than previously possible. Using comparative genomics, we identified highly variable gene regions and designed primers for four new protein-coding genes for phylogenetics. These were then used alongside three known markers to generate a nuclear multigene genealogy of the species complex. From a collection of 163 isolates belonging to the target taxa, a subset of 29 was chosen to be included in this study (verified with nuclear rDNA internal transcribed spacer 1 [ITS1] and mitochondrial cytochrome c oxidase subunit 1 [cox1] sequences). Seventeen isolates of var. ultimum were selected to be representative of variations in genotype, morphology, and geographic collection location. The 12 isolates of var. sporangiiferum included all available specimens identified either morphologically (in previous studies) or through sequence similarity with ITS1 and cox1. Based on the fulfillment of reciprocal monophyly and observed genealogical concordance under the genealogical concordance phylogenetic species recognition, we determined that the Globisporangium ultimum species complex is composed of four genetically distinct species: Globisporangium ultimum, Globisporangium sporangiiferum, Globisporangium solveigiae, and Globisporangium bothae.
INTRODUCTION
Globisporangium ultimum (formerly Pythium ultimum) is one of the most common plant pathogens found in soil and also one of the most pathogenic Globisporangium or Pythium sensu lato (s.l.) species on crops (Plaats-Niterink Citation1981). Globally distributed and with a wide host range, it annually contributes to considerable economic loss in both horticultural and agricultural industries (Cook et al. Citation1980; Larkin et al. Citation1995; Martin and Loper Citation1999; Snowdon Citation1990; Sumner et al. Citation1990). Species of both the family (Pythiaceae) and the genus (Globisporangium or Pythium s.l.) are often considered difficult to identify due to ambiguous morphological characteristics and variable sexual strategies. Therefore, correct species-level identification within these taxa can be challenging and may delay or complicate monitoring strategies and effective disease control.
Within G. ultimum, two morphological varieties distinguished by the presence or absence of sporangia have been described and various morphological groups are also recognized based on their inability to produce oogonia or oospores. The taxonomic status of these varieties or groups has yet to be clarified and has proven difficult to resolve. The more common and pathogenic variety, Globisporangium ultimum var. ultimum, is homothallic and readily produces oogonia but rarely, if ever, sporangia and zoospores. The less common variety, G. ultimum var. sporangiiferum, readily produces zoospores at room temperature and has a slightly higher maximum cardinal temperature (Drechsler Citation1960; Plaats-Niterink Citation1981). Morphological variants of G. ultimum var. ultimum that are incapable of homothallic sexual reproduction have been described variably as group G (Huang et al. Citation1992), group HS or S (Francis et al. Citation1994; Francis and St. Clair Citation1997; Saunders and Hancock Citation1994), and sporangial (Martin Citation1995). These groups do not produce oogonia, instead only producing hyphal swellings that never fully differentiate into oospores. These swellings have been purported to represent antheridia (Francis and St. Clair Citation1997; Martin and Kistler Citation1990). It has been proposed that the presence or loss of sporangia and zoospore production may be epidemiologically significant, as it has implications for dispersal potential, infection processes, and pathogen persistence (Jeger and Pautasso Citation2008).
Previous efforts to resolve whether the two morphological varieties of this species are genetically distinct are extensive and have included protein analysis (Abdelzaher et al. Citation1995; Martin Citation1995), isozyme analysis (Abdelzaher et al. Citation1995; Barr et al. Citation1996), random amplified polymorphic DNA (RAPD) (Francis et al. Citation1994), restriction fragment length polymorphisms (RFLPs) (Francis et al. Citation1994), sequence characterized amplified regions (SCARs) (Francis et al. Citation1994), and phenetic analysis (Gherbawy et al. Citation2005; Lévesque and de Cock Citation2004). All of these studies arrived at uncertain or conflicting conclusions regarding the taxonomic distinction of the morphological varieties. Two papers are key to the current taxonomic status of this species complex: Barr et al. (Citation1996), which studied 60 isolates, by far the largest collection to review this species complex, and Francis et al. (Citation1994), which compared 22 isolates. Twenty-one isolates, representing all morphological types and eight of the 10 isozyme genotypes identified by Barr et al. are included in this study; all 10 isozyme genotypes were examined prior to specimen selection. The key isolate, Pu33 = ATCC 58811 (incorrectly referenced as ATCC 5811), that Francis et al. (Citation1994) used to disqualify the validity and genetic distinction of var. sporangiiferum from var. ultimum was also incorporated into this study. Schroeder et al. (Citation2013) assessed the pairwise genetic distances for both nuc rDNA internal transcribed spacer region ITS1-5.8S-ITS2 (ITS) and cytochrome c oxidase subunit 1 (cox1) within each species, or species complexes, of Pythium s.l. and found that the G. ultimum complex had the highest pairwise intraspecific distances among them, up to 7%, whereas those for most species were consistently below 3%. This relatively high intraspecific distance indicates a high probability of distinct species within the G. ultimum complex. In the past, species have been described based on the placement of a single isolate in the phylogenetic tree of a single locus. Due to an increased awareness of the limitation both of single-gene-species trees and of the barcode markers that are often used to create them, more robust phylogenetic studies are being demanded by the taxonomic community. Multiple independent gene trees based on large representative data sets are becoming standard when phylogenetics is used as the primary evidence for proposing new species (Restrepo Citation2014; Rintoul et al. Citation2012; Stewart et al. Citation2014). Multigene genealogies are also increasingly applied to resolve phylogenetic uncertainty in fungal taxonomy. The availability of the annotated G. ultimum var. ultimum genome (DAOMC BR144 = CBS 805.95 = ATCC 200006; Lévesque et al. Citation2010), as well as the genomes of the ex-isotype strain of G. ultimum var. sporangiiferum (CBS 219.65; Adhikari et al. Citation2013) and epitype of G. ultimum var. ultimum (CBS 398.51; unpublished), has enabled the identification of hypervariable gene regions appropriate for phylogenetic analysis within this species complex. The phylogenetic placement of the G. ultimum species complex within Pythium s.l. and Globisporangium was recently confirmed through phylogenomics and with the ex-type isolate from each variety (Nguyen et al. Citation2022).
The theoretical Phylogenetic Species Concept (PSC) defines a species as the smallest monophyletic group diagnosable by a shared combination of characters (Mishler and Theriot Citation2000; Taylor et al. Citation2000). When the PSC is implemented using genetic data, these characters are represented by differences in nucleotides or amino acid sequences. The operational genealogical concordance phylogenetic species recognition (GCPSR) uses multigene genealogies to determine phylogenetic topology through the concordance of branches supporting the presence of separate species and conflicting branches indicating gene flow (Taylor et al. Citation2000). When species identification within a genus is made difficult by nondescript morphological characteristics and variable reproductive behavior, the GCPSR has the capacity to analyze taxonomic relationships at a higher resolution than other species recognition techniques (Moralejo et al. Citation2008; Taylor et al. Citation2000).
The main objective of this study was to utilize the genomes of G. ultimum var. ultimum and var. sporangiiferum to identify hypervariable genes for phylogenetic analysis and to design primers for these identified gene regions. Using both newly identified and previously identified loci, on a comprehensive set of isolates for G. ultimum s.l., a multigene genealogy was created to examine the Globisporangium ultimum species complex under the GCPSR framework.
MATERIALS AND METHODS
In-house BLAST, identification, and selection of isolates.—
The Basic Local Alignment Search Tool (BLAST) (Altschul et al. Citation1990) was used for an in-house sequence database search to confirm and establish the identity of all G. ultimum complex isolates in the Canadian Collection of Fungal Cultures (DAOMC). The ribosomal internal transcribed spacer 1 region (ITS1) and mitochondrial cytochrome c oxidase subunit 1 (cox1) sequences of the var. ultimum epitype (as designated by Plaats-Niterink [Citation1981]) and the var. sporangiiferum ex-type strain (Drechsler Citation1960) were used to query against 2507 cox1 and ITS sequences that had been generated in-house (sequences published by Robideau et al. Citation2011). The majority of these sequences belonged to Pythium s.l.
Using the best matches from the in-house BLAST search, approximately 170 isolates were selected and aligned using MUSCLE (Edgar Citation2004). From the alignment, a preliminary phylogenetic tree was generated by conducting a neighbor-joining (NJ) analysis in PAUP (4.0b10). By using isolates of var. sporangiiferum and var. ultimum previously identified by morphology (Barr et al. Citation1996; Francis et al. Citation1994; Huang et al. Citation1992; Plaats-Niterink Citation1981), potential varietal groups in the ITS1 phylogeny were extrapolated and putative isolates of var. sporangiiferum were identified. For var. sporangiiferum, all putatively identified (as determined by phylogenetic topology in ITS1 and cox1 NJ trees), previously identified (those that were consistent with the BLAST search), and all obtainable published isolates of the morphological variety were used. Representative isolates of var. ultimum were selected to include: genetic variability as determined by phylogenetic topology in both cox1 and ITS1 marker phylogenies, a genetically identified isolate of var. ultimum that had been observed to produce zoospores (ATCC 58811; Francis et al. Citation1994), two isolates (DAOMC BR583 and DAOMC BR657) identified as being “group G” producing no sexual structures (Huang et al. Citation1992), representatives of the isozyme genotypes described by Barr et al. (Citation1996), and strains that had geographic overlap with putative isolates of var. sporangiiferum.
Selected isolates for this study are listed in .
Table 1. Isolates representing the genetic diversity of the G. ultimum species complex separated into variety and genetic color group.a
Culture conditions, DNA extraction, and growth conditions.—
Cultures were initiated on 2.5% V8 agar at room temperature; after colonization of the medium had occurred, a 1-mm2 piece of agar was cut from the margins of the colony and transferred to potato dextrose broth. Fungal mats were harvested from these cultures, and DNA extraction was carried out using a cetyltrimethylammonium bromide (CTAB) extraction protocol modified from Moller et al. (Citation1992). Extracted DNA was stored at −20 C. DAOMC cultures were obtained from the Canadian Collection of Fungal Cultures, Ottawa, Ontario, Canada. CBS cultures were obtained from Westerdijk Fungal Biodiversity Institute, Utrecht, the Netherlands.
Cultures were grown to generate growth rate curves in two separate experiments. In each case, 150-mm plates containing 50 mL of 2% clarified V8 agar were inoculated with a single 6-mm plug of 3-day-old cultures on 2.5% V8 agar. For each temperature, strains were inoculated in a randomized complete block design with one duplication. Plates were grown at 5, 10, 15, 20, 25, 30, and 35 C. In the first experiment, radial measurements were taken in triplicate for each plate at 24, 48, 72, 96, and 120 h for each growth temperature. Strains were grown concurrently in co-located incubators of similar age and model: Fisher Scientific Isotemp and Fisher Scientific low temperature incubators (Hampton, New Hampshire, United States). Listed by genetic group color and proposed species (), the strains tested were green (G. bothae)—DAOMC BR805; purple (G. solveigiae)—DAOMC BR783, DAOMC BR790, DAOMC BR841; blue (G. sporangiiferum)—DAOMC BR781, CBS 114.79, CBS 219.65 (ex-isotype); and yellow/orange (G. ultimum)—DAOMC BR144 (bright yellow), DAOMC BR638 (pale yellow), DAOMC BR825 (medium orange), DAOMC BR840 (dark orange), CBS 398.51 (pale orange, epitype). From this initial experiment, it was determined that 72 h was the most informative time point and that some of the strains had cardinal growth temperatures higher than expected. The maximum temperature was increased slightly to 37 C to improve radial measurement estimates. The second experiment was inoculated following the same method outlined above, also with one duplicate. Strains were grown at 5, 10, 15, 20, 25, 30, and 37 C, with radial measurements taken in triplicate for each plate at a single time point: 72 h. The strains tested were green (G. bothae)—DAOMC BR805, CBS 122650; purple (G. solveigiae)—DAOMC BR783, DAOMC BR790, DAOMC BR841; blue (G. sporangiiferum)—DAOMC BR776, DAOMC BR781, CBS 219.65; and yellow/orange (G. ultimum)—DAOMC BR144 (bright yellow), DAOMC BR638 (pale yellow), DAOMC BR793 (pale orange), DAOMC BR816 (bright yellow), DAOMC BR825 (medium orange), CBS 398.51 (pale orange).
SNP analysis, gene selection, primer design, PCR, and sequencing.—
Candidate genes were selected based on four criteria: that (i) they had a relatively high rate of single nucleotide polymorphisms (SNPs), (ii) they were at least 1000 bp in length, (iii) they were single copy in the genome, and (iv) they had orthologous gene regions in the other oomycete genomes. The intravarietal variation (SNP/kb) for every gene in the G. ultimum genome was determined by doing a BLAST search using the fully annotated genome data of DAOMC BR144 (Lévesque et al. Citation2010) against scaffold data of the genome for CBS 398.51 through an internal BLAST (unpublished). Orthologs and duplicate copies were identified using the Genome Solutions Web site (http://oomycetes.genomeprojectsolutions-databases.com; Hamilton et al. Citation2011), searched using the assigned gene model names from the DAOMC BR144 genome assembly. If orthologs were identified, FASTA files of the corresponding gene regions were obtained from the relevant published genome Web site. Finally, the presence of intravarietal SNPs were visually confirmed for each candidate gene, and FASTA files for DAOMC BR144 and CBS 398.51 were obtained from the genome Web site. Through this process, four single-copy, highly variable nuclear genes over 1000 bp long with orthologs in other oomycetes were identified: G002286, G002278, G002263, and G001129 (). Additionally, three previously identified markers, for which primers were already available, were also included in the analysis: ITS, beta-tubulin (Btub), and tubular mastigoneme protein (OCM1).
Table 2. Single-copy nuclear genes used for phylogenetic analysis of the Globisporangium ultimum species complex.
Primers were developed using published and unpublished genomic data from three isolates of Globisporangium ultimum and five other Globisporangium species. Nineteen primers were designed for genes G002286, G002278, G002263, and G001129. Conserved regions in G. ultimum were identified by aligning genomic sequences from DAOMC BR144 (Lévesque et al. Citation2010), CBS 398.51 (unpublished), and CBS 219.65 (Adhikari et al. Citation2013) in MegAlign (DNASTAR, Madison, WI). Secondary alignments were also created that included orthologous genes in closely related groups, in hope of finding conserved gene regions in Globisporangium or oomycete taxa suitable for primer design. Primers were designed in Oligo 7 (Molecular Biology Insights, Colorado Springs, CO) either manually or by using the program’s “Primer and Probe” search function. Forward and reverse primers were designed to coincide with conserved regions in G. ultimum, and when possible with other taxa, amplify a product between 900 and 1200 bp in length, and have an approximate melting temperature of 55 C. For each gene, two to six primers were developed and tested in pairs. The location of the primer on the gene and the target organism is indicated in the primer name (). The target organisms are represented by the following short forms representative of their taxon names at the time the work was carried out: Pythium ultimum as PYU1, the genus Pythium as Pyt, and oomycetes in general as Oom.
Table 3. Primers used for PCR and sequencing reactions for isolates of the Globisporangium ultimum species complex.
Outgroup sequences for each locus, except for ITS, were selected following a BLAST search of preliminary genomic scaffold sequences of Pythium aphanidermatum (DAOMC BR444, GenBank AKXX00000000), G. iwayamai (DAOMC 242034, GenBank AKYA00000000), G. irregulare (CBS 250.28, GenBank AKXZ00000000), Phytopythium vexans (CBS 119.80, GenBank AKYC00000000), and Pythium arrhenomanes (CBS 324.62, GenBank AKXY00000000)(Adhikari et al. Citation2013). G. splendens (CBS 462.48) and G. heterothallicum (CBS 450.67 and CBS 451.67 – not included in final analysis) sequences were generated using primers and methods described above. Nucleotide BLAST was used for G002286, G002278, Btub, and OCM1, whereas a protein BLAST was needed for locating homologous gene sequences for G002263 and G001129. Gene sequences for ITS were taken from the DNA barcoding paper by Robideau et al. (Citation2011). Outgroups for final phylogenetic trees were G. iwayamai, G. irregulare, and G. splendens ().
The primers used for polymerase chain reaction (PCR amplification and sequencing reactions for each gene are listed in . PCR volumes and reagent concentrations followed those from Robideau et al. (Citation2011). Thermocycler profiles for the amplification of the seven gene regions included an initial denaturation at 95 C for 3 min, followed by 40 cycles of 95 C for 30s, annealing for 45s at a temperature specific for each primer pair (), and extension at 72 C for 1 min 30s (2 min for OCM1), with a final extension at 72 C for 8 min (10 min for OCM1). PCR products were visualized on ethidium bromide agarose gels.
PCR products were amplified for sequencing and sequenced as described by Robideau et al. (Citation2011). Thermocycler profiles for the sequencing reactions of the seven gene regions had an initial denaturation at 95 C for 3 min, followed by 40 cycles at 95 C for 30s, annealing for 20s (40 s for ITS and OCM1) at 55 C (58 C for ITS and 50 C for Btub), and extension for 60 C for 2 min (4 min for ITS and OCM1).
Sequence editing, alignment, and phylogenetic analysis.—
Sequencing results were edited with Lasergene SeqMan (DNASTAR) and aligned using the online multiple sequence alignment program MAFFT 6 with default settings (http://mafft.cbrc.jp/alignment/server/; Katoh and Toh Citation2008). Alignments were converted from FASTA to NEXUS files with either MacClade 4.06 or SeaView 4.3.2 (Gouy et al. Citation2010). Phylogenetic analyses were carried out on each independent gene region (without concatenation) with PAUP (4.0b10) using neighbor-joining criteria, MrBayes 3.0 (Ronquist and Huelsenbeck Citation2003), and species tree ancestral reconstruction using Bayesian Evolutionary Analysis of Sampling Trees 1.6.2 (*BEAST; Heled and Drummond Citation2009) to compare results from different methods. *BEAST was selected as the primary approach, as it simultaneously estimates multiple gene trees individually as well as generates a shared embedded species tree. Evolutionary models for each locus were determined through likelihood analysis, with three substitution schemes in jModelTest 0.1.1 (Posada Citation2008) and MEGA5 (Tamura et al. Citation2011). Evolutionary models were ranked based on Bayesian information criterion (BIC). Aligned sequences for the seven nuclear loci were uploaded into BEAUti 1.6.2. which produced the input XML file required for BEAST. In BEAUti, species tree ancestral reconstruction (*BEAST) was selected, implementing the multilocus species tree estimation function. A mapping file was imported that designated each isolate as its own hypothetical species in order to see how the individual isolates were placed in the final species tree. Evolutionary models GTR+gamma were used for Btub, G002278, and G002286, whereas HKY+gamma was used for G001129, G002263, ITS, and OCM1. The base frequencies for each locus were set to empirical, the clock model was set to estimated random local clock, the coefficient of variance was changed to normal with a mean of 0.5 and a standard deviation of 0.2, and the weight for GTR substitution parameters was increased to 1.5. Four analyses were run concurrently, with the chain length for each analysis set for 1 × 10⁸ generations, logging every 2000 generations and recording branch lengths (mutations per site). The graphic and statistical software package Tracer 1.5 was used to monitor convergence (Drummond and Rambaut Citation2007). The tree files from the four runs were then combined with a burn-in of 12 500 generations, renumbered, with the suffix changed to .nex.t and scientific notation removed using LogCombiner 1.6.1 (Drummond and Rambaut Citation2007).
Ten phylogenetic trees were generated using sequencing data from seven nuclear genes (ITS, OCM1, Btub, G002286, G002278, G002263, and G001129) to create seven gene trees and three species trees.
Gene and species tree visualization.—
MrBayes was used to visualize the *BEAST output files, as it generates a 50% majority consensus tree, whereas the postanalysis tree builder TreeAnnotator that comes with *BEAST generates a maximum a posteriori (MAP) tree. Both are acceptable approaches to summarizing Bayesian tree data; a 50% majority consensus tree was used as it only contains branches present in at least 50% of generated trees post burn, which was felt to be more visually concise when trying to track gene flow, as it would only visualize well-supported nodes. Using MrBayes 3.0, phylogenetic trees were visualized by executing a NEXUS file containing only the isolate headings—which allowed the program to read the tree files generated by *BEAST. The sumt command was then used, specifying a zero burn-in (burnin = 0), only a single run (nruns = 1), and 50% majority consensus tree (contype = halfcompat). Initial NEXUS input and tree file names were the same, with the tree file having an additional .t at the end (i.e., filename.nex and filename.nex.t, respectively). Consensus trees were visualized using Dendroscope 2.6.1 and exported as pdf files (Huson et al. Citation2007).
Two additional species trees were generated in SplitsTree4 (Huson and Bryant Citation2006) and BUCKy 1.4.0 (Bayesian Untangling of Concordance Knots in Yeast, Larget et al. Citation2010). Both programs used the gene tree files with combined runs and burn-ins generated from *BEAST that were used in MrBayes, but they required an additional formatting step where files were resampled every 50 generations and renumbered using LogCombiner 1.6.1. This was necessary because the tree files were otherwise too large to be opened in these programs.
The gene tree files were uploaded to SplitsTree by using the “Load Multiple Trees” option, consensus networks with thresholds of 0, 0.1, 0.25, 0.33, and 0.5 were generated, and images were exported as pdf files.
BUCKy was run using Oracle VM VirtualBox 4.1.2 with an Ubuntu 32bit operating system. Files were converted from BEAST file format to MrBayes file format using beast2phy Linux scripts available online (http://www.abc.se/~nylander/beast2phy/index.html). Files were further formatted using the subprogram mbsum, which converted each individual gene tree file into an input file with the suffix “.in.” BUCKy was run by typing “bucky *.in.” Tree files were opened using FigTree 1.3.1 (http://tree.bio.ed.ac.uk/software/figtree/). The fourth tree, the primary concordance tree with sample concordance factors, was selected, and branch labels were made visible (concordance factors are saved as branch lengths) before the tree was exported and saved as a pdf file. Phylogenetic trees were edited using Adobe Illustrator CS2.
Analysis of radial growth.—
The cardinal temperature model of Rosso et al. (Citation1993) was used to calculate the maximum, minimum, and optimum cardinal temperatures, as well as the radius at the optimum temperature after 72 h. The data were analyzed with the nonlinear least squares function of R (nls; R Core Team Citation2021) using the Rosso formula format taken directly from the source code of “nlsMicrobio” (Baty and Delignette-Muller Citation2014). The average of the three radius measurements collected after 72 h of growth was calculated for each replicate plate. The cardinal temperatures and radius at optimum growth temperature were estimated for each strain, using replicated data from the two experiments when strains were tested twice, and analyses pooling all strains for each species were also conducted to get the overall standard error. The graphics were prepared with ggplot2 in R (Wickham Citation2016).
RESULTS
Preliminary screening of isolates and sequence data.—
At the onset of this study, the in-house BLAST of the var. ultimum and var. sporangiiferum ex-type strains against ITS and cox1 sequence data included all available GenBank accessions and some unpublished sequences. From these BLAST results, 163 strains were assessed as belonging to the G. ultimum species complex as confirmed by phylogenetic analysis of ITS and/or cox1. This analysis was used to select the 29 isolates included in this study: 12 isolates of var. sporangiiferum (eight of which were putatively classified by sequence comparisons) and a set of 17 isolates representing the diversity in var. ultimum ().
Primers designed de novo had variable success; whereas some were effective, others generated multiple bands in several strains, and G002263 required separate primers in order to amplify outgroups (). The main primer pair used for gene amplification and sequencing for the G002286 gene region was PYU1_G002286_F_245 and PYU1_G002286_R_1473_pul, while Pyt_G002286_F_207, Pyt_G002286_R_1552, and Pyt_G002286_R_1451 were used for both isolates that did not initially sequence well and for G. splendens and G. heterothallicum outgroups. The three G002278 primers PYU1_G002278_F_144, Oom_G002278_F_442 and Oom_G002278_R_1352 worked for amplification and sequencing of all isolates. For G002263, PYU1_G002263_F_1028 and PYU1_G002263_R_2034 worked well for the 17 isolates of var. ultimum. The primers PYUvS_G002263_F_986 and PYU_G002263_R_2095 were designed and successfully used to amplify and sequence all 12 isolates of var. sporangiiferum. The G. splendens and G. heterothallicum outgroups were sequenced using PYU1_G002263_F_1057 and PYU1_G002263_R_2029. The G001129 primers PYU1_G001129_F_391 and PYU1_G001129_R_1445 yielded multiple bands in many of the isolates. Therefore, PYU1_G001129_F_107 and PYU1_G001219_R_1386 were used for amplification and sequencing of isolates that did not work well with the initial two primers. The later primer pair produced cleaner bands, longer sequences, and was preferred. However, multiple bands occurred in the two G. heterothallicum isolates. Since G. heterothallicum sequences could not be successfully amplified for all genes, they were removed from the final analyses.
The aligned sequence lengths with gaps and outgroups for each gene were as follows: ITS 911 bp, OCM1 1622 bp, Btub 1008 bp, G002286 1158 bp, G002278 1132 bp, G002263 1022 bp, and G001129 1244 bp, for a total of 8097 bp.
Phylogenetic trees.—
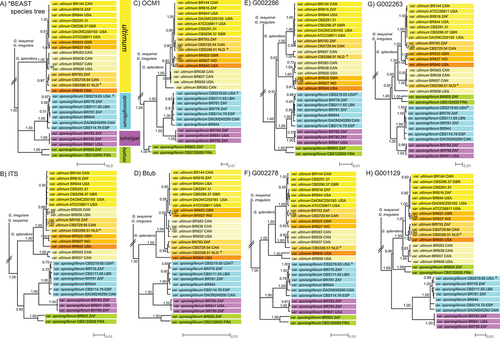
shows the combined species tree and seven individual gene trees. Each tree is a 50% majority consensus tree, with a topology representative of relationships observed in at least 50% of the trees in the posterior distribution. Branch lengths of each gene tree are mutations per site; outgroup branch lengths were trimmed during the formatting of the figures and can be found in SUPPLEMENTARY TABLE 1.
Figure 1. Bayesian 50% majority consensus trees for species (A) and individual nuclear gene trees (B–H) generated with *BEAST. Node values indicate the posterior probability; a= epitype of G. ultimum var. ultimum (Plaats-Niterink Citation1981); b= ex-isotype strain for G. ultimum var. sporangiiferum (Drechsler Citation1960).
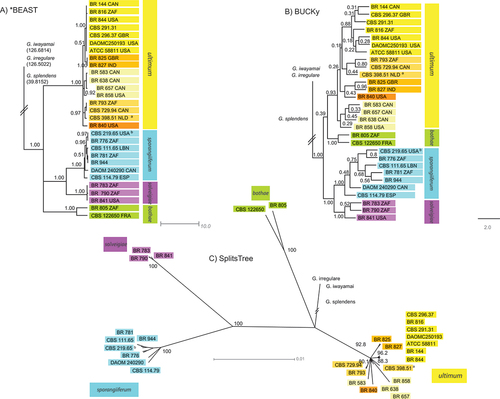
shows three species trees generated in separate programs. The *BEAST species tree branch lengths are in demographic time (dmt), these branch lengths indicate the estimated ancestral population size at the beginning of each branch. The BUCKy tree is a primary concordance tree that has support values as concordance factors (CFs). Concordance factors are the proportion of genes that actually support the clade and are embedded in the tree file as branch lengths. Therefore, branch lengths do not provide any additional information. The SplitsTree species tree is a consensus network with a 0.50 threshold and mean edge weights; these trees are used to visualize conflict between gene trees by creating a network. Support is in confidence values, which is the percentage of trees in which the node is present, and branch lengths are proportional to the weight of an associated split and are analogous to the branch lengths in a phylogenetic tree. Multiple-species tree programs were used to combine the gene trees in order to show consistently across programs that used slightly different methods.
Figure 2. Globisporangium ultimum species trees generated using Bayesian tree files from seven nuclear gene regions and three different programs: (A) 50% majority consensus tree generated in *BEAST, node values represent posterior probabilities; (B) primary concordance tree generated in BUCKy, support values are sample wide concordance factors; (C) consensus network generated in SplitsTree, node supports are confidence values. a = epitype of G. ultimum var. ultimum (Plaats-Niterink Citation1981); b = ex-isotype strain for G. ultimum var. sporangiiferum (Drechsler Citation1960).
The *BEAST analysis showed good convergence within 100 million generations, and a majority of parameters had an effective sample size (ESS) >200. Based on well-supported clades in the *BEAST species 50% majority consensus tree, the 29 isolates of G. ultimum were separated into eight genetic groups and coded with different colors. The five genetic groups within var. ultimum were assigned shades of yellow and orange, whereas blue, purple, and green were given to the three genetic groups making up var. sporangiiferum (). These colors were used to help visualize changes and trends in phylogenetic topology across the individual gene trees () and between species trees (). Support values for the eight clades in each phylogenetic tree are given in SUPPLEMENTARY TABLE 2.
The five genetic groups within var. ultimum are maintained and distinct in the G001129 and Btub gene trees, with posterior support values of 0.80 and higher (), and are present but not always well supported in the BUCKy species tree (). However, in the other five gene trees, the pale orange and pale yellow groups are not maintained (). Additionally, in G002278, the external node of the bright yellow group, although present, only has a 0.59 posterior support value (). Only the two isolates of the medium orange group (DAOMC BR825 and DAOMC BR827) consistently remain together and along with the single isolate of the dark orange group (DAOMC BR840) are generally well supported (). However, since the dark orange “group” is composed of a single isolate, it is difficult to determine how distinct it actually is, especially since it shares a common internal node with the medium orange group in three of the seven genes, the pale yellow group in G002278, and the pale orange group in G001129 ().
In contrast, the purple, blue, and green genetic groups that make up the original var. sporangiiferum are consistently distinct and have very high support values across all gene and species trees—posterior probability of 1.00 in all *BEAST trees, a CF of 1.00 in the BUCKy species tree, and a confidence value of 100 in the SplitsTree species tree ().
SplitsTree network consensus trees were examined at different thresholds: 0, 0.1, 0.25, 0.33, and 0.5, the last of which is given in . The last maintained networks were between the green group of Globisporangium sporangiiferum and the outgroups, as well as within the yellow group. At a threshold of 0.5, all such networks disappeared.
Diagnostic nucleotide characters.—
All strains were assessed for diagnostic nucleotide characters found in the ITS1/ITS2 rDNA regions in both their aligned and raw chromatograms. The nucleotide sites of the diagnostic characters for each species were based on sequences that start at the beginning of the coding region (after the CATTA box). These numbers reflect the raw sequence nucleotide positions of the representative type specimens and can be found in and in the species descriptions.
Table 4. Diagnostic nucleotide regions for each proposed species.
Morphological and physiological characteristics.—
Fifteen of the 29 isolates in this study were examined for variation in morphology—all strains from G. bothae and G. solveigiae, DAOMC BR583, DAOMC BR825, DAOMC BR840, and all CBS material for G. ultimum and G. sporangiiferum. More variation was found amongst isolates of the same species than between species, and although cultures were grown for the purpose of observing production of sporangia and oospores, we were unable to replicate morphological observed by Barr et al. (Citation1996) and Francis et al. (Citation1994). No distinguishing morphological characteristics were identified for the two new species, G. bothae and G. solveigiae (Arthur de Cock, personal communication).
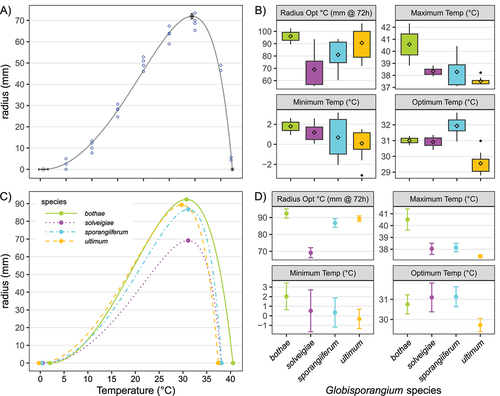
Growth curve parameters for representative strains are detailed in and provide the physiological differences characterizing the four species. shows a typical cardinal temperature growth curve using strain DAOMC BR783 as an example. It indicates that the growth model fitted the data well for DAOMC BR783, and this was consistent for all strains. Only two growth model estimates had unusually high standard errors shown as outliers in this distribution (above 10% of the value of the estimates)—the maximum temperature for CBS 114.79 and the radius after 72 h of growth at optimum temperature for DAOMC BR776. These two estimates were removed from further analyses. shows the distribution of cardinal temperature estimates for individual strains, and the growth radius after 72 h at the optimum temperature. respectively show the growth curves for each species and the growth parameter estimates with their standard errors when strain data were pooled. There was only one strain of G. ultimum from Canada that was above the low optimum values for G. solveigiae and G. bothae. G. solveigiae and G. sporangiiferum are intermediate between G. ultimum and G. bothae with respect to minimum and maximum growth temperatures. G. sporangiiferum can be generally differentiated from all other species based on its higher optimum temperature (). Two strains out of the three tested for G. solveigiae had the lowest radius at the optimum temperature among all strains tested; the third strain was aligned with the overall average. In order to test whether the observed statistical trends in temperature adaptation among the different species were a bias from sample origins and to go beyond anecdotal observations such as the Canadian strain with the highest optimal temperature in G. ultimum mentioned above, the strains were divided into temperate and subtropical sampling locations. The growth estimates showed no statistical differences amongst the four growth parameters when the data were grouped this way (data not shown), demonstrating that the trends were associated with species and not geographic origin.
Figure 3. The model from Rosso et al. (Citation1993) (A) fitted over the radius data from the two replicates and two experiments for strain DAOMC BR825 of G. ultimum. The estimates of cardinal temperatures from the model are shown as solid dots along the fitted line. Standard error bars from the model along the horizontal axis are for the cardinal temperature estimates, and the standard error bar along the vertical axis is for the radius after 72 h of growth at the optimum temperature. (B) Distribution of the estimates for the different parameters of the cardinal temperature model and radius after 72 h at optimum growth when each strain was analyzed separately (experiment and replicate data pooled for each strain). The line in the middle of the box is the median, the diamond is the average value, the bottom and the top of the boxes are the 25th and 75th percentiles, and the whiskers are 1.5 times the interquartile range above and below the box limits, respectively. The dots are outliers, i.e., beyond ± 2.7 standard deviations. (C) The model from Rosso was fitted over the four species with pooled data from all replicates, experiments, and strains from each species. (D) The estimates shown as solid dots in (C) and their standard errors for each species represented separately.
TAXONOMY
Our proposed taxonomic and nomenclatural changes are defined below.
Globisporangium ultimum Trow
MycoBank MB159674
Typification: UK. Cardiff, isolated from very rotted cress seedling lying prone on saturated soil, Jul 1899, A.H. Trow (lectotype fig. 5 from Trow [Citation1901], MycoBank MBT10001939). THE NETHERLANDS: Isolated from Lepidium sativum, G. van den Ende (epitype CBS 398.51, MycoBank MBT10001941). GenBank: ITS = AY598657; OCM1 = KJ659922; Btub = KJ639296; G002286 = KJ639375; G002278 = KJ639400; G002263 = KJ639348; G001129 = KJ639329.
Diagnosis: Diagnostic sequence characters for G. ultimum (as represented by epitype CBS 398.51, GenBank AY598657; base-pair positions from the beginning of ITS1 region): TG (59–60), TTGT (115–118), GTGTAAT (525–531), ATG (583–585), TCA (790–792), and TGTAT (811–815). G. ultimum can be differentiated from G. sporangiiferum by its lower optimum temperature, from G. solveigiae by its lower optimum and maximum temperatures, and from G. bothae by being lower on all cardinal temperatures.
Description: Cardinal temperatures (C): minimum (−3.1–)−1.6–1.0(–1.5) (avg. 0.1), optimum 28.8–30.2(–31.0) (avg. 29.6), maximum 37.3–37.8(–38.2) (avg. 37.5). Radius growth on 2.5% V8 after 72 h at optimum temperature (mm): (72–)81–100(–106) (avg. 91).
Distribution: Worldwide.
Globisporangium sporangiiferum (Drechsler) Q.A. Eggertson & C.A. Lévesque, comb. nov. et stat. nov.
MycoBank MB816623
Basionym: Pythium ultimum var. sporangiiferum Drechsler, Sydowia 14:107. Citation1960.
Typification: USA. MARYLAND: Beltsville, near the Plant Industry Station, isolated from rotting roots of lamb’s quarters Chenopodium album L., 18 Aug 1955, C. Drechsler 71632 (holotype BPI 793156—a slide and dried corn meal culture). Ex-isotype culture CBS 219.65 (= ATCC 13647). GenBank: ITS = HQ643879; OCM1 = JX115206; Btub = KJ639285; G002286 = KJ639373; G002278 = KJ639410; G002263 = KJ639343; G001129 = KJ639310.
Diagnosis: Diagnostic sequence characters for G. sporangiiferum (as represented by ex-isotype CBS 219.65, GenBank HQ643879; base-pair positions from the beginning of ITS1 region): TA (56–57), GGG (74–76), AATAC (84–88), AAATTAGGAGGAC (126–138), CGTTCGTTCGTT (457–468), and TAAAT (709–713). Globisporangium sporangiiferum has a unique combination of lower maximum cardinal temperature, a higher optimal temperature, and is relatively fast growing.
Description: Cardinal temperatures (C): minimum −2.1–2.3(–3.2) (avg. 0.7), optimum (30.9–)31.8–32.2(–32.8) (avg. 31.9), maximum 37.1–37.3(–40.4) (avg. 38.3). Radius growth on 2.5% V8 after 72 h at optimum temperature (mm): (60–)89–94 (avg. 81).
Distribution: The Americas, Europe, Africa, and Asia.
Notes: We are elevating the status of Globisporangium ultimum var. sporangiiferum to species rank.
Globisporangium solveigiae Q.A. Eggertson & C.A. Lévesque, sp. nov.
MycoBank MB816446
Typification: SOUTH AFRICA. LIMPOPO: Greater Sekhukhune, Marble Hall, from orchard soil and fine feeder roots of Citrus sinensis cultivar Palmer, 1991, W.J. Botha WBC Ci.44.1 (holotype DAOMC BR783). GenBank: ITS = HQ643916; OCM1 = KJ659938; Btub = KJ639280; G002286 = KJ639365; G002278 = KJ639417; G002263 = KJ639335; G001129 = KJ639306.
Diagnosis: Diagnostic sequence characters for G. solveigiae (as represented by holotype DAOMC BR783, GenBank HQ643916; base-pair positions from the beginning of ITS1 region): TCGTGTG (58–64), CTA (83–85), AAGAC (87–91), CTCTT (119–123), GGAGGAGGAT (135–144), and CAGC (570–573). G. solveigiae can be differentiated from the other species by its generally lower radius at optimal temperature, from G. ultimum by its higher optimum temperature and maximum temperature, from G. sporangiiferum by its lower optimum temperature, and from G. bothae by its lower maximum temperature and lower radius at optimum temperature after 72 h of growth.
Etymology: Named in honor of Bertha Solveig Eggertson (nee Andreassen), the paternal grandmother of Q.A.E. In memory and gratitude of her positive influence—demonstrating how to be unwaveringly positive, well educated, and independent.
Description: Cardinal temperatures (C): minimum 0.1–2.6 (avg. 1.2), optimum 30.4–31.4 (avg. 30.9), maximum 38.0–38.8 (avg. 38.3). Radius growth on 2.5% V8 after 72 h at optimum temperature (mm): 56–58(–94) (avg. 69).
Distribution: South Africa, USA, Brazil, and Egypt.
Other specimens examined: USA. FLORIDA: On soil. F.N. Martin 58-1 (DAOMC BR841). SOUTH AFRICA. LIMPOPO: Mopani, Hoedspruit, 1992, W.J. Botha WBC At 134 (DAOMC BR790).
Globisporangium bothae Q.A. Eggertson & C.A. Lévesque, sp. nov.
MycoBank MB816443
Typification: SOUTH AFRICA. LIMPOPO: Mopani, Letsitele, from orchard soil and fine feeder roots of Citrus sinensis cultivar Palmer, 1991, W.J. Botha Ci 63(1) (holotype DAOMC BR805). GenBank: ITS = KJ639273; OCM1 = KJ659941; Btub = KJ639290; G002286 = KJ639385; G002278 = KJ639420; G002263 = KJ639346; G001129 = KJ639316.
Diagnosis: Diagnostic sequence characters for G. bothae (as represented by holotype DAOMC BR805, GenBank KJ639273; base-pair positions from the beginning of ITS1 region): CG (57–58), TGGGGGAC (128–135), and TGT (579–581). G. bothae can be differentiated from G. ultimum by all higher cardinal temperatures, from G. sporangiiferum by its lower optimum temperature, and from G. solveigiae by its higher maximum temperature and radius at optimum temperature after 72 h of growth.
Etymology: Named in honor of the plant pathologist Dr. Wilhelm J. Botha, who is currently a senior researcher at the Agriculture Research Council Plant Health and Protection Institute (ARC-PHP) in South Africa. Many specimens used in our study were collected by Dr. Botha, this name is in acknowledgment of the importance of his isolate collection in the discovery of these new species and in honor of his contributions to the systematics of the oomycetes.
Description: Cardinal temperatures (C): minimum 1.0–2.6 (avg. 1.8), optimum 30.7–31.3 (avg. 31.0), maximum 38.8–42.3 (avg. 40.6). Radius growth on 2.5% V8 after 72 h at optimum temperature (mm): 89–102 (avg. 96).
Distribution: France, South Africa, Australia, and Iran.
Other specimen examined: FRANCE. Collected from soil (CBS 122650)
DISCUSSION
Our analysis provides the first multigene-based phylogeny of the Globisporangium ultimum species complex and possibly the first new species in oomycetes defined from hypervariable genes obtained from genomes. Based on the fulfillment of reciprocal monophyly and observed genealogical concordance under the GCPSR, we propose a revision to the current classification of isolates within this species complex and define four phylogenetically distinct species as follows. The isolates within the G. ultimum var. ultimum clade, which includes the epitype (yellow- and orange-hued groups in ), will be classified as Globisporangium ultimum. Isolates within the clade containing the G. ultimum var. sporangiiferum ex-type strain will be reclassified as Globisporangium sporangiiferum (blue group in ), whereas the two phylogenetically distinct clades (purple and green groups in ) are novel species Globisporangium solveigiae and Globisporangium bothae, respectively. Identification of the proposed new species (and previously described varieties) using morphological characteristics cannot be done reliably.
Isolates were putatively categorized into the two known varieties based on the topology of ITS1 and cox1 phylogenies. The isolates putatively classified as var. ultimum were divided into five smaller groups based on well-supported clades in the *BEAST species tree (; ). Conflict between these groups in the individual gene trees provided evidence of gene flow within the variety, whereas the larger group remained monophyletic (). The conflict in topology among individual isolates within the variety ultimum, although maintaining monophyly as a variety, gives evidence that the putatively classified var. ultimum is a genetically distinct species.
Similarly, isolates of var. sporangiiferum were putatively identified and divided into three smaller groups based on well-supported clades in the *BEAST species tree (; ). Conflicts between these smaller groups were never observed, and each group remained both distinct and monophyletic while maintaining high support values across individual gene trees and all three species trees (). Therefore, all three var. sporangiiferum subgroups are proposed as genetically distinct species.
In order to minimize potential geographic bias within our sample set, isolates of var. ultimum were selected to include overlapping geographic regions with putative sequence-identified isolates of var. sporangiiferum (). Within the four proposed species, there are no obvious geographic trends in the molecular data and each clade contains isolates from overlapping geographic locations and various hosts, including at least one South African strain for each of the four phylogenetic species. It is understandable that the isolates sort independently of geographic locale, since most, if not all, of the isolates were collected from cultivated plants or soil, and G. ultimum is not regulated in regard to international trade. There are also no statistically significant differences in cardinal temperatures when strains are separated into temperate and subtropical regions (data not shown).
The four genes identified through SNP analysis, G002286, G002278, G002263, and G001129, showed evidence of intravarietal variation with the capacity to distinguish between closely related lineages (). These gene regions have also been identified in other taxa within Pythiaceae. Primers were, when possible, designed using alignments including sequences from other closely related species and were intended to be compatible with other Globisporangium and potentially other oomycete taxa. Due to the limited success of these primers in sister species G. heterothallicum and G. splendens, their successful application to more distantly related taxa is unlikely. The successful use of BLAST to obtain outgroup sequences from the genomic data of additional Globisporangium and Phytophthora species suggests that the gene regions, if not the primers themselves, may have potential for resolving other closely related species complexes.
The initial ITS1 phylogeny was used to increase the sample size of the elusive var. sporangiiferum and helped select representative isolates that comprehensively represented the genetic diversity of the more prolific var. ultimum. For the G. ultimum complex, it is possible to accurately reconstruct the phylogenetic topology of the taxa with ITS, demonstrating that it is a suitable marker for taxonomic identification of the four potentially cryptic species found in this study. Due to the ability of the ITS region to differentiate these proposed species, an a posteriori BLAST search against GenBank was carried out close to publication. This allowed us to check the proposed species delimitation with all available GenBank accessions of the ITS, including redundant accessions. The maximum likelihood tree, which had close to 900 sequences, showed bootstrap support of 75% or more for each of the four species described here, with only one strain potentially not belonging to any of the four (data not shown). The geographic location from each of those accessions was also extracted. From these queries, four additional putative isolates of G. bothae were identified, three from Australia and one from Iran, whereas seven putative isolates of G. solveigiae were found from Brazil, Egypt, and United States (SUPPLEMENTARY FIG. 1). This shows that it is very likely that more strains of G. solveigiae and G. bothae will be identified in the future. For G. sporangiiferum, there are now well over 100 GenBank accessions of ITS, found on most continents, with more than 50% already identified as G. ultimum var. sporangiiferum in GenBank. For G. ultimum, there are approximately 750 ITS GenBank accessions, most of them deposited in GenBank with the proper name, except for about 50 deposited as Pythium sp. or G. debaryanum. Interestingly, none of the sequences clearly belonging to G. ultimum were deposited as G. ultimum var. sporangiiferum.
Although ITS and cox1 barcode sequences were used early in this study to help select a representative set of specimens, an observed conflict between species estimates given by nuclear and mitochondrial gene regions resulted in cox1 being removed from further analysis. A separate study was conducted that specifically addressed the suitability of mitochondrial genes for multigene phylogenetic analysis, the sequence data from which are available in GenBank (Eggertson Citation2012). This research supported the assumption that G. ultimum mitochondria are single copy, nonrecombinant, and have uniparental inheritance. Smaller effective population size and uniparental inheritance make mtDNA more sensitive to population bottlenecks, introgression, selective sweeps, and incomplete lineage sorting (Rubinoff et al. Citation2006). These traits can bias species estimates, as they reflect the inheritance patterns of the organelle and not the organism overall. Two strains of G. sporangiiferum (CBS 114.79 and CBS 111.65) would be incorrectly identified as G. bothae using any of the six mitochondrial genes examined (Eggertson Citation2012). Due to such conflict between mitochondrial and nuclear gene trees, mitochondrial genes cannot be used reliably to identify G. bothae and G. sporangiiferum (Eggertson Citation2012).
Our findings do not support either of the two current circumscriptions of the G. ultimum species complex as previously described by Barr et al. (Citation1996) or Francis et al. (Citation1994). Furthermore, when isolates from this study were morphologically examined, no distinguishing physical characteristics for any of the species were identified. It was noted that there was greater variation between isolates in the same species than between the different proposed species; sporangia and oospore production could not be obtained (Arthur de Cock, personal communication). Barr et al. (Citation1996) described the existence of two genetically distinct morphological varieties within the G. ultimum species complex, whereas Francis et al. (Citation1994) argued that the morphological varieties within G. ultimum are not genetically distinct and therefore represent a single species. The 10 genotypes described by Barr et al. (Citation1996) were examined in this study. The two isozyme groups not included in the genealogy each contained a single isolate. The U10 isolate was not a member of the species complex. The U5 isolate was determined to be part of the main G. ultimum group but was difficult to fully sequence for ITS. Three of the genotypes were putatively classified through the ITS1 phylogeny as var. sporangiiferum (U6, U8, and U9); of these, Barr suggested that U6 alone made up var. sporangiiferum, as all isolates within this group had been observed to produce zoospores. In our study, the isolates included in genotype U6 are divided into two clades: isolate DAOMC BR805 assorted in Globisporangium bothae, and the rest of the isolates in genotype U6—CBS 219.65, CBS 114.79, and CBS 111.65—grouped with the two samples of genotype U9, DAOMC BR776 and DAOMC BR781, in Globisporangium sporangiiferum (). Therefore, Barr’s classification of a single var. sporangiiferum clade, based on zoospore production and isozyme variation, was not supported by our results.
Francis et al. (Citation1994) used restriction fragment length polymorphisms (RFLPs), random amplified polymorphic DNA (RAPD), and sequence characterized amplified regions (SCARs) to evaluate three morphological varieties within the G. ultimum species complex that differed in their sexual strategy: var. ultimum, var. sporangiiferum, and group HS (hyphal swelling). They determined that these varieties were not genetically distinct and therefore should be classified as a single species. The authors incorporated only two isolates of var. sporangiiferum into their study, Pu33 (ATCC 58811) and the type strain Pu22 (CBS 219.65 in our study), as determined by their ability to produce sporangia and zoospores. In their study, Pu33 was classified as var. sporangiiferum due its ability to produce zoospores but genetically clustered with var. ultimum. This mismatch of morphological characteristics and genetic assortment was used as a basis to conclude that these two varieties were not genetically distinct. Although the authors were able to show that a third morphological variety, classified by the inability to produce oogonia (group HS), was not genetically distinct through successful outcrossing with var. ultimum, they did not attempt similar tests with either of the isolates classified as var. sporangiiferum. In our study, the genetic placement of the two isolates described was confirmed: Pu33 (ATCC 58811) assorted within G. ultimum and Pu22 (CBS 219.65) was genetically distinct and assorted within the G. sporangiiferum clade. Even though our results support the findings of Francis et al. (Citation1994), by including more isolates into our analysis, we were able to show that the G. ultimum species complex is not a single species ().
The key morphological difference between the two varieties of Globisporangium ultimum is that var. sporangiiferum was characterized by the fact that it “readily” produced sporangia and zoospores at room temperature. Even at the time of the varietal description, isolates of var. ultimum had been known, although reluctantly, to produce zoospores from overripened oospores under specific conditions (90-day-old maize meal agar plates flooded with fresh water and kept at 10 C) (Drechsler Citation1952; Plaats-Niterink Citation1981). Furthermore, the reliability of expressing this reproductive strategy may be dubious. A strain from a zoospore-producing variety may fall back on other structures of its life cycle during times of stress (including its sexual state or growing vegetatively), and its inclination to reproduce asexually may vary over time. This is supported by Jeger and Pautasso (Citation2008) who stated that oomycete plant pathogens show remarkable flexibility in both their life cycles and their ability to adapt to changing environmental circumstances. Isolates within var. ultimum have all the known genes necessary for zoospore production—when compared with select species within the zoospore-producing genus of Phytophthora (Phyt. sojae, Phyt. Ramorum, and Phyt. infestans) (Lévesque et al. Citation2010). This indicates that, at least genetically, var. ultimum has the capacity to produce zoospores, as the strain ATCC 58811 (Pu33) appears to indicate, but may not do so readily under laboratory conditions (Baxter et al. Citation2010). Therefore, we provided diagnostics for the new species that are not relying on the production or measurements of sporangia or oospores. Diagnostic ITS characters were originally selected with the core strains from this study (). Those retained and presented here were validated against approximately 900 ITS accessions from GenBank representing the whole G. ultimum species complex.
The model from Rosso et al. (Citation1993) was able to precisely calculate the cardinal temperatures for each group, as illustrated by the curve fitting and the low standard errors on the estimates (). The cardinal temperature model from Rosso et al. (Citation1993) has been successfully used in mycology to model temperature in fungal growth but also to model pH and available water (Mousa et al. Citation2011; Panagou et al. Citation2003; Rosso and Robinson Citation2001). Phylogenetic lineages of yeasts were differentiated using this model (Salvadó et al. Citation2011), and our study shows that phylogenetic signal correlates with cardinal temperatures in oomycetes. Cardinal temperatures were the only nonmolecular characteristics found that could differentiate the species, and each species has a unique feature that can be used diagnostically; however, there were some overlaps among the cardinal temperature profiles of individual strains. The higher optimum temperature observed for G. sporangiiferum compared with G. ultimum () confirms findings from earlier reports (Drechsler Citation1960; Plaats-Niterink Citation1981). G. bothae is better adapted to warmer environments, with higher minimum and maximum growth temperatures, whereas G. ultimum is better suited for cooler environments, with the lowest optimal, minimum, and maximum temperatures.
In this study, we delineate four genetically distinct species that are not well represented by their ability to produce sporangia and zoospores. Diagnostic nucleotide characters found in the ITS1/ITS2 gene regions in their aligned and raw chromatograms for the types of each species are illustrated in and listed in the species descriptions. Aside from cardinal temperatures, we were unable to find any other significant morphological, physiological, pathological, geographic, or host preference that would distinguish between these four newly identified species. The described morphological characteristics and plates from Trow (Citation1901), Drechsler (Citation1960), and Van der Plaats-Niterink (Citation1981) remain useful in broadly describing the morphology of this complex, even if they cannot be used diagnostically to differentiate the four species.
Some argue that not all species are worth describing, cryptic species especially, which are only identifiable by molecular means; describing these species is sometimes criticized if there is no perceived functional purpose for doing so. However, Renner (Citation2016) argues that Linnaeus himself relied on diagnosis, not descriptions, when defining species. Descriptive characteristics can include both taxonomic and nontaxonomic features, whereas a diagnostic approach identifies specific differences between a taxon and its closest relative (Renner Citation2016). She further argues that species description based on multigene phylogeny–based diagnoses is robust and should be an accepted standard for all codes of nomenclature. DNA-centered diagnostics is undeniably faster, increasingly cheaper, and more accessible than traditional expert-centered morphological identification (Cook et al. Citation2010). Cook et al. (Citation2010) also point out the years-long lag time that can result from trying to find morphological differences that reinforce species discovery.
Globisporangium ultimum is a major, ubiquitous global plant pathogen with a high economic importance (reviewed by Lévesque et al. [Citation2010]; SUPPLEMENTARY FIG. 1). Identifying and tracking these rarer sister species is important for safeguarding against the possibility of an unforeseen future epidemic. Although these newly described species are currently less prolific, or at least less sampled, changes in climate (Pautasso et al. Citation2012), dispersal to a new geographic region, and/or exposure to a new host, could all lead to unexpected outbreaks that can quickly become devastating (Gamliel Citation2008). If ever one of these new species was to become a problem or if there were shifts in the distribution of those species due to climate change, the ability to quickly and accurately identify them would allow for faster detection and more effective mitigation strategies.
We elevate G. ultimum var. sporangiiferum to species rank, G. sporangiiferum. We emend the description of G. sporangiiferum and propose the newly described species in the G. ultimum complex, G. solveigiae and G. bothae, from diagnostic molecular characters.
CONCLUSION
When Globisporangium ultimum was first described, the complete loss of sporangia and zoospore production observed by Trow was thought to be an indication that this species had completely transitioned to living in a terrestrial environment. Globisporangium ultimum was therefore considered the ultimate or final species, in a gradual progression that had been observed in species already described in the genus, having adapted to terrestrial living by the complete loss of structures designed for an ancestral aquatic environment (Trow Citation1901). Globisporangium ultimum var. sporangiiferum was named to describe a morphological variety within the species that was readily able to produce zoospores and sporangia, a character G. ultimum had originally been described to lack and later modified to say that it occurred only rarely. Our research focusing on molecular data has proved this morphological paradigm incorrect, motivating us to propose taxonomic revisions and novelties. Our analysis provides the first multigene-based phylogeny of the Globisporangium ultimum species complex. Based on the fulfillment of reciprocal monophyly and observed genealogical concordance under the GCPSR, we propose four phylogenetically distinct species: Globisporangium ultimum, Globisporangium sporangiiferum, Globisporangium solveigiae, and Globisporangium bothae.
Supplemental Material
Download Zip (670.8 KB)ACKNOWLEDGMENTS
We would like to thank the C. Robin Buell and John P. Hamilton from Michigan State University for providing access to genome data before publication; Gregg P. Robideau for providing OCM1 primers; Nicolas Rodrigue for providing guidance on phylogenetic algorithms, software, and setting priors; Scott A. Redhead for reviewing the nomenclature; Arthur W. A. M. De Cock for checking for diagnostic morphological characteristics in our four species; Keith A. Seifert and Myron L. Smith for providing advice and mentorship during Q.A.E’s Master of Science research; and Kasia Dadej, Julie Chapados, and Rafik Assabgui for DNA sequencing services.
DISCLOSURE STATEMENT
No potential conflict of interest was reported by the author(s).
SUPPLEMENTARY MATERIAL
Supplemental data for this article can be accessed online at https://doi.org/10.1080/00275514.2023.2241980
Additional information
Funding
LITERATURE CITED
- Abdelzaher HMA, Morikawa T, Ichitani T, Elnaghy MA. 1995. Classification of Pythium ‘group F’ based on mycelial protein and isozyme patterns. Mycoscience. 36(1):45–49. doi:10.1007/BF02268572.
- Adhikari BN, Hamilton JP, Zerillo MM, Tisserat N, Lévesque CA, Buell CR. 2013. Comparative genomics reveals insight into virulence strategies of plant pathogenic oomycetes. PLoS ONE. 8(10):e75072. doi:10.1371/journal.pone.0075072.
- Altschul SF, Gish W, Miller W, Myers EW, Lipman DJ. 1990. Basic local alignment search tool. J Mol Biol. 215(3):403–10. doi:10.1016/S0022-2836(05)80360-2.
- Bakkeren G, Kronstad JW, Lévesque CA. 2000. Comparison of AFLP fingerprints and ITS sequences as phylogenetic markers in Ustilaginomycetes. Mycologia. 92(3):510–521. doi:10.1080/00275514.2000.12061187.
- Barr DJS, Warwick SI, Désaulniers NL. 1996. Isozyme variation, morphology, and growth response to temperature in Pythium ultimum. Can J Bot. 74(5):753–761. doi:10.1139/b96-094.
- Baty F, Delignette-Muller M 2014. nlsMicrobio: data sets and nonlinear regression models dedicated to predictive microbiology.
- Baxter L, Tripathy S, Ishaque N, Boot N, Cabral A, Kemen E, Thines M, Ah-Fong A, Anderson R, Badejoko W, et al. 2010. Signatures of adaptation to obligate biotrophy in the Hyaloperonospora arabidopsidis genome. Science. 330(6010):1549–1551. doi:10.1126/science.1195203.
- Bilodeau GJ, Lévesque CA, De Cock AWAM, Brière SC, Hamelin RC. 2007. Differentiation of European and North American genotypes of Phytophthora ramorum by real-time polymerase chain reaction primer extension. Can J Plant Pathol. 29(4):408–420. doi:10.1080/07060660709507487.
- Cook L, Edwards R, Crisp M, Hardy N. 2010. Need morphology always be required for new species descriptions? Invertebr Syst. 24(3):322. doi:10.1071/IS10011.
- Cook R, Sitton J, Waldher JT. 1980. Evidence for Pythium as a pathogen of direct-drilled wheat in the Pacific Northwest. Plant Dis. 64(1):102–103. doi:10.1094/PD-64-102.
- Drechsler C. 1952. Production of zoospores from germinating oospores of Pythium ultimum and Pythium debaryanum. Bull Torrey Bot Club. 79(6):431–450. doi:10.2307/2482258.
- Drechsler C. 1960. Two root-rot fungi closely related to Pythium ultimum. Sydowia. 14:106–114.
- Drummond AJ, Rambaut A. 2007. BEAST: bayesian evolutionary analysis by sampling trees. BMC Evol Biol. 7(1):art. no. 214. doi:10.1186/1471-2148-7-214.
- Edgar RC. 2004. MUSCLE: multiple sequence alignment with high accuracy and high throughput. Nucleic Acids Res. 32(5):1792–1797. doi:10.1093/nar/gkh340.
- Eggertson Q. 2012. Resolving the Pythium ultimum species complex [unpublished master's thesis]. Carleton University Ottawa. doi:10.22215/etd/2012-07006.
- Francis DM, Gehlen MF, St Clair DA. 1994. Genetic variation in homothallic and hyphal swelling isolates of Pythium ultimum var. ultimum and P. ultimum var. sporangiferum. Mol Plant Microbe Interact. 7(6):766–775. doi:10.1094/MPMI-7-0766.
- Francis DM, St. Clair DA. 1997. Population genetics of Pythium ultimum. Phytopathology. 87(4):454–461. doi:10.1094/PHYTO.1997.87.4.454.
- Gamliel A. 2008. High consequence plant pathogens. In: Gullino ML, Fletcher J, Gamliel A, Stack JP, editors. Crop biosecurity. Dordrecht, Netherlands: Springer Netherlands; p. 25–36.
- Gherbawy YAMH, Abdelzaher HMA, Meens J, El-Hariry H. 2005. Morphological and molecular identification of some closely related Pythium species in Egypt. Arch Phytopathol Plant Prot. 38(3):193–208. doi:10.1080/03235400500094373.
- Gouy M, Guindon S, Gascuel O. 2010. Seaview version 4: a multiplatform graphical user interface for sequence alignment and phylogenetic tree building. Mol Biol Evol. 27(2):221–224. doi:10.1093/molbev/msp259.
- Hamilton JP, Neeno-Eckwall EC, Adhikari BN, Perna NT, Tisserat N, Leach JE, Lévesque CA, Buell CR. 2011. The comprehensive phytopathogen genomics resource: a web-based resource for data-mining plant pathogen genomes. Database J Biol Databases Curation. 2011:bar053. doi:10.1093/database/bar053.
- Heled J, Drummond AJ. 2009. Bayesian inference of species trees from multilocus data. Mol Biol Evol. 27(3):570–580. doi:10.1093/molbev/msp274.
- Huang HC, Morrison RJ, Muendel -H-H, Barr DJS, Klassen GR, Bochko J. 1992. Pythium sp. “group G,” a form of Pythium ultimum causing damping-off of safflower. Can J Plant Pathol. 14:229–232. doi:10.1080/07060669209500881.
- Huson DH, Bryant D. 2006. Application of phylogenetic networks in evolutionary studies. Mol Biol Evol. 23(2):254–267. doi:10.1093/molbev/msj030.
- Huson DH, Richter DC, Rausch C, Dezulian T, Franz M, Rupp R. 2007. Dendroscope: an interactive viewer for large phylogenetic trees. BMC Bioinform. 8. doi:10.1186/1471-2105-8-460.
- Jeger MJ, Pautasso M. 2008. Comparative epidemiology of zoosporic plant pathogens. Eur J Plant Pathol. 122(1):111–126. doi:10.1007/s10658-008-9289-y.
- Katoh K, Toh H. 2008. Recent developments in the MAFFT multiple sequence alignment program. Brief Bioinform. 9(4):286–298. doi:10.1093/bib/bbn013.
- Larget BR, Kotha SK, Dewey CN, Ané C. 2010. BUCKy: gene tree/species tree reconciliation with Bayesian concordance analysis. Bioinformatics. 26(22):2910–2911. doi:10.1093/bioinformatics/btq539.
- Larkin RP, English JT, Mihail JD. 1995. Effects of infection by Pythium spp. on root system morphology of alfalfa seedlings. Phytopathology. 85(4):430–435. doi:10.1094/Phyto-85-430.
- Lévesque CA, Brouwer H, Cano L, Hamilton JP, Holt C, Huitema E, Raffaele S, Robideau GP, Thines M, Win J, et al. 2010. Genome sequence of the necrotrophic plant pathogen, Pythium ultimum, reveals original pathogenicity mechanisms and effector repertoire. Genome Biol. 11(7):art. no. R73. doi:10.1186/gb-2010-11-7-r73.
- Lévesque CA, de Cock AWAM. 2004. Molecular phylogeny and taxonomy of the genus Pythium. Mycol Res. 108:1363–1383. doi:10.1017/S0953756204001431.
- Martin FN. 1995. Electrophoretic karyotype polymorphisms in the genus Pythium. Mycologia. 87(3):333–353. doi:10.1080/00275514.1995.12026538.
- Martin FN, Kistler HC. 1990. Species specific banding patterns of restriction endonuclease digested mitochondrial DNA in the genus Pythium. Exp Mycol. 14:32–46. doi:10.1016/0147-5975(90)90084-7.
- Martin FN, Loper JE. 1999. Soilborne plant diseases caused by Pythium spp.: ecology, epidemiology, and prospects for biological control. CRC Crit Rev Plant Sci. 18(2):111–181. doi:10.1080/07352689991309216.
- Mishler BD, Theriot EC. 2000. The phylogenetic species concept (sensu Mishler and Theriot): monophyly, apomorphy, and phylogenetic species concept. In: Wheeler QD, Meier R, editors. Species concepts and phylogenetic theory: a debate. New York: Columbia University Press; p. 44–54.
- Moller EM, Bahnweg R, Sandermann H, Geiger HH. 1992. A simple and efficient protocol for isolation of high molecular weight DNA from filamentous fungi, fruit bodies, and infected plant tissues. Nucleic Acids Res. 20(22):6115–6116. doi:10.1093/nar/20.22.6115.
- Moralejo E, Clemente A, Descals E, Belbahri L, Calmin G, Lefort F, Spies CFJ, McLeod A. 2008. Pythium recalcitrans sp. nov. revealed by multigene phylogenetic analysis. Mycologia. 100(2):310–319. doi:10.1080/15572536.2008.11832486.
- Mousa W, Ghazali FM, Jinap S, Ghazali HM, Radu S. 2011. Modelling the effect of water activity and temperature on growth rate and aflatoxin production by two isolates of Aspergillus flavus on paddy. J Appl Microbiol. 111(5):1262–1274. doi:10.1111/j.1365-2672.2011.05134.x.
- Nguyen HDT, Dodge A, Dadej K, Rintoul TL, Ponomareva E, Martin FN, de Cock AWAM, Lévesque CA, Redhead SA, Spies CFJ. 2022. Whole genome sequencing and phylogenomic analysis show support for the splitting of genus Pythium. Mycologia. 114(3):501–515. doi:10.1080/00275514.2022.2045116.
- Panagou EZ, Skandamis PN, Nychas GJE. 2003. Modelling the combined effect of temperature, pH and aw on the growth rate of Monascus ruber, a heat-resistant fungus isolated from green table olives. J Appl Microbiol. 94(1):146–156. doi:10.1046/j.1365-2672.2003.01818.x.
- Pautasso M, Döring TF, Garbelotto M, Pellis L, Jeger MJ. 2012. Impacts of climate change on plant diseases-opinions and trends. Eur J Plant Pathol. 133(1):295–313.
- Plaats-Niterink AJ. 1981. Monograph of the genus Pythium. Stud Mycol. 21:1–242.
- Posada D. 2008. jModelTest: phylogenetic model averaging. Mol Biol Evol. 25(7):1253–1256. doi:10.1093/molbev/msn083.
- Renner SS. 2016. A return to Linnaeus’s focus on diagnosis, not description: the use of DNA characters in the formal naming of species. Syst Biol. 65(6):1085–1095. doi:10.1093/sysbio/syw032.
- Restrepo S. 2014. Speciation in fungal and oomycete plant pathogens. Annu Rev Phytopathol. 52(1):289. doi:10.1146/annurev-phyto-102313-050056.
- Rintoul TL, Eggertson QA, Lévesque CA. 2012. Multigene phylogenetic analyses to delimit new species in fungal plant pathogens. In: Bolton MD, Thomma BP, editors. Plant fungal pathogens: methods and protocols. Totowa, New Jersey, United States: Humana Press; p. 549–569.
- Robideau GP, De Cock AWAM, Coffey MD, Voglmayr H, Brouwer H, Bala K, Chitty DW, Désaulniers N, Eggertson QA, Gachon CMM, et al. 2011. DNA barcoding of oomycetes with cytochrome c oxidase subunit I and internal transcribed spacer. Mol Ecol Resour. 11(6):1002–1011. doi:10.1111/j.1755-0998.2011.03041.x.
- Robideau GP, Rodrigue N, André Lévesque C. 2014. Codon-based phylogenetics introduces novel flagellar gene markers to oomycete systematics. Mol Phylogenet Evol. 79:279–291. doi:10.1016/j.ympev.2014.04.009.
- Ronquist F, Huelsenbeck JP. 2003. MrBayes 3: bayesian phylogenetic inference under mixed models. Bioinformatics. 19(12):1572–1574. doi:10.1093/bioinformatics/btg180.
- Rosso L, Lobry JR, Flandrois JP. 1993. An unexpected correlation between cardinal temperatures of microbial growth highlighted by a new model. J Theor Biol. 162(4):447–463. doi:10.1006/jtbi.1993.1099.
- Rosso L, Robinson TP. 2001. A cardinal model to describe the effect of water activity on the growth of moulds. Int J Food Microbiol. 63(3):265–273. doi:10.1016/S0168-1605(00)00469-4.
- Rubinoff D, Cameron S, Will K. 2006. A genomic perspective on the shortcomings of mitochondrial DNA for “barcoding” identification. J Hered. 97(6):581–594. doi:10.1093/jhered/esl036.
- Salvadó Z, Arroyo-López FN, Guillamón JM, Salazar G, Querol A, Barrio E. 2011. Temperature adaptation markedly determines evolution within the genus. Saccharomyces. 77(7):2292–2302.
- Saunders GA, Hancock JG. 1994. Self-sterile isolates of Pythium mate with self fertile isolates of Pythium ultimum. Mycologia. 86:660–66. doi:10.1080/00275514.1994.12026466.
- Schroeder KL, Martin FN, de Cock AWAM, Lévesque CA, Spies CFJ, Okubara PA, Paulitz TC. 2013. Molecular detection and quantification of Pythium species: evolving taxonomy. New Tools Challenges. 97(1):4–20.
- Snowdon AL. 1990. A colour atlas of post-harvest diseases and disorders of fruits and vegetables. London, UK: Wolfe.
- Stewart JE, Timmer LW, Lawrence CB, Pryor BM, Peever TL. 2014. Discord between morphological and phylogenetic species boundaries: incomplete lineage sorting and recombination results in fuzzy species boundaries in an asexual fungal pathogen. BMC Evol Biol. 14(1):38. doi:10.1186/1471-2148-14-38.
- Sumner DR, Gascho GJ, Johnson AW, Hook JE, Threadgill ED. 1990. Root diseases, populations of soil fungi, and yield decline in continuous double-crop corn. Plant Dis. 74(9):704–710. doi:10.1094/PD-74-0704.
- Tamura K, Peterson D, Peterson N, Stecher G, Nei M, Kumar S. 2011. MEGA5: molecular evolutionary genetics analysis using maximum likelihood, evolutionary distance, and maximum parsimony methods. Mol Biol Evol. 28(10):2731–2739. doi:10.1093/molbev/msr121.
- Taylor JW, Jacobson DJ, Kroken S, Kasuga T, Geiser DM, Hibbett DS, Fisher MC. 2000. Phylogenetic species recognition and species concepts in fungi. Fungal Genet Biol. 31(1):21–32. doi:10.1006/fgbi.2000.1228.
- Team RC 2021. R: a language and environment for statistical computing.
- Trow AH. 1901. Observations on the biology and cytology of Pythium ultimum, n. sp. Ann Bot. 15(2):269–312. doi:10.1093/oxfordjournals.aob.a088819.
- Wickham H 2016. ggplot2: elegant graphics for data analysis.