
Abstract
Mowing and grazing studies over 3 years were used to examine the effects of application of the nitrification inhibitor dicyandiamide (DCD) on pasture production, soil nitrogen (N) transformations, nitrous oxide (N2O) emissions and nitrate leaching from dairy pastures in the Waikato region (northern North Island) of New Zealand. In all cases, DCD inhibited nitrification and reduced the amount of nitrate production. Emissions of N2O from pastoral soil receiving cow urine in autumn were reduced by 18%–71% due to DCD application. Lysimeter studies showed a decrease in nitrate leaching from urine due to DCD by up to 74%, but it was dependent on timing and frequency of DCD application. DCD applications between April and June were most effective for reducing nitrate leaching, but timing of applications needs to account for the temperature profile effects on DCD longevity in soil and three applications may be necessary to achieve greatest benefits. In the mowing trial in one year there was a 4% (P < 0.05) increase in pasture growth during the winter/spring period. Otherwise, there was no significant effect of DCD applications (two to five applications per year) on seasonal or annual pasture production. This study indicates that DCD can provide valuable reductions in N emissions to the environment, making it an effective N mitigation option for use on dairy farms in northern North Island regions.
Disclaimer
DCD has been withdrawn from use on farms in New Zealand and its use is now restricted to research undertaken on small plot trials or lysimeters. Protocols to ensure that DCD does not enter the food chain are supported by soil and plant testing for DCD residues.
Introduction
Grazed pasture systems are relatively inefficient at utilising nitrogen (N) with only about 5%–30% of N consumed by grazing animals being converted into product (milk, meat, fibre; e.g. Ledgard Citation2001). The excess N is excreted and most of this is deposited in urine patches at very high N rates (Haynes & Williams Citation1993), which represent the main source of N loss from grazed pastures via nitrate leaching and nitrous oxide (N2O) emissions (e.g. Di & Cameron Citation2002).
There is strong interest in mitigation options to decrease N losses to the environment, while maintaining or increasing production. One mitigation option is the nitrification inhibitor dicyandiamide (DCD). This acts by inhibiting the process of nitrification in soil i.e. conversion of ammonium to nitrate (e.g. Amberger Citation1989). Ammonium is retained in soil by adsorption on soil surfaces and is readily utilised by pasture plants, while nitrate is prone to loss by leaching and by denitrification. A review of research on the effects of DCD on N2O emissions has shown it to be highly effective but with variability in effectiveness between sites in New Zealand (0%–86% reduction with an average of 57%; de Klein et al. Citation2011). The use of DCD in pasture systems has been confined to the late-autumn and winter period when losses of N from urine deposited on soil are generally highest (e.g. Di & Cameron Citation2005). After application to the soil, DCD is gradually broken down by bacteria and it can be leached down the soil profile. Its effectiveness is therefore governed by factors such as temperature, moisture, soil organic matter, pH and drainage (Amberger Citation1989; Kelliher et al. Citation2008; Menneer et al. Citation2008; Kim et al. Citation2012). Within New Zealand, DCD will be potentially less effective in the northern regions of the North Island than in more southern regions due to warmer soil temperatures during the period of use over winter. Additionally, much of the dairy farming in these northern regions occurs on free-draining volcanic soils that have naturally high rates of nitrification (Sarathchandra Citation1978) and rainfall/drainage levels that are generally higher than in many other dairying regions of New Zealand. Nevertheless, within the northern North Island, a significant reduction in N leaching from DCD application to urine patches has been measured in several lysimeter and plot studies (Menneer et al. Citation2008; Sprosen et al. Citation2009; Shepherd et al. Citation2010) and in one grazing system trial (Ledgard et al. Citation2008).
More inorganic N retention in the soil could lead to increased pasture growth and this is an important factor that will influence the economics of DCD use and its adoption by farmers. Lysimeter and small plot trials have shown increased pasture production when DCD is applied to urine patches. However, the results from farmlet scale trials have been mixed with some trials suggesting annual increases in pasture production of more than 20% (Moir et al. Citation2007) while others showed no increase in pasture growth (Monaghan et al. Citation2009; Macdonald et al. Citation2010).
This paper reports results from a 3-year study on the effects of DCD use on pasture production under grazing and mowing, changes in soil inorganic N, N2O emissions and N leaching in the Waikato region of the northern North Island, New Zealand (of significance because it has 25% of all dairy cows in New Zealand; LIC Citation2011). The study examined effects of timing and frequency of DCD application across different experimental scales, from small plots to grazed pastures. This study was one of four in a coordinated series of nitrous oxide mitigation research (NOMR) trials spread throughout New Zealand (Cameron et al. Citation2014; de Klein et al. Citation2014; Kim et al. Citation2014) and a brief preliminary summary of some of the results across all four sites was given by Gillingham et al. (Citation2012).
Materials and methods
Site description
The research was conducted on AgResearch's Tokanui farm, located approximately 45 km south of Hamilton, New Zealand (38°4′57″S, 175°19′6″E). Previously a beef raising unit, the farm was converted to dairying in 2009 and over the 3 years of the study (2009–2012) ran effective stocking rates of 3.6, 3.4 and 3.5 cows ha−1.
The soil was an Otorohanga silt loam (Typic orthic allophanic; Hewitt Citation1998). Chemical properties of the soil from the experimental sites are given in . Soil bulk density ranged from 0.69 g cm−3 in the 0–10 cm depth to 0.64 g cm−3 in the 20–40 cm depth.
Table 1 Soil test results (0–7.5 cm) for sites used on the AgResearch Tokanui dairy farm, located 35 km south of Hamilton, New Zealand.
In year 1, the grazing and mowing trials were sited on a paddock with 3-year-old pasture of perennial ryegrass (Lolium perenne L.) and white clover (Trifolium repens L.). The paddock had been out of grazing and subjected to several silage cuts before the first grazing (or mowing) and treatment application. In years 2 and 3, the trials were located at the southern end of the paddock, which had been resown with a ryegrass/white clover mix in autumn 2009.
In 2010, a meteorological station was located at the site to record temperature and rainfall. Prior to the on-farm station becoming operational, meteorological data were collected from nearby stations at Waikeria and Ruakura (4 and 34 km away, respectively).
Study structure
In each of the 3 years of the study, a separate mowing trial was established to evaluate the effects of timing of application of cow urine and DCD on pasture production and on the temporal changes in soil inorganic N and DCD concentrations. An associated mown area was used for determination of the effects of urine, dung and DCD treatments on N2O emissions.
Lysimeters containing intact pastoral soil were collected and used for assessing N leaching, as affected by timing of urine application and frequency of DCD applications.
To obtain an integrated evaluation under grazing, large plots within a grazed paddock were used to assess the effects of timing and frequency of DCD application on pasture production. These different components of the study are described in detail in the following sections.
Determination of nitrous oxide emissions
Within the areas used for the mowing trial (described later; with a new area used each year), ring-bases (25 cm diameter; PVC material inserted 10 cm into the ground and protruding 40 cm; Luo et al. Citation2008) were laid out in a randomised block design with six replicates for determination of N2O emissions from real cow urine or dung, as affected by DCD application over 3 years ().
Table 2 Treatments and their application dates used in a mowing study to determine effects on N2O emissions from soil at the Tokanui research farm. All DCD applications were 10 kg DCD ha−1. If a numeral follows the DCD nomenclature this refers to the total number of DCD applications made at the application dates shown.
Two days prior to treatment application, real cow urine was collected, chilled (4 °C) and analysed for total N concentration. After analysis, the urine was either diluted with water or amended with urea to achieve an N concentration of approximately 7 g L−1, before application to field plots (700 kg N ha−1). Similarly, dung was collected from a recently grazed paddock, mixed, chilled, analysed for N concentration, and applied within the ring-bases at 3 g m−2 (Haynes & Williams Citation1993; equivalent to 1124 kg N ha−1). DCD was dissolved in water and sprayed on to the chambers at 10 kg DCD ha−1 after the urine or dung applications. The same volume of water was applied to the control chambers.
A static chamber method was used, based on the methodology of de Klein et al. (Citation2003). Following treatment application, covers were placed over the ring-bases for 1 h periods and gas samples were collected from these chambers after 0 and 1 h (initial measurements showed linearity over this period). The gas sampling was carried out between 1200 h and 1400 h at intervals of day 1 after treatment application, then twice weekly for 8 weeks, followed by once-a-week until all treatments reached background levels. The hourly emissions were integrated over time, for each chamber, to estimate total emissions over the measurement period (Luo et al. Citation2008). The emission factor for animal excreta (EF3; i.e. N2O-N emitted as % of urine-N or dung-N applied) was then calculated.
Lysimeter study to determine nitrate leaching
In 2010–11 and 2011–12, lysimeters (50 cm diameter × 70 cm depth) were used to study nitrate leaching losses from cow urine and the effects of DCD application (). Intact soil cores with pasture were extracted into lysimeters using the method of Cameron et al. (Citation1992) from an area in the research paddock at Tokanui that had been excluded from grazing for about 6 months. The lysimeters (five replicates per treatment) were located in a randomised block layout in trenches at the Ruakura Research Centre near Hamilton.
Table 3 Treatments and their application dates used in a lysimeter study to determine effects on nitrate leaching. All DCD applications were 10 kg DCD ha−1. If a numeral follows the DCD nomenclature this refers to the total number of DCD applications made at the application dates shown.
Urine had been collected from dairy cows and was applied to the whole lysimeter at a rate equivalent to 700 kg N ha−1. DCD was applied in solution form at the equivalent of 10 kg ha−1. The urine treatments were based on accounting for grazing events from late-summer to winter and the DCD treatments examined effects of timing of application and effects of treatments in the grazing and mowing trials.
Leachates were collected from lysimeters at intervals of approximately 50 mm drainage until drainage ceased in late-spring/summer. They were analysed for ammonium and nitrate by flow injection analysis (Tecator Inc, Sweden) and DCD by High Performance Liquid Chromatography (HPLC, Shimadzu HIC-6A) using a method based on that of Schwarzer & Haselwandter (Citation1996).
Mowing trials for determining pasture production, soil inorganic N and DCD concentrations
In all years, field plot mowing trials (17 replicates of treatments in a randomised block design) were established in autumn to examine the effects of urine and DCD (see for treatments) on pasture production and on inorganic N and DCD concentrations in soil. In each year, a new area of pasture near the grazing trial was fenced to exclude cattle and several uniformity harvests were made prior to trial commencement.
Table 4 Treatments used in mowing trials over 3 years at the Tokanui research farm. All DCD applications were 10 kg DCD ha−1. If a numeral follows the DCD nomenclature this refers to the total number of DCD applications made at the application dates shown.
In the first year, plots were 2 × 1.25 m, but in years 2 and 3 a long narrow (5 × 0.5 m) design was used. There was a 0.5 m buffer (untreated) between all plots. An exception was in year 2 when plots for the treatment called ‘urine edge effect’ were located immediately adjacent to the corresponding urine and urine+DCD treatment plots. Their purpose was to examine any edge effects from urine that spread out from the treated plots and due to plant roots from the ‘urine edge effect’ plots extending into the neighbouring urine-treated plots. Potentially this could have extended the area affected by urine and increased the area of response to DCD.
All urine treatments consisted of a single application of artificial cow urine at a rate of 700 kg N ha−1. The composition of the urine was based on that used by de Klein et al. (Citation2003) and consisted of 13.65 g L−1 urea, 3.4 g L−1 glycine, 16.31 g L−1 potassium bicarbonate, 1.61 g L−1 potassium sulphate and 5.68 g L−1 potassium chloride. DCD treatments were applied at a rate of 10 kg DCD ha−1 as a solution at the equivalent of 800 L ha−1. The urea treatments in year 2 consisted of applications of urea at similar times and rates as in the grazing trial (i.e. an initial application of 25 kg N ha−1 and an annual total of 164 kg N ha−1; detailed in the following section). The year 3 urea treatments consisted of two applications of 25 kg N ha−1 each on 15 June and 26 August.
Pasture production was measured by mowing plots with a lawn mower (to 5 cm height) at intervals similar to that for the grazing trial or when pasture reached about 2800 kg dry matter (DM) ha−1. The cut pasture was weighed and a subsample was used for determination of % DM. All clippings were removed from the site.
Soil samples were collected from six replicate plots at regular intervals after treatment application. At least 10 samples were collected per plot to a depth of 40 cm, which were placed on a board and cut into depths of 0–10, 10–20 and 20–40 cm before bulking, sieving and analysis. Subsamples of soil were extracted with 2M KCl (1 g soil: 10 mL extractant), filtered and analysed for ammonium and nitrate by flow injection analysis. Separate subsamples were extracted with distilled water and analysed for DCD by HPLC with adjustment for incomplete recovery as described by Welten et al. (Citation2012).
Grazing trial
As noted in the site description, a different area was used for the grazing trial in year 1, while the same site was used in years 2 and 3. In years 1 and 2, 70 plots (100 m2) were marked out. A randomised block design was used to produce 35 replicates of two treatments (control and DCD). In year 3, each plot was divided into two and an additional four plots added to produce 144 subplots each of which was assigned to one of four treatments using a randomised block design. The number and timing of DCD applications is presented in . In all years, the DCD treatment consisted of the equivalent of 10 kg ha−1 of DCD applied in solution at a rate of 800 L ha−1 following grazing. The treatment paddock was grazed as part of the standard farm system with a stocking rate of 3.5 cows ha−1 producing approximately 1200 kg milksolids ha−1 yr−1.
Table 5 DCD treatments in the grazing trial over 3 years at the Tokanui research farm. All DCD applications were 10 kg DCD ha−1. If a numeral follows the DCD nomenclature this refers to the total number of DCD applications made at the application dates shown. The ‘(late)’ refers to later times of application compared with the other DCD2 treatment.
In each year of the trial, 30 kg N ha−1 in the form of urea was applied following the initial grazing. A total of 150 kg N ha−1 was applied in five split applications throughout each year. Over the 3 years of the trial, a total of 220, 100 and 190 kg ha−1 of phosphorus, potassium and sulphur were applied to the trial area.
Pasture production was measured before and after each grazing using a Farmworks F400 rising plate meter. The average gap between pre- and post-grazing assessment was 4 days. Eighty readings per plot were taken in years 1 and 2 and 40 in year 3 when plot size was halved. The pasture readings were converted into pasture mass using the DairyNZ seasonal equations (Farmworks Citation2008).
Data analyses
Analysis of variance was performed on the data using the GenStat (11th Edition) statistical program (Payne et al. Citation2008). Least significant difference (LSD) values at the P < 0.05 level were used to compare means where main effects and interactions were found to be significant except in the case of the nitrous oxide measurements where standard errors of the mean (SEM) were calculated and presented with the mean values.
Results
Climate data
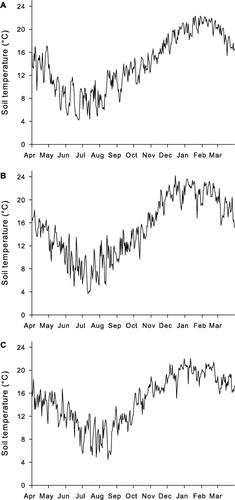
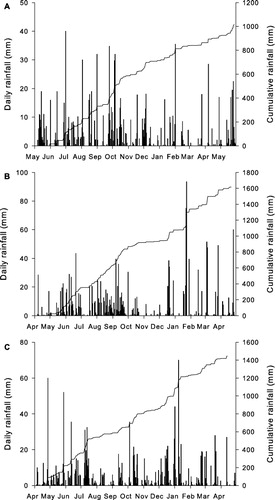
Soil temperatures (10 cm depth; ) showed an average monthly low of 6.9 °C in year 2 and 8.8 °C in year 3. The maximum soil temperatures in summer reached 22–23 °C in January. In year 1, rainfall () over autumn (March–May) was approximately 60% lower than the long-term average of 275 mm. The winter (June–August) rainfall in year 1 was approximately 17% lower than the long-term average (380 mm), but was similar to the long-term-average in spring (300 mm). In year 2, the rainfall in March and April was much less than average and soils were dry at the time of treatment application. That was followed by a very wet June (236 mm rainfall), average July–September and dry October–November. In year 3, soil moisture status and rainfall were about average in autumn and early winter, but below average from mid-July to October.
Soil ammonium, nitrate and DCD concentrations
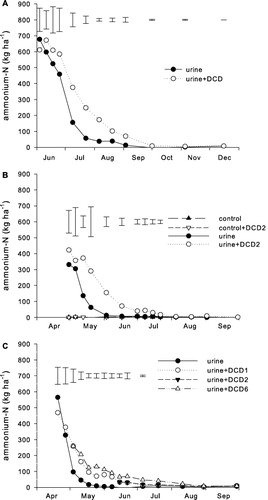
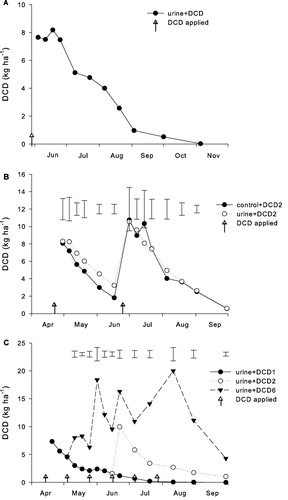
Soil ammonium concentrations in the urine-only treatments declined steadily to near-background levels within 5–8 weeks after urine application. These reductions were slowest in year 1 when urine was applied later (late-May) than in years 2 and 3 (mid-April) (). Application of DCD delayed the rate of decline such that near-background levels were not reached until about 4–6 weeks later than observed for the nil-DCD treatments. In year 3, six applications of DCD resulted in higher ammonium levels in soil being retained for longer than with fewer DCD applications, although the effect was not large (P < 0.05 at some samplings only).
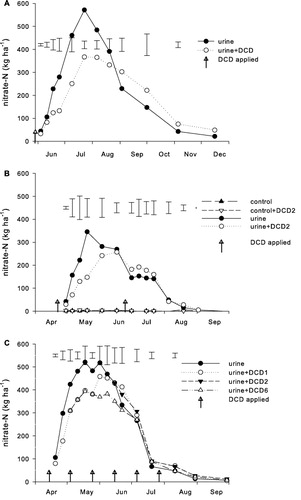
Soil nitrate concentrations in the urine-only treatments peaked at about 4–8 weeks after urine application, with the longest delay again in year 1 (). This varied with sampling depth in that the peak occurred about 4 weeks later in the 20–40 cm depth than the 0–10 cm depth (data not shown). Application of DCD reduced the peak nitrate level in soil by about 100–200 kg ha−1, with the greatest difference observed in year 1. In year 3, the peak nitrate level in soil was kept low for the longest period of time with six DCD applications than with fewer DCD applications.
DCD levels in soil declined following application to <1 kg ha−1 within 8–12 weeks, with the slowest decline in year 1 (). In years 2 and 3, DCD declined to about 1–2 kg ha−1 before the second application of the DCD2 treatments at 8 weeks after the first application. In contrast, in year 3, the treatment where DCD was applied six times (between mid-April and early-August) resulted in levels remaining above 5 kg ha−1 from May to September.
Nitrous oxide emissions
In all years there were two or three main peaks in N2O emissions that occurred within 4–6 weeks after urine application (). In year 3, these peaks were particularly large (400–450 g N2O-N ha−1 day−1) and included one immediately after urine application. Total N2O emissions were low in the control treatment at 0.1–0.2 kg N2O-N ha−1 but increased to 1.0, 2.4 and 5.8 kg N2O-N ha−1 in the urine treatment in years 1–3, respectively (). DCD markedly reduced N2O emissions from urine by 31%, 71% and 18% in years 1–3, respectively. This corresponds to a reduction in emission factor for urine-N (EF3; accounting for the control emissions) of 34%, 75% and 19% in years 1–3, respectively.
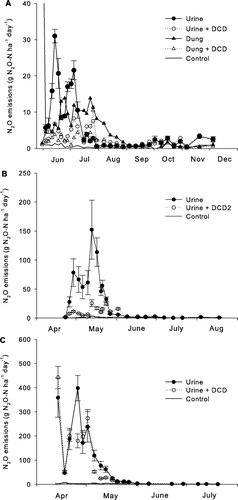
Table 6 Total N2O emissions, emission factor values and reductions in emission factors from urine and dung as affected by DCD use (10 kg DCD ha−1).
Although emissions of N2O from dung lasted longer than from urine and continued for about 3 months (), overall they were less than from urine () despite the dung-N application rate (1124 kg N ha−1) being higher than the urine-N rate (691 kg N ha−1). DCD significantly reduced N2O emissions from dung, equivalent to a reduction in EF3 of 77%.
Nitrogen leaching
Nitrate concentrations in drainage from lysimeters increased to a peak and then declined over the total drainage period following the February, March and April urine applications in both years, indicating near complete elution (). However, treatments with urine applied in June in year 3 showed no increase in nitrate concentration in drainage, indicating no nitrate leaching before the end of drainage in October (data not presented). Thus, lysimeters receiving urine application in February, March or April all showed significant amounts of nitrate leaching over the subsequent winter period, in both years of study (). In year 2, DCD applications in mid-April and mid-July resulted in no significant reduction in nitrate-N leaching from urine-N applied in mid-April, whereas three DCD applications (mid-April, mid-June and mid-August) decreased it by nearly 50% (P < 0.01). This was associated with nitrate concentrations in drainage in the DCD2 treatment being similar to that for urine-only, whereas the DCD3 treatment markedly reduced nitrate concentrations through to mid-September (for details, see Balvert et al. Citation2012). A similar trend was evident in the March treatments.
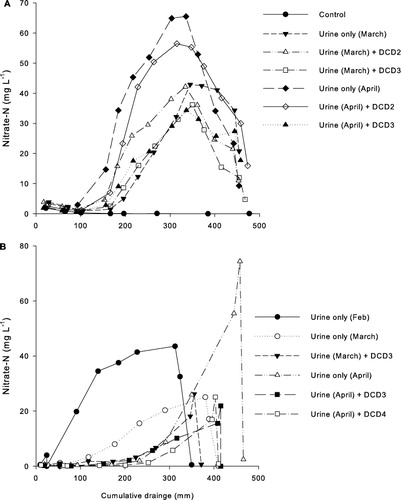
Table 7 Amount of N leached from lysimeters (kg N ha−1), as affected by timing and frequency of urine and DCD application (10 kg DCD ha−1), over 2 years. If a numeral follows the DCD nomenclature this refers to the total number of DCD applications made (for timing of applications, see ).
In year 3, the DCD treatments with three or four applications following urine addition in April resulted in a much lower nitrate concentration in drainage () and a 69%–74% decrease (P < 0.05) in the total amount of N leached (). There was no significant difference between treatments associated with urine application in March.
Ammonium-N concentrations in leachates were analysed but in almost all cases were <1 mg L−1 and showed no treatment effects.
Potentially, these leaching data can be used to calculate the amount of N leaching from grazed pastures at Tokanui, as affected by DCD use. This was done using data for N leaching from all urine-treated lysimeters, in conjunction with estimates of the amount of N excreted in urine from cows in the grazing trial. The latter were based on measured data from Tokanui on the amount of pasture-N consumed at each grazing throughout the year and calculations of urine-N excreted after adjusting for the measured N removal in milk and the calculated proportion of N excreted in urine and dung (Ledgard et al. Citation2003). It was assumed that all N leaching occurred from urine deposited between February and late-winter and that there was no N leaching from urine deposited in spring and early-summer, or from dung throughout the year. Using this approach, the amount of N leaching in 2010–11 calculated from the control treatment in the grazing trial (i.e. based on the non-DCD-treated lysimeters) was 20 kg N ha−1, and there was no effect of DCD additions in April and July (due to lack of DCD2 treatment effects in lysimeters; ). However, DCD applications in April, June and July were calculated (using DCD3 treatment effects in lysimeters) to result in a 32% decrease in N leaching. For 2011–12, the amount of N leaching calculated from the control treatment in the grazing trial (i.e. based on the non-DCD-treated lysimeters) was 19 kg N ha−1, while for DCD addition in April, June and August (similar to the DCD2 grazing treatment) there was a 21% decrease in N leaching. Application of DCD in April, May, June and August (similar to the DCD4 grazing treatment) resulted in a 23% decrease in N leaching.
Pasture production in the mowing studies
In year 1, there was a large increase in pasture growth due to urine application but there was no significant effect of DCD application (). However, it should be noted that pasture was left for too long before the first harvest (4300 kg DM ha−1 in urine plots; timing was left to coincide with the grazing trial) and this resulted in slower regrowth and no response to urine at the second harvest. However, it recovered and responded strongly at several subsequent harvests. Nevertheless, this may have influenced the overall urine response and the effect of DCD.
Table 8 Winter/spring and annual pasture dry matter yields and yield responses to DCD in the mowing trials. All DCD applications were 10 kg DCD ha−1. If a numeral follows the urea or DCD nomenclature this refers to the total number of applications made (for timing of applications, see ).
In year 2, there was a strong pasture response (P < 0.01) to the urine, urine edge-effect and N fertiliser treatments at 42%, 11% and 8%, respectively, on an annual basis. At the second harvest, there was an additional response to DCD across these treatments, which averaged 15% (P < 0.05). However, there was no significant effect of DCD on a seasonal or annual basis.
In year 3, there was a significant response (P < 0.01) to urine and N fertiliser over the control. In the urine treatments, the addition of DCD resulted in an increase (P < 0.05) in pasture production at harvests two and six and an average 4% response (P < 0.05) across the first six harvests. However, the latter was mostly evident in the treatment with four applications of DCD, which showed a 7% response over winter/spring. On an annual basis, there was no significant pasture response to DCD in any of the experimental years.
Pasture production from grazed pastures
In all years, there was no significant effect of DCD treatment on pasture production, whether for any single grazing event, season or on an annual basis (). On average, all assessments of annual pasture production indicated a low positive apparent response (1.2%–2.8%), but none were statistically significant.
Table 9 Winter/spring and annual pasture dry matter yields and yield responses to DCD in the grazing trial. All DCD applications were 10 kg DCD ha−1. If a numeral follows the DCD nomenclature this refers to the total number of DCD applications made. Months given after DCD nomenclature refer to timing of individual DCD applications.
Discussion
Changes in DCD and inorganic N levels in soil
Application of DCD resulted in significant inhibition of nitrification in soil across all treatments in all years. The measured levels of DCD in soil declined to below 1 kg ha−1 by 8–12 weeks after application. The longevity of DCD in soil was less with the earlier April applications when average soil temperatures (10 cm depth) were about 15 or 20 °C at the time of application in years 2 and 3, respectively. Incubation studies have shown that the rate of decay of DCD in soil is temperature-dependent and increases with increasing temperature (e.g. Kelliher et al. Citation2008). In the mowing trials, after autumn application of DCD it took approximately 12 weeks for DCD in soil to decline to non-detectable levels, whereas in the cooler South Island sites this took approximately 17 weeks (Gillingham et al. Citation2012).
Measurement of DCD concentrations in soil at different depths within the 0–40 cm depth (data not presented) illustrated some movement of DCD down the soil profile, as noted by others (e.g. Welten et al. Citation2013), but analysis of leachate from the lysimeters showed little DCD leaching below 70 cm (data not presented). This indicates that leaching of DCD below the main zone of effectiveness within the soil profile is unlikely to have been a significant factor in the measured decline in DCD in soil over time ().
Application of DCD prolonged the presence of ammonium in soil by 4–6 weeks, with the ammonium being held predominantly in the top 10 cm soil layer. This was associated with a reduction in the amount of nitrate-N measured in DCD-treated soil (0–40 cm depth) by about 100–200 kg N ha−1. Thus, there was less nitrate-N in soil prone to gaseous and leaching losses.
Nitrous oxide emissions
Nitrous oxide emissions from urine-N treatments were reduced with DCD application, although there was variation in effectiveness between years. The reductions were least in years 1 and 3, which were associated with large peaks in emissions soon after treatment application. This coincided with significant rainfall events and high soil moisture status. In all years there were several N2O emission peaks, which had declined to background levels within 4–6 weeks after urine application. Thus, DCD persistence in soil was sufficiently long to be effective throughout the period of the main emissions. While the percentage reduction in N2O emissions from DCD application was least in year 3, it was associated with the largest absolute emissions and greatest apparent reduction (1 kg N2O-N ha−1). The 18%–71% decrease in N2O emissions from urine due to DCD use is within the range of 0%–86% reported in the review of de Klein et al. (Citation2011). The 40% average decrease in N2O emissions from urine due to DCD use was similar to that for the corresponding trial in South Otago, but less than that in Manawatu (55% average) and Canterbury (63% average) (Gillingham et al. Citation2012). Emissions of N2O from dung were less than from urine (as reviewed by van der Weerden et al. Citation2011) and occurred over a longer period than for urine, but nevertheless there was a significant two-thirds reduction in N2O emissions from dung when DCD was applied. Cameron et al. (Citation2014) also measured a large reduction in EF3 for dung due to DCD application, which was similar to the reduction for urine, but the magnitude of N2O emissions from dung and the decrease with DCD use was small in the corresponding studies in Manawatu (Kim et al. Citation2014) and Southland (de Klein et al. Citation2014). These data support inclusion of dung in GHG Inventory calculations for reductions associated with use of DCD so that reduced emissions from both urine and dung are included.
Nitrate leaching
Nitrate leaching from urine was reduced in almost all treatments when DCD was applied, which is consistent with the results from a number of other lysimeter studies (e.g. Di & Cameron Citation2002; Di & Cameron Citation2005; Shepherd et al. Citation2010; Welten et al. Citation2013). However, results indicated that the timing and frequency of DCD application was an important determinant of the level of decrease in nitrate leaching. In year 2, urine and the first DCD application were applied in mid-April. However, dry autumn conditions meant that net drainage and leaching did not commence until late-June. By that time, DCD levels in soil had declined to about 1 kg ha−1, soil ammonium had declined to low levels and soil nitrate had increased to similar levels to that for the non-DCD treatment. Although a second DCD application was applied to that treatment in mid-July, it appeared to be too late to be effective in reducing nitrification and leaching from the urine applied in April. In contrast, in another treatment where urine was applied in April but with DCD also applied in June and July, the June DCD application was sufficiently close to the first application that it maintained an adequate DCD concentration in soil and this treatment decreased N leaching from urine by almost 50%. This highlights the importance of planning the timing of DCD applications to account for its decay rate and ensure inhibition of nitrification. This is likely to be relatively more important in warmer regions of New Zealand such as the Waikato region where winter soil temperatures at 10 cm depth may not decline much below 10 °C (). In year 3, treatments with multiple (three or four) applications of DCD were similarly effective in decreasing nitrate leaching from urine deposited in April (by 69%–74%).
Nitrate leaching losses from urine deposited in late-summer and autumn were shown to be significant in the lysimeter studies and at these warmer times of the year it will be difficult to apply and maintain DCD levels in soil through to the winter and reduce leaching from them. The practical use of DCD in grazed pastures is therefore likely to be confined to the mid-autumn to winter period in warmer regions such as from Waikato northwards. Calculations from the lysimeter studies in conjunction with data on N excreted from cows in the grazing study indicate that while DCD is capable of reducing nitrate leaching from urine in mid-autumn and winter by about 50%–70%, the effective reduction in annual nitrate leaching is likely to be of the order of 20%–30%. More research in grazed systems is required to better define the whole-system benefits from practices focused on decreasing leaching during autumn and winter, such as the use of DCD. A dairy grazing system study near Rotorua (in a higher-altitude and cooler area than northern Waikato) showed an average decrease in N leaching from DCD use in late-autumn and winter of 20% (Ledgard et al. Citation2008), whereas a grazing trial in Southland (with cold winter conditions) showed a 21%–56% decrease in nitrate leaching from two or three DCD applications per year (Monaghan et al. Citation2009).
Implications for pasture production
A decrease in N losses via N2O emissions and N leaching from use of DCD means that more plant-available N should remain in soil. Also, the decomposition of DCD in soil results in the release of ammonium-N (i.e. about 6.5 kg N ha−1 from 10 kg DCD ha−1; Amberger Citation1989). These sources are all potentially available for plant uptake and could lead to an increase in plant growth providing the pasture is N-deficient, although other N removal processes such as microbial immobilisation could also occur. Plant growth response to increased N in soil is most likely to be measured in a plot study where the input of N sources such as urine can be controlled and where the precision of measurement can be greater than in a grazed pasture with its mosaic of urine patches. However, across all 3 years of the mowing trials there was no significant annual increase in pasture production associated with the use of DCD. Nevertheless, the initial pasture response may have been limited in year 1 by the pasture being left too long before the first harvest was made, and in year 2 by the very dry soil moisture status in autumn, thereby reducing the potential for the N response to be expressed. However, in year 3, conditions were conducive to achieving a response from DCD use and the multiple applications of DCD should have accentuated the likelihood of achieving a pasture response. There was a significant DCD response in the urine treatments across all DCD treatments (P < 0.05; although no clear effect of increasing the number of DCD applications) over the first six harvests in year 3, with an average response from DCD use of 4% (SE 0.8%). This compares with the amount of saved-N from N leaching and N2O emissions, plus the N release from DCD decay, of 50–65 kg N ha−1, which at a typical response of 10 kg DM kg−1 N would mean a potential response of about 7%–9% over the non-DCD urine treatment. This effect was diluted by subsequent non-N-responsive harvests so that on an annual basis there was no significant effect of DCD use. Sprosen et al. (Citation2009) measured a 15% increase in pasture production from urine and DCD relative to urine-alone over 211 days after a May application on a similar volcanic ash soil in Waikato. That pasture response was associated with a 24% decrease in N leaching, which corresponded to a ‘saving’ of 67 kg N ha−1. Similarly, Menneer et al. (Citation2008) measured a 34% increase in pasture growth from DCD application to urine (applied in May) in a mowing trial on pumice soil near Rotorua.
In a grazed pasture system, there is more variability than in a mowing trial with defined control and urine plots. However, it can be argued that it is also more representative in containing ‘real’ urine patches rather than large artificial ones. Real urine patches are relatively small and mean that plant roots that straddle the patches and non-urine areas may better display the potential benefit of the excess N in urine patches, and from N saved due to DCD application. Nevertheless, it should be noted that the mowing trial in year 2 included a treatment with edge-effects to specifically examine this aspect and it showed no additionality to the N response from DCD use. Overall, the grazing trial showed no statistically significant response in pasture production from the use of DCD, although in all cases there was a trend for a very small (1.2%–2.8%) response in all years. Other detailed grazing studies with measurements over 3–4 years have shown variable effects of DCD on pasture production between years and across sites ranging from about 0%–10% (Monaghan et al. Citation2009; Cameron et al. Citation2014; de Klein et al. Citation2014; Kim et al. Citation2014).
Conclusions
Application(s) of DCD at 10 kg ha−1 were effective in inhibiting nitrification in soil and resulted in a decrease in N2O emissions from cow urine, although this was variable across the 3 years of the study (at 18%, 31% and 71%). It also decreased nitrate leaching from urine, but the timing and frequency of DCD application was critical in determining effectiveness. Results indicated that March is relatively warm and marginal for DCD effectiveness in this northern North Island region, so that April–June is the recommended treatment period. Applications of DCD during this period need to account for longevity and effectiveness of DCD and this study indicates that in this region three applications may be required to achieve a significant reduction in nitrate leaching. The decrease in N2O emissions and N leaching represented significant ‘saved-N’ but this was not reflected in significant increases in annual pasture production. Nevertheless, the valuable reductions in N emissions to the environment mean that DCD is an effective N mitigation option for use on dairy farms in New Zealand, including those in the northern North Island region.
Acknowledgements
We thank the Ministry for Primary Industries (MPI; formerly the Ministry of Agriculture and Forestry), Fonterra Co-operative Group Ltd, Ballance Agri-Nutrients Ltd, Ravensdown Fertiliser Co-operative Ltd, DairyNZ and the Pastoral Greenhouse Gas Research Consortium (PGgRc) for funding this research. We also thank Amanda Judge, Alec McGowan and Bridget Wise for assistance with fieldwork, Martin Kear for DCD analysis and Tokanui farm staff for grazing trial management.
References
- Amberger A 1989. Research on dicyandiamide as a nitrification inhibitor and future outlook. Communications in Soil Science and Plant Analysis 20: 1933–1955. 10.1080/00103628909368195
- Balvert S, Judge A, Sprosen M, Ledgard S 2012. Using a lysimeter study to estimate nitrogen leaching under grazing, as affected by multiple DCD applications. In: Currie LD, Christensen CL eds. Advanced nutrient management: gains from the past – goals for the future. Palmerston North, Fertilizer and Lime Research Centre, Massey University. 8 p.
- Cameron KC, Di HJ, Moir JL 2014. Dicyandiamide (DCD) effect on nitrous oxide emissions, nitrate leaching and pasture yield in Canterbury, New Zealand. New Zealand Journal of Agricultural Research. doi:10.1080/00288233.2013.797914
- Cameron KC, Smith NP, McLay CDA, Fraser PM, McPherson, RJ, Harrison DF et al. 1992. Lysimeters without edge-flow: an improved design and sampling procedure. Soil Science Society of America Journal 56: 1625–1628. 10.2136/sssaj1992.03615995005600050048x
- Cornforth IS, Sinclair AG 1984. Fertiliser recommendations for pastures and crops in New Zealand. 2nd revised edition. New Zealand, Ministry of Agriculture and Fisheries. 76 p.
- de Klein CAM, Barton L, Sherlock RR, Li Z, Littlejohn RP 2003. Estimating a nitrous oxide emission factor for animal urine from some New Zealand pastoral soils. Australian Journal of Soil Research 41: 381–199. 10.1071/SR02128
- de Klein CAM, Cameron KC, Di HJ, Rys G, Monaghan RM, Sherlock RR 2011. Repeated annual use of the nitrification inhibitor dicyandiamide (DCD) does not alter its effectiveness in reducing N2O emissions from cow urine. Animal Feed Science and Technology 166–167: 480–491. 10.1016/j.anifeedsci.2011.04.076
- de Klein CAM, Letica SA, Macfie PI 2014. Evaluating the effects of dicyandiamide (DCD) on nitrogen cycling and dry matter production in a 3-year trial on a dairy pasture in South Otago, New Zealand. New Zealand Journal of Agricultural Research. doi:10.1080/00288233.2014.941508
- Di HJ, Cameron KC 2002. The use of a nitrification inhibitor, dicyandiamide (DCD), to decrease nitrate leaching and nitrous oxide emissions in a simulated grazed and irrigated grassland. Soil Use and Management 18: 395–403. 10.1111/j.1475-2743.2002.tb00258.x
- Di HJ, Cameron KC 2005. Reducing environmental impacts of agriculture by using a fine particle suspension nitrification inhibitor to decrease nitrate leaching from grazed pastures. Agriculture, Ecosystems and Environment 109: 202–212. 10.1016/j.agee.2005.03.006
- Farmworks 2008. F400 Electronic Rising Plate Meter user manual. Fielding, New Zealand, Farmworks Precision Farming Systems. P. 59.
- Gillingham AG, Ledgard SF, Saggar S, Cameron KC, Di HJ, de Klein CAM et al. 2012. Initial evaluation of the effects of dicyandiamide (DCD) on nitrous oxide emissions, nitrate leaching and dry matter production from dairy pastures in a range of locations in New Zealand. In: Currie LD, Christensen CL eds. Advanced nutrient management: gains from the past – goals for the future. Palmerston North, Fertilizer and Lime Research Centre, Massey University. 16 p.
- Haynes RJ, Williams PH 1993. Nutrient cycling and soil fertility in the grazed pasture ecosystem. Advances in Agronomy 49: 119–199.
- Hewitt AE 1998. New Zealand soil classification. 2nd edition. Lincoln, Canterbury, Manaaki Whenua Press.
- Kelliher FM, Clough TJ, Clark H, Rys G, Sedcole JR 2008. The temperature dependence of dicyandiamide (DCD) degradation in soils: a data synthesis. Soil Biology and Biochemistry 40: 1878–1882. 10.1016/j.soilbio.2008.03.013
- Kim DG, Giltrap DL, Saggar S, Hanly JA 2014. Field studies assessing the effect of dicyandiamide (DCD) on pasture yields, N2O emissions and N-leaching in the Manawatu region. New Zealand Journal of Agricultural Research. doi:10.1080/00288233.2013.855244
- Kim DG, Palmada T, Berben P, Giltrap D, Saggar S 2012. Seasonal variations in the degradation of a nitrification inhibitor, dicyandiamide (DCD), in a Manawatu grazed pasture soil In: Currie LD, Christensen CL eds. Advanced nutrient management: gains from the past – goals for the future. Palmerston North, Fertilizer and Lime Research Centre, Massey University. 7 p.
- Ledgard SF 2001. Nitrogen cycling in low input legume-based agriculture, with emphasis on legume/grass pastures. Plant and Soil 228: 43–59. 10.1023/A:1004810620983
- Ledgard SF, Ghani A, Redding M, Sprosen M, Balvert S, Smeaton D 2008. Farmers taking control of their future: research into minimising nitrogen and phosphorus from pasture land into Rotorua lakes. In: Currie LD, Yates LJ eds. Carbon and nutrient management in agriculture. Occasional Report No. 21. Palmerston North, New Zealand, Fertilizer and Lime Research Centre, Massey University. Pp. 500–510.
- Ledgard S, Luo J, Monaghan R 2003. Partitioning of excreta nitrogen from grazing animals into urine and dung nitrogen. Report for MAF. Hamilton, AgResearch. 14 p.
- LIC 2011. New Zealand dairy statistics 2010–11. Hamilton, Livestock Improvement Corporation. 54 p.
- Luo J, Lindsey SB, Ledgard SF 2008. Nitrous oxide emissions from animal urine application on a New Zealand pasture. Biology and Fertility of Soils 44: 463–470. 10.1007/s00374-007-0228-4
- Macdonald KA, Williams Y, Dobson-Hill B 2010. Effectiveness of a nitrification inhibitor (DCn) on a Coastal Taranaki dairy farm. Proceedings of the New Zealand Grassland Association 72: 147–152.
- Menneer JC, Ledgard SF, Sprosen MS 2008. Soil N process inhibitors alter nitrogen leaching dynamics in a pumice soil. Australian Journal of Soil Research 46: 323–331. 10.1071/SR06180
- Moir JL, Cameron KC, Di HJ 2007. Effects of the nitrification inhibitor dicyandiamide on soil mineral N, pasture yield, nutrient uptake and pasture quality in a grazed pasture system. Soil Use and Management 23: 111–120. 10.1111/j.1475-2743.2006.00078.x
- Monaghan RM, Smith LC, Ledgard SF 2009. The effectiveness of a granular formulation of dicyandiamide (DCD) in limiting nitrate leaching from a grazed dairy pasture. New Zealand Journal of Agricultural Research 52: 145–159. 10.1080/00288230909510499
- Payne RW, Harding SA, Murray DA, Soutar DM, Baird DB, Welham SJ et al. 2008. GenStat® Release 11 Reference Manual – Part 2: Directives. Hemel Hempstead, VSN International.
- Sarathchandra SU 1978. Nitrification activities of some New Zealand soils and the effect of some clay types on nitrification. New Zealand Journal of Agricultural Research 21: 615–621. 10.1080/00288233.1978.10427457
- Schwarzer C, Haselwandter K 1996. Rapid quantification of the nitrification inhibitor dicyandiamide in soil samples, nutrient media and bacterial cell-free extracts. Journal of Chromatography A, 732: 390–393. 10.1016/0021-9673(95)01283-4
- Shepherd M, Wyatt J, Welten B, Ledgard S 2010. Form of nitrogen leaching from dairy cow urine and effectiveness of dicyandiamide: not all soils are equal. In: Gilkes RJ, Prakongkep N eds. Proceedings of the 19th World Congress of Soil Science International Union of Soil Sciences (IUSS), c/o Institut fur Bodenforschung, Universitat fur Bodenkultur. Pp. 2032–2035.
- Sprosen MS, Ledgard SF, Lindsey SB 2009. Effect of rate and form of dicyandiamide application on nitrate leaching and pasture production from a volcanic ash soil in the Waikato. New Zealand Journal of Agricultural Research 52: 47–55. 10.1080/00288230909510488
- van der Weerden TJ, Luo J, de Klein CAM, Hoogendoorn CJ, Littlejohn RP, Rys GJ 2011. Disaggregating nitrous oxide emission factors for ruminant urine and dung deposited onto pastoral soil. Agriculture, Ecosystems and Environment 141: 426–436. 10.1016/j.agee.2011.04.007
- Welten B, Kear M, Dexter M, Judge A 2012. Efficiency of DCD extraction from soils. In: Currie LD, Christensen CL eds. Advanced nutrient management: gains from the past – goals for the future. Occasional Report No. 25. Palmerston North, New Zealand, Fertilizer and Lime Research Centre, Massey University. 5 p. http://flrc.massey.ac.nz/publications.html (accessed 13 June 2014).
- Welten BG, Ledgard SF, Schipper LA, Judge AA 2013. Effect of amending cattle urine with dicyandiamide on soil nitrogen dynamics and leaching of urinary-nitrogen. Agricultural Ecosystems and Environment 167: 12–22. 10.1016/j.agee.2013.01.011