
Abstract
Significant areas of ruminant-grazed pastures are simultaneously covered by excreted urine and fertiliser nitrogen (N). However, the effect of overlapping N inputs on nitrous oxide (N2O) emission factors has not been studied. Three rates of 15N-labelled urea fertiliser were applied with either no urine, an autumn-urine or a spring-urine application. These treatments were applied to perennial ryegrass pasture (Lolium perenne L.) and N2O fluxes were determined over 373 days using standard static closed chamber techniques. Cumulative N2O-N fluxes ranged from 766 to 4332 g N2O-N ha–1 (0.36%–0.74% of total N applied) and were lowest in the absence of urine; however, no fertiliser rate effect occurred regardless of urine presence or season of application. Urine-elevated N2O-N fluxes followed urine applications for up to 40 days, resulting in lower fertiliser contributions to the N2O-N fluxes at these times. Total 15N recoveries as N2O-N were ≤0.04% and did not differ with fertiliser rate.
Introduction
Nitrous oxide (N2O) is a potent greenhouse gas (GHG) and is projected to play a significant role in stratospheric ozone depletion (Ravishankara et al. Citation2009). The global atmospheric N2O concentration has increased by 20% from 270 ppb in pre-industrial times (1750), to 324 ppb in 2011, with the rate of increase over the past three decades equal to 0.73 ± 0.03 ppb yr−1 (Ciais et al. Citation2013). New Zealand is unique in that, due to its large pastoral agricultural sector, N2O makes up a large proportion (17.2%) of its GHG emissions inventory (Ministry for the Environment Citation2012). In most other countries, N2O emissions contribute only 5%–10% of total GHG emissions (UNFCCC Citation2003). Understanding and mitigating agricultural N2O emissions from pastoral soils is therefore a key priority for New Zealand, if it is to achieve targets for reducing GHG emissions.
A significant proportion of the increase in the tropospheric N2O concentration has been attributed to anthropogenic emissions associated with the expansion and intensification of agricultural practices, particularly animal production systems (Davidson Citation2009; Reay et al. Citation2012; Clough et al. Citation2013). It is estimated that approximately 40% of global N2O emissions arise via microbial transformation (e.g. denitrification) of agricultural nitrogen (N) inputs (Denman et al. Citation2007; Davidson Citation2009; Schils et al. Citation2013).
Within grazed pasture systems, N inputs include the deposition of excreta (urine and dung) and the application of fertiliser N, often as urea. The area of pasture covered by ruminant excretal returns depends on grazing management. Under intensive rotational grazing conditions in New Zealand, with stocking rates of 2–3.5 cows per hectare, Moir et al. (Citation2011) found that, on average, 5.8% of the grazed paddock area received urine during a single grazing event, while on an annual basis, the average urine patch coverage for the grazed paddock was 23.2% of the total area. Dennis et al. (Citation2011) found similar results for Irish pastures when stocking rates were 2–2.9 cows per hectare, with 14.1%–20.7% of the soil surface wetted by urine on an annual basis. In grazed pastures, the rates of fertiliser application typically do not exceed 200 kg N ha–1 per annum and these annual applications are often split into multiple applications in an effort to optimise fertiliser N supply with plant demand over the grazing season (NZFA Citation2013). These fertiliser applications are, more often than not, carried out immediately after a grazing event to maximise dry matter production in the interval between grazing.
It is well documented that N2O emissions increase under ruminant urine patches due to the introduction of an organic carbon source, increased availability of mineral N substrate and increased soil moisture (de Klein et al. Citation2003; Clough et al. Citation2005, 2009; de Klein & Ledgard Citation2005; Di & Cameron Citation2008). This is because the amount of N deposited in urine patches far exceeds the pasture plants’ immediate demands (Haynes & Williams Citation1993) and so the excess N is readily available for numerous N2O production mechanisms (Wrage et al. Citation2001). Increased N2O emissions also occur following fertiliser N applications (de Klein et al. Citation2001; Hyde et al. Citation2006; Shcherbak et al. Citation2014).
Nitrous oxide emission factors (EF) are used to determine excreta and fertiliser contributions for a given country's N2O inventory (IPCC Citation2006). They represent the ratio of N2O-N emitted from a soil that receives an N input, minus the N2O-N emitted from the soil not receiving N, divided by the amount of N applied. The IPCC guidelines stipulate default emission factors for EF1 (N additions from mineral fertilisers) and EF3PRP (excretal N inputs to pasture range or paddock) as 0.01 and 0.02 kg N2O-N kg–1 N input, respectively (IPCC Citation2006). However, many countries have also determined ‘country specific’ EF values. For example, in New Zealand the emission factors for assessing N2O contributions from urine (EF3PRP) and fertiliser N (EF1) are both set at 0.01 kg N2O-N kg–1 N input.
To date, the IPCC guidelines have assumed a linear relationship between N2O emissions and the rate of N input. However, it is becoming increasingly accepted that increasing the rate of fertiliser N inputs can lead to an exponential increase in the rate of N2O emissions, particularly when N fertiliser application rates exceed plant requirements (McSwiney & Robertson Citation2005; Hoben et al. Citation2011; Signor et al. Citation2013; Masaka et al. Citation2014; Shcherbak et al. Citation2014). Thus when fertiliser N is applied to grazed pastures and covers urine patches (areas already high in N) the percentage of fertiliser N applied that is subsequently evolved as N2O might be expected to be greater than when fertiliser is deposited on to non-urine-affected soils. The rationale for this is based on the fact that following urine deposition, the soil N concentration under the urine patch is high and in excess of the pasture plants’ immediate demand, and so a further input of N from fertiliser enhances the microbially available N in the soil. Furthermore, urine patches can enhance denitrifying conditions by promoting soil carbon release (Monaghan & Barraclough Citation1993; Lovell & Jarvis Citation1996; Clough et al. Citation2004). Considering that the entire pasture area of a dairy farm receives fertiliser, and that c. 20% of such a farm's pasture area may be exposed to ruminant urine, the consequences of an elevated EF1 value in the urine patch area may be significant for N2O inventory assessments. For example, assuming a 200 ha dairy farm applies 200 kg N ha–1 per annum then, using an EF1 value of 0.01 kg N2O-N kg–1 N input, 400 kg of N2O-N will be emitted per annum. If, over the course of the fertiliser applications, 20% of the fertiliser falls on to urine patches where, assuming no seasonal effects, the combined effect of these N inputs is to elevate the fertiliser EF1 value to an assumed rate of 0.02 kg N2O-N kg–1 N input, then the total fertiliser-derived N2O emissions would increase by 20%.
Even though the application of fertiliser post grazing is routinely practised, there appear to have been no studies specifically designed to evaluate fertiliser N2O emissions following fertiliser N deposition on to urine patches. We hypothesised that fertiliser N applied on to urine patches would exacerbate N2O-N emissions from the fertiliser N applied. Thus the objectives of this research were to use 15N-labelled urea fertiliser to determine: (1) if the deposition of urea fertiliser on to a urine patch enhanced total and/or fertiliser-derived N2O emissions (EF1); (2) if such effects were seasonal; and (3) if the fertiliser rate affects seasonal effects.
Materials and methods
A lysimeter experiment was performed to measure pastoral N2O emissions under different urea fertiliser rates and urine treatments as previously reported (Buckthought et al. Citation2015). In brief, 36 undisturbed soil monolith lysimeters, 50 cm diameter, 70 cm deep, were collected from the AgResearch No. 1 Dairy Farm in Ruakura, Hamilton, New Zealand (37.779°S, 175.315°E). The soil, a free-draining Horotiu silt loam (Typic Orthic Allophanic), was under ryegrass (Lolium perenne L.) and white clover (Trifolium repens) and had not been grazed or fertilised for at least 4 months prior to the lysimeter collection. The basic soil properties are presented in .
Table 1 Basic soil properties (0–7.5 cm depth).
The lysimeters were collected on 14 December 2010 and transported to a field trench facility where they were installed in the ground at the same level as the surrounding pasture surface. The lysimeters immediately received 25 kg N ha–1 as urea followed by 10 mm of water to stimulate pasture growth and to break drought conditions. Prior to the beginning of the experiment, 800 mm of water (>1 pore volume) was applied to the lysimeters over a 10 day period to leach any antecedent nitrate (NO3–) from the soil. The experiment began on 21 February 2011 and continued until 28 February 2012 (373 days).
Experiment design and treatments
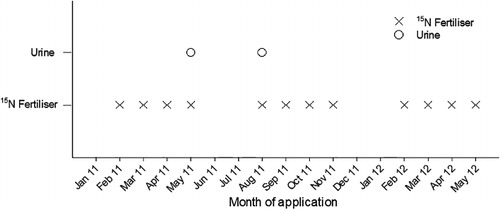
Nine treatments, each with four replicates, were arranged in a randomised complete block design. Three treatments consisted of urea fertiliser, applied in solid form at rates of 0, 200 and 400 kg N ha–1 yr–1 evenly split into applications of 0, 25 and 50 kg N ha–1, respectively, but with nil urine applied. These are subsequently referred to as F0U0, F2U0 and F4U0 (). A further three treatments had the same fertiliser treatments, but they also received a single bovine urine-N treatment applied in the autumn on day 73, at a rate of 800 kg N ha–1 (applied c. 15 min prior to the fertiliser) and these treatments are subsequently referred to as F0UA, F2UA and F4UA (). The final three treatments also received the same fertiliser and urine treatments, except the urine was applied in spring, on day 193, and these treatments are subsequently referred to as F0US, F2US and F4US ().
Table 2 Details of urine and fertiliser treatments applied to lysimeters.
In order to determine the urea fertiliser's contribution to the N2O emissions, it was enriched with 15N (5 atom%). The 200 kg N ha–1 yr–1 fertiliser represented standard fertiliser practice for dairy farms in the Waikato region, while the 400 kg N ha–1 yr–1 rate represented a more intensive system. Fertiliser applications were promptly irrigated in with 10 mm of deionised water to reduce NH3 volatilisation losses (Black et al. Citation1987).
Fresh dairy cow urine was collected from the AgResearch Tokanui dairy farm, 1 day prior to each urine application, and standardised to a concentration of 8.0 g N L–1. Urine (1.8 L) was applied on either 4 May 2011 (day 73, for autumn treatments) or 31 August 2011 (day 192, for spring treatments). The urine concentration and volume were selected based on previously reported pastoral grazing studies (Petersen et al. Citation1956; Davies et al. Citation1962; Richards & Wolton Citation1976; Safley et al. Citation1984; Haynes & Williams Citation1993). The urine was irrigated in with 10 mm of water to reduce NH3 volatilisation. When water was applied to irrigate in fertiliser and/or urine, the same rate of irrigation (10 mm) was applied to all lysimeters, including controls. Timings of treatment applications are shown in .
Nitrous oxide sample collection and analysis
The lysimeter casings were affixed with stainless steel annular water-filled channels which facilitated sealing of the headspace chambers. The headspace chambers (internal volume 17.6 L) were equipped with a three-way stopcock and a sealable vent (ensuring equilibrated air pressure). The chambers were insulated with Styrofoam to avoid temperature fluctuations during gas measurements.
Using a 50 mL syringe equipped with a three-way stopcock, headspace gas was gently flushed twice through the syringe. A 10 mL sample was then collected and injected into a previously evacuated (<0.01 atm) 6 mL glass vial (Exetainer®; Labco, High Wycombe, UK). Sampling occurred 0, 30 and 60 min after positioning headspace chambers, with ambient air samples also collected to determine background N2O concentrations. Nitrous oxide sampling was undertaken twice a week for the first 2 weeks following any fertiliser and/or urine treatment application, and once a week thereafter. A total of 59 N2O measurements were collected over the 373 day experiment.
Gas samples were also collected after 180 min for N2O-15N analysis by taking a 20 mL sample and injecting this into a previously evacuated 12 mL vial (Exetainer®; Labco, High Wycombe, UK). Headspace gas samples for N2O-15N were collected less frequently, once a week for the first 2 weeks following fertiliser and/or urine application, and once every 2 weeks thereafter. Samples for 15N2O analysis were collected from all the 15N fertiliser treatments, but from only two replicates of the control (F0U0) treatment.
Analysis of the headspace gas was performed using a gas chromatograph (GC) (model 8610; SRI Instruments, Torrance, CA, USA) interfaced to a liquid autosampler (model 222XL; Gilson, Middleton, WI, USA). The autosampler had been modified for gas analysis by substituting a purpose-built (PDZ-Europa, Crewe, UK) double-concentric injection needle, allowing the entire gas sample to be flushed swiftly into the GC. The GC configuration included two 0.3 cm OD stainless steel columns packed with Haysep Q connected in series, oxygen-free dry N carrier gas (40 mL min–1) and a 63Ni electron capture detector at 320 °C. Reference gases (0.363–35.2 µL L–1, BOC, Auckland, New Zealand) were used to prepare standard curves. The detection limit for N2O was 0.01 µL L–1 greater than the ambient concentration. Analysis of gas samples for 15N enrichment was performed using a continuous flow isotope ratio mass spectrometer (Sercon 20/20; Sercon, Cheshire, UK). The samples were analysed for N2O concentration and 15N enrichment. The N2O-15N recovered as a percentage of the total 15N fertiliser applied was calculated according to Cabrera & Kissel (Citation1989). Soil N2O fluxes were calculated using the method of Hutchinson & Mosier (Citation1981). Cumulative N2O fluxes were determined by integrating fluxes over time using a trapezoidal method. The contribution of the fertiliser 15N-derived N2O to the total flux was determined by taking the ratio of ‘moles of 15N enriched N2O evolved’ to the ‘total moles of N2O evolved’ (enriched plus unenriched) and expressing this as a percentage.
Leachate and pasture N dynamics were also measured using this experimental setup, the results of which are published in Buckthought et al. (Citation2015).
Throughout the experiment, climate data including rainfall were collected daily from the Ruakura weather station (NIWA Citation2007), located 0.1 km from the lysimeter site.
Statistical analysis
Statistical analyses were performed using the ANOVA directive of GenStat (15th edition). The least significant difference (LSD) was used to determine statistical variation between the sample means at the 5% significance level. The standard error of the difference (SED) was calculated by dividing the LSD (5%) by the t value (at the 5% significance level). Non-normally distributed data were log-transformed (natural log) prior to statistical analysis. Raw N2O-N flux data that was ≤0 was adjusted to a value of 0.001 g N2O-N ha–1 d–1 (half the minimum recorded flux) prior to log transformation. Where transformation was required, all conclusions were drawn from the analysis on the transformed scale; however, to maintain standard units, the means and error presented are the back-transformed data.
Results
Climate data
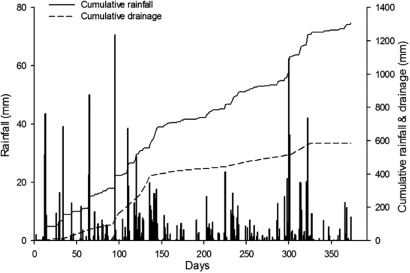
Total rainfall over the study period was 1307 mm (), which is higher than the annual average (1200 mm). This rainfall did not include the 80 mm (8 × 10 mm) simulated rainfall applied after the split fertiliser applications. There was uncharacteristically high rainfall in December 2011 (220 mm) and early January 2012 (130 mm) that resulted in summer soil drainage. The daily air temperature ranged from 1.0 to 23.5 °C and averaged 12.4 °C. Daily soil temperatures at 10 cm depth averaged 13.9 °C, ranging from 4.5 to 22 °C. There were 16 frost days during the study. Winter drainage from soil commenced on day 35 (late March 2011) and continued until day 250 (late October 2011), however most of the drainage occurred between days 69–145 (May–July 2011) ().
Nitrous oxide emissions
Daily N2O-N fluxes
In the absence of fertiliser and urine, the F0U0 treatment had N2O-N fluxes ranging from 0–6 g N2O-N ha–1 d–1, except on day 95 where the flux was 20 g N2O-N ha–1 d–1 (). In the non-urine treatments that received fertiliser (F2U0 and F4U0) the N2O-N fluxes ranged from 3–41 g N2O-N ha–1 d–1 (). Following autumn-urine application, N2O-N fluxes increased to peak at 310, 210 and 143 g N2O-N ha–1 d–1 in treatments F0UA, F2UA and F4UA, respectively (). Within 26 days of autumn-urine being applied, the N2O-N fluxes equalled those of the non-urine treatments (). After spring-urine application, N2O-N fluxes peaked twice. The first peak occurred 13 days after urine was applied, with mean fluxes of 81, 88 and 55 g N2O-N ha–1 d–1 in the F0US, F2US and F4US treatments, respectively (). The second peak occurred 33 days after urine application with mean fluxes of 141, 104 and 83 g N2O-N ha–1 d–1 for the F0US, F2US and F4US treatments, respectively (). After 40 days, the spring-urine-induced N2O-N fluxes had returned to control levels ().
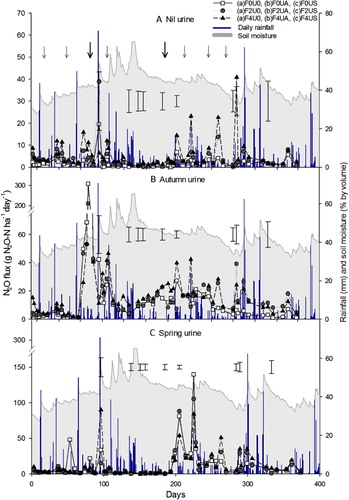
Following fertiliser application events there were short periods of elevated N2O-N fluxes, most readily seen in the absence of urine (). On days 3, 79, 81, 101, 103, 107, 123, 205, 225 and 264, the N2O-N fluxes were, on average, greater (P < 0.05) under the 400 kg N ha–1 fertiliser rate than the 200 kg N ha–1 rate. Urine application (spring or autumn) resulted in higher (P < 0.001) daily N2O-N fluxes, when comparing the given seasonal urine treatment with those treatments not receiving urine.
Fertiliser 15N enrichment and recovery as N2O-N
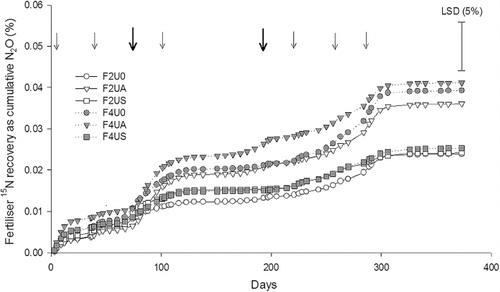
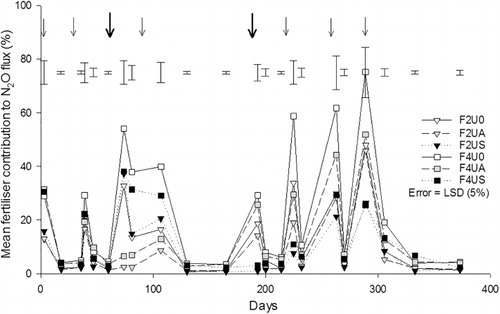
The 15N enrichment of the N2O-N evolved ranged from 0.38–4.13 atom% 15N. A fertiliser rate effect occurred with N2O-15N enrichment higher under the 400 kg N ha–1 rate on every day of measurement (P < 0.05 to P < 0.001) except day 39, when averaged across urine treatments. Between days 74 and 107, an interaction between urine and fertiliser treatments resulted in lower N2O-15N enrichment in autumn-urine treatments and higher N2O-15N enrichment in non- or spring-urine treatments where 400 kg N ha–1 of fertiliser was applied. From days 193 to 225, a urine treatment effect also caused N2O-15N enrichment to be lower (P < 0.05 to P < 0.001) under spring-urine treatments, when averaged across fertiliser treatments. Cumulative recoveries of fertiliser 15N as N2O-15N were ≤0.04% (). Higher 15N recovery occurred under the autumn-urine treatments (0.04%; P < 0.05) than in the spring-urine treatments (0.03%). Cumulative recoveries of fertiliser 15N as N2O-15N were not affected by fertiliser rate or fertiliser by urine treatment interactions.
The urea-15N fertiliser contribution to the daily N2O-N emission fluxes ranged from 0.7%–75.2% with urine-N and/or soil-N contributions making up the difference (24.8%–99.3%). The fertiliser contribution to the N2O-N emissions was greater (P < 0.05) under the 400 kg N ha–1 treatment (). On days 74 to 107, following autumn-urine application (day 73), there was a lower (P < 0.01) contribution from fertiliser-15N to the N2O fluxes evolved (). An interaction (P < 0.05) between the fertiliser and urine treatments occurred on days 81 and 87, following autumn-urine application, with non-autumn urine treatments having N2O fluxes with a higher fertiliser-15N contribution at 400 kg N ha–1 yr–1 (). There was also a urine treatment effect following spring-urine application (day 193), from days 193 to 225, with a lower (P < 0.05) fertiliser-15N contribution to the N2O flux evolved following the spring-urine application. No interaction between urine and fertiliser treatments was observed following the spring-urine application.
Cumulative N2O fluxes and emission factors
Cumulative N2O-N fluxes over the 373 day period ranged from 766–4332 g N2O-N ha–1 (). The lowest cumulative fluxes (P < 0.05) occurred in the absence of urine where there was no fertiliser treatment effect (; ). The highest cumulative N2O-N fluxes occurred in the autumn-urine treatment, where the F2UA and F4UA treatments had higher (P < 0.05) N2O-N fluxes than the spring-urine treatments (; ). Fertiliser rate did not affect the magnitude of these cumulative N2O-N fluxes under autumn-urine applications (). The cumulative N2O-N flux from the F0UA treatment did not differ from any of the spring-urine treatments. All spring-urine treatments had higher cumulative N2O-N fluxes compared with the non-urine treatments (P < 0.05), but there was no fertiliser rate effect (; ). The rate of increase in cumulative N2O-N emissions was most rapid after urine application events ().
Table 3 Cumulative N2O-N fluxes as a percentage of total N applied and as an emission factor for total N applied.
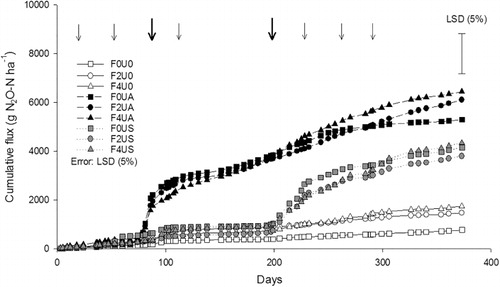
Cumulative N2O fluxes as a percentage of the total N applied (fertiliser plus urine) were lowest (P < 0.05) in the spring-urine treatments receiving fertiliser and the F4U0 treatment, and highest (P < 0.05) in the F2U0 treatment (), and ranged from 0.36%–0.74% of the total N applied (). Calculating emission factors using the combined total N inputs showed the highest emission factor occurred in the autumn-urine treatment receiving no fertiliser, with further fertiliser inputs having no effect on the emission factor (). The combined emission factor in the spring-urine treatments did not differ from the autumn-urine treatments and was also unaffected by fertiliser inputs (). In the absence of urine but with 400 kg of N applied (F4U0) the emission factor was significantly lower () than in the autumn-urine treatment without N (F0UA). The recovery of 15N as N2O demonstrates that the emission factor values, based solely on fertiliser N applied (EF1), were ≤0.04 on average, as noted above.
Discussion
Increased N2O fluxes following urine application in both the spring and autumn were typical of those previously observed following urine application to pasture soils. For example, Di et al. (Citation2007) measured an N2O peak of c. 300 g N2O-N ha–1 day–1 under autumn-applied urine on a Horotiu soil, which was very similar to that measured under autumn urine in this study. Previous studies have, however, reported much higher N2O emission peaks of 500–2000 g N2O-N ha–1 day–1 from under autumn-applied urine (Di & Cameron Citation2003, 2006; Clough et al. Citation2009) and up to 700 g N2O-N ha–1 day–1 from spring-applied urine (Di & Cameron Citation2003). Reasons for higher daily fluxes from some of these previous studies may include higher urine-N application rates of up to 1000 kg N ha–1 and the application of irrigation (Di & Cameron Citation2003, Citation2006). Urine application enhances pasture soil N2O emissions because it provides a substantial quantity of N substrate, over and above the plants’ immediate demand. This surplus N becomes available for the microbial processes, such as nitrification, nitrifier-denitrification and denitrification, which generate N2O (Wrage et al. Citation2001). In addition the application of ruminant urine also releases soil carbon (Lambie et al. Citation2012) which may enhance heterotrophic denitrification and N2O formation.
Nitrous oxide fluxes from urine patches may also vary with the season in which urine deposition occurs. If ruminant urine is deposited in the wetter, colder months of the year (autumn/winter), higher N2O emissions may occur relative to the warmer and drier months of the year (spring/summer) (Luo et al. Citation1999; de Klein et al. Citation2004; Di & Cameron Citation2008). This is because in the autumn/winter months there is reduced pasture growth and a decreased demand for N, consequently, there is a greater availability of NO3– substrate for denitrifying bacteria, along with higher soil water contents generating more anaerobic sites for denitrification to occur. These factors may explain the higher daily N2O-N fluxes observed under the autumn-urine treatments. In the current study, the cumulative N2O fluxes observed under the autumn-urine treatment in the absence of fertiliser were not statistically different from those measured in the spring-urine treatment (), although there was a trend for the autumn-urine treatment to have higher cumulative fluxes, possibly due to a decrease in plant demand for N since soil moisture contents during the periods of elevated N2O fluxes were very similar (). Greater replication may have shown a statistical difference.
The periods of increased N2O flux observed following the spring and autumn urine applications in the current study, at 40 and 26 days respectively, were also characteristic of the enhanced N2O flux periods previously observed following ruminant urine application to pasture (e.g. Clough et al. Citation2009; Ledgard et al. Citation2014) and are a function of substrate supply and resulting microbial activity. The longer period of elevated daily fluxes in the autumn-urine treatment may have been due to a reduced pasture demand for N at this time.
Nitrous oxide emission factors for urine patches generally range from 0.1%–4% of the urine applied (de Klein et al. Citation2001), but may reach up to 14% on poorly drained clay soils (Lovell & Jarvis Citation1996; de Klein et al. Citation2001). Thus, in the current study, urine-induced N2O emission factors in the absence of fertiliser (EF3PRP) were at the lower range of these values (). This may have been a consequence of the higher than average, well-distributed annual rainfall contributing to soil moisture conditions that favour complete denitrification of N2O to N2. Alternatively, the higher than average rainfall may have caused nitrate to be moved deeper into the soil profile, thus reducing the potential for N2O emission at the soil surface due to further complete denitrification occurring.
Increasing fertiliser rates did not increase cumulative N2O emissions greater than background levels, probably due to the split fertiliser application regime which saw only 25 and 50 kg N ha–1 fertiliser, respectively, applied at any one time, thus supporting the practice of split fertiliser applications as a practical and effective N2O loss mitigation strategy (Di & Cameron Citation2002).
The total fertiliser 15N recovery as N2O-15N was comparatively low (≤0.04%) when compared with other fertiliser studies where 15N recovery of urea as N2O has been observed to range from c. <1%–3.5% (e.g. Di & Cameron Citation2008; Phillips et al. Citation2013). Differences in 15N recovery occur due to studies varying in duration, season, management and fertiliser. In this current study, the fate of urea fertiliser was followed, for the first time, over a full year and over eight split applications of urea-15N. Given that fertiliser applications were applied to optimise pasture production, and only applied when pasture was actively growing, this may have contributed to reduced N2O emissions from the fertiliser pool. Alternatively, the above average rainfall may have promoted fertiliser N to be lost as N2 as noted above. It is also possible that higher frequency of sampling for N2O fluxes may have resulted in a greater recovery of 15N as N2O.
The initial objective of this study was to determine if the application of urea fertiliser over a urine patch enhanced the total and/or fertiliser-derived N2O emissions. The results demonstrate that application of fertiliser, regardless of rate, did not increase cumulative N2O-N losses from autumn- or spring-urine treatments (). Expressing the cumulative N2O-N flux as a percentage of the total N applied (fertiliser plus urine) also showed no increases as a consequence of fertiliser application or rate. Similarly, the combined emission factor (EF1+PRP), based on total N inputs did not increase as a result of fertiliser application, regardless of rate. In fact there was a tendency, although not statistically significant, for the combined emission factor to decline as fertiliser rate increased (). The fact these various measures (relating N2O emissions to N inputs) demonstrated no significant additional N2O emissions as a result of increasing N inputs, is at odds with the original hypothesis that N2O emissions would increase following fertiliser addition to urine patches. This suggests that the fertiliser N applied, in addition to urine, was used more efficiently or that its loss was not as N2O.
Since the annual fertiliser N inputs (200 or 400 kg N ha–1 yr–1) were applied as eight evenly split fertiliser dressings, the rates of N application did not exceed the pasture's ability to utilise the fertiliser N (Di & Cameron Citation2002). Conversely, bovine urinary-N excreta deposition rates are known to exceed pasture N requirements by several-fold, contributing to gaseous and leaching losses of N (Haynes & Williams Citation1993; Cameron et al. Citation2013). The current study shows that, within the fertiliser-excreta interface, urine application elevated N2O fluxes for 40 and 26 days following spring and autumn urine applications, respectively, with the bulk of this additional N2O coming from urine-N, since fertiliser contributions to the total N2O flux were diminished for c. 33 days regardless of season that urine was applied (). Thus, under the management conditions imposed, whereby 200 kg of fertiliser N ha–1 was typical of dairy farm systems, N2O emissions from fertiliser-15N were influenced by urinary-N derived N2O emissions for only four of the eight split-fertiliser applications, at most. Thus while total N rates increased with fertiliser a large percentage of this fertiliser N was not influenced by urine-N and likely to be used more efficiently by the pasture. This potentially explains the trend for the combined emission factor (EF1+PRP) to decline as fertiliser inputs increased under a urine patch. Thus on a farm system basis, the effect of a urine patch on annual fertiliser-derived N2O-N losses was negligible.
Conclusions
It can be concluded that, under the management conditions imposed in the current study, the overlap of fertiliser at the fertiliser-urine patch interface does not lead to an increase in the N2O emission factors for either fertiliser or urine excreted on to pasture, EF1 and EFPRP, respectively, and that there were no significant seasonal or fertiliser rate effects as a result of fertiliser-urine overlaps.
Acknowledgements
This research was funded by the Pastoral 21 programme, a collaborative venture between DairyNZ, Fonterra, Dairy Companies Association of New Zealand, Beef + Lamb NZ and the Ministry of Business, Innovation and Employment. The statistical analyses were carried out by Dr John Waller, formerly of AgResearch Ltd. Nitrous oxide analysis and 15N analysis was carried out by Manjula Premeratne and Roger Cresswell, respectively, of Lincoln University.
References
- Black AS, Sherlock RR, Smith NP 1987. Effect of timing of simulated rainfall on ammonia volatilization from urea, applied to soil of varyingmoisture content. Journal of Soil Science 38: 679–687.doi:[10.1111/j.1365-2389.1987.tb02165.x]
- Buckthought L, Clough TJ, Cameron KC, Di HJ, Shepherd MA 2015. Urine patch and fertiliser N interaction: effects of fertiliser rate and season of urine application on nitrate leaching and pasture N uptake. Agriculture, Ecosystems & Environment 203: 19–28.doi:[10.1016/j.agee.2015.01.019]
- Cabrera ML, Kissel DE 1989. Review and simplification of calculations in 15N tracer studies. Fertilizer Research 20: 11–15.doi:[10.1007/BF01055396]
- Cameron KC, Di HJ, Moir JL 2013. Nitrogen losses from the soil/plant system: a review. Annals of Applied Biology 162: 145–173.doi:[10.1111/aab.12014]
- Ciais P, Sabine C, Bala G, Bopp L, Brovkin V, Canadell J et al. 2013. Climate change 2013: the physical science basis. Working Group I contribution to the IPCC fifth assessment report. Summary for policymakers. Chapter 6: Carbon and other biogeochemical cycles. Stockholm, Intergovernmental Panel on Climate Change. 105 p.
- Clough TJ, Kelliher FM, Sherlock RR, Ford CD 2004. Lime and soil moisture effects on nitrous oxide emissions from a urine patch. Soil Science Society of America Journal 68: 1600–1609.doi:[10.2136/sssaj2004.1600]
- Clough TJ, Müller C, Laughlin RJ 2013. Using stable isotopes to follow excreta N dynamics and N2O emissions in animal production systems. Animal 7: 418–426.doi:[10.1017/S1751731113000773]
- Clough TJ, Ray JL, Buckthought LE, Calder J, Baird DB, O’Callaghan M et al. 2009. The mitigation potential of hippuric acid on N2O emissions from urine patches: an in situ determination of its effect. Soil Biology and Biochemistry 41: 2222–2229.doi:[10.1016/j.soilbio.2009.07.032]
- Clough TJ, Sherlock RR, Rolston DE 2005. A review of the movement and fate of N2O in the subsoil. Nutrient Cycling in Agroecosystems 72: 3–11.doi:[10.1007/s10705-004-7349-z]
- Davidson EA 2009. The contribution of manure and fertilizer nitrogen to atmospheric nitrous oxide since 1860. Nature Geoscience 2: 659–662.doi:[10.1038/ngeo608]
- Davies EB, Hogg DE, Hopewell HG 1962. Extent of return of nutrient elements by dairy cattle: possible leaching losses. Palmerston North, Transactions of International Society of Soil Science Palmerston North. Pp. 715–720.
- de Klein CAM, Barton L, Sherlock RR, Li Z, Littlejohn RP 2003. Estimating a nitrous oxide emission factor for animal urine from some New Zealand pastoral soils. Australian Journal of Agricultural Research 41: 381–399.
- de Klein CAM, Ledgard SF 2005. Nitrous oxide emissions from New Zealand agriculture – key sources and mitigation strategies. Nutrient Cycling in Agroecosystems 72: 77–85.doi:[10.1007/s10705-004-7357-z]
- de Klein CAM, Li Z, Sherlock RR 2004. Determination of the N2O emission factors from animal excreta or urea fertiliser, following a winter application in two regions of New Zealand. A final report of an N2O net study from August 2003 to June 2004. Wellington, New Zealand, Ministry of Agriculture and Forestry.
- de Klein CAM, Sherlock RR, Cameron KC, van der Weerden TJ 2001. Nitrous oxide emissions from agricultural soils in New Zealand—a review of current knowledge and directions for future research. Journal of the Royal Society of New Zealand 31: 543–574.
- Denman KL, Brasseur G, Chidthaisong A, Ciais P, Cox PM, Dickinson RE et al. 2007. Couplings between changes in the climate system and biogeochemistry. In: Solomon S, Qin D, Manning M, Chen Z, Marquis M, Averyt KB et al. eds. Climate change 2007: the physical science basis. Contribution of Working Group I to the fourth assessment report of the intergovernmental panel on climate change. Cambridge, UK, Cambridge University Press. Pp. 499–587.
- Dennis SJ, Moir JL, Cameron KC, Di HJ, Hennessy D, Richards KG 2011. Urine patch distribution under dairy grazing at three stocking rates in Ireland. Irish Journal of Agricultural and Food Research 50: 149–160.
- Di HJ, Cameron KC 2002. Nitrate leaching in temperate agroecosystems: sources, factors and mitigating strategies. Nutrient Cycling in Agroecosystems 64: 237–256.doi:[10.1023/A:1021471531188]
- Di HJ, Cameron KC 2003. Mitigation of nitrous oxide emissions in spray-irrigated grazed grassland by treating the soil with dicyandiamide, a nitrification inhibitor. Soil Use and Management 19: 284–290.doi:[10.1079/SUM2003207]
- Di HJ, Cameron KC 2006. Nitrous oxide emissions from two dairy pasture soils as affected by different rates of a fine particle suspension nitrification inhibitor, dicyandiamide (DCD). Biology and Fertility of Soils 42: 472–480.
- Di HJ, Cameron KC 2008 Sources of nitrous oxide from 15N-labelled animal urine and urea fertiliser with and without a nitrification inhibitor, dicyandiamide (DCD). Australian Journal of Soil Research 46: 76–82.
- Di HJ, Cameron KC, Sherlock RR 2007. Comparison of the effectiveness of a nitrification inhibitor, dicyandiamide, in reducing nitrous oxide emissions in four different soils under different climatic and management conditions. Soil Use and Management 23: 1–9.doi:[10.1111/j.1475-2743.2006.00057.x]
- Haynes RJ, Williams PH 1993a. Nutrient cycling and soil fertility in the grazed pasture ecosystem. Advances in Agronomy. Vol 49. San Diego, CA, Academic Press Inc. Pp. 119–199.
- Haynes RJ, Williams PH 1993b. Nutrient cycling and soil fertility in the grazed pasture ecosystem. Advances in Agronomy 49: 119–199.doi:[10.1016/S0065-2113(08)60794-4]
- Hoben JP, Gehl RJ, Millar N, Grace PR, Robertson GP 2011. Nonlinear nitrous oxide (N2O) response to nitrogen fertilizer in on-farm corn. Crops of the US Midwest 17: 1140–1152.
- Hutchinson GL, Mosier AR 1981. Improved soil cover method for field measurement of nitrous oxide fluxes. Soil Science Society of America Journal 45: 311–316.doi:[10.2136/sssaj1981.03615995004500020017x]
- Hyde BP, Hawkins MJ, Ryan M, Carton OT 2006. Nitrous oxide emissions from a fertilized grazed grassland in Ireland. International Congress Series 1293: 351–354.doi:[10.1016/j.ics.2006.03.002]
- IPCC 2006. 2006 IPCC guidelines for national greenhouse gas inventories. Prepared by the National Greenhouse Gas Inventories Programme. In: Eggleston HS, Buendia L, Miwa K, Ngara T, Tanabe K eds. Kamiyamaguchi, IGES.
- Lambie SM, Schipper LA, Balks MR, Baisden WT 2012. Solubilisation of soil carbon following treatment with cow urine under laboratory conditions. Soil Research 50: 50–57.doi:[10.1071/SR11195]
- Ledgard SF, Luo J, Sprosen MS, Wyatt JB, Balvert SF, Lindsey SB 2014. Effects of the nitrification inhibitor dicyandiamide (DCD) on pasture production, nitrous oxide emissions and nitrate leaching in Waikato, New Zealand. New Zealand Journal of Agricultural Research 57: 294–315.doi:[10.1080/00288233.2014.928642]
- Lovell RD, Jarvis SC 1996. Effects of urine on soil microbial biomass, methanogenesis, nitrification and denitrification in grassland soils. Plant and Soil 186: 265–273.doi:[10.1007/BF02415522]
- Luo J, Tillman RW, Ball PR 1999. Grazing effects on denitrification in a soil under pasture during two contrasting seasons. Soil Biology and Biochemistry 31: 903–912.doi:[10.1016/S0038-0717(99)00012-7]
- Masaka J, Nyamangara J, Wuta M 2014. Nitrous oxide emissions from wetland soil amended with inorganic and organic fertilizers. Archives of Agronomy and Soil Science 60: 1363–1387.doi:[10.1080/03650340.2014.890707]
- McSwiney CP, Robertson GP 2005. Nonlinear response of N2O flux to incremental fertilizer addition in a continuous maize (Zea mays L) cropping system. Global Change Biology 11: 1712–1719.doi:[10.1111/j.1365-2486.2005.01040.x]
- Ministry for the Environment 2012. New Zealand's greenhouse gas inventory 1990–2010. Wellington, New Zealand Government.
- Moir JL, Cameron KC, Di HJ, Fertsak U 2011. The spatial coverage of dairy cattle urine patches in an intensively grazed pasture system. Journal of Agricultural Science 149: 473–485.doi:[10.1017/S0021859610001012]
- Monaghan RM, Barraclough D 1993. Nitrous oxide and dinitrogen emissions from urine-affected soil under controlled conditions. Plant and Soil 151: 127–138.doi:[10.1007/BF00010793]
- NIWA 2007. The national climate database. National Institute of Water and Atmospheric Research. http://cliflo.niwa.co.nz / (accessed 24 April 2012).
- NZFA 2013. Code of practice for nutrient management (with emphasis on fertiliser use). Wellington, New Zealand Fertiliser Association. ISBN 978-0-473-28345-2.
- Petersen RG, Lucas HL Jr, Woodhouse WW 1956. The distribution of excreta by freely grazing cattle and its effect on pasture fertility 1. Excretal distribution Agronomy Journal 48: 440–444.
- Phillips R, Griffith DWT, Dijkstra FA, Lugg G, Lawrie R, Macdonald B 2013. Tracking short-term effects of nitrogen-15 addition on nitrous oxide fluxes using fourier-transform infrared spectroscopy. Journal of Environmental Quality 42: 1327–1340.doi:[10.2134/jeq2013.02.0067]
- Ravishankara AR, Daniel JS, Portmann RW 2009. Nitrous oxide (N2O): the dominant ozone-depleting substance emitted in the 21st century. Science 326: 123–125.doi:[10.1126/science.1176985]
- Reay DS, Davidson EA, Smith KA, Smith P, Melillo JM, Dentener F et al. 2012. Global agriculture and nitrous oxide emissions. Nature Climate Change 2: 410–416.
- Richards IR, Wolton KM 1976. The spatial distribution of excreta under intensive cattle grazing. Grass and Forage Science 31: 89–92.doi:[10.1111/j.1365-2494.1976.tb01123.x]
- Safley LM, Barker JC, Westerman PW 1984. Characteristics of fresh dairy manure. Transactions of the American Society of Agricultural Engineers 27: 1150–1153.doi:[10.13031/2013.32937]
- Schils RLM, Eriksen J, Ledgard SF, Vellinga TV, Kuikman PJ, Luo J et al. 2013. Strategies to mitigate nitrous oxide emissions from herbivore production systems. Animal 7: 29–40.doi:[10.1017/S175173111100187X]
- Shcherbak I, Millar N, Robertson GP 2014. Global metaanalysis of the nonlinear response of soil nitrous oxide (N2O) emissions to fertilizer nitrogen. Proceedings of the National Academy of Sciences in the United States of America 111: 9199–9204.doi:[10.1073/pnas.1322434111]
- Signor D, Cerr CEP, Conant R 2013. N2O emissions due to nitrogen fertilizer applications in two regions of sugarcane cultivation in Brazil. Environmental Research Letters 8: 015013.doi:[10.1088/1748-9326/8/1/015013]
- UNFCCC 2003. Synthesis and assessment report on the greenhouse gas inventories submitted in 2003. Geneva, Switzerland, United Nations Framework Convention on Climate Change FCCC/ WEB/SAI/2003. p. 150.
- Wrage N, Velthof GL, van Beusichem ML, Oenema O 2001. Role of nitrifier denitrification in the production of nitrous oxide. Soil Biology and Biochemistry 33: 1723–1732.doi:[10.1016/S0038-0717(01)00096-7]