
ABSTRACT
Intensive winter forage grazing systems have a high risk of environmental impact due to nitrate leaching from urine deposition on cool, wet, fallow soils. We investigated the effect of sowing two catch crops after simulated winter forage grazing on kale to potentially reduce N leaching losses from a winter application of labelled 15N-urine (350 and 700 kg N ha−1) using field lysimeters. The experiment measured the capture of N by the sowing at recommended dates of either oats (Avena sativa) or Italian (It.) ryegrass (Lolium multiflorum) and the resulting 15N balance. Results showed that the sowing of an oats catch crop reduced nitrate leaching by 25% over the critical winter–spring drainage period compared with It. ryegrass. Relatively small amounts of the labelled 1⁵N-urine (3–4%) were captured in the catch crops of urine treatments so the reduced nitrate leaching under the oats crop was attributed to lower drainage over the period.
Introduction
Forage grazing crops such as kale (Brassica oleracea L.) are commonly consumed over the winter in New Zealand. In the South Island, dairy farmers use winter forage crops to achieve body condition score targets for pregnant, non-lactating dairy cows prior to the start of calving in early spring (Judson et al. Citation2010). Kale crops are normally sown in the previous spring, reaching yields of 10–16 t DM ha−1 by winter (Brown et al. Citation2007) and are grazed for 8–10 weeks from early June. After grazing, the cropped area remains fallow until the next crop is sown in late spring (two to three months later). Although winter forage crops are effective, low-cost systems that provide large quantities of feed at a time of the year when the growth of pasture is limited by cold temperatures, grazing during winter can lead to large nitrate leaching losses (Shepherd et al. Citation2012). Mitigation options to reduce N loss from intensively grazed pastures in New Zealand have been reviewed by Cameron et al. (Citation2013), Monaghan et al. (Citation2007a), and Ledgard et al. (Citation1999) but winter forage grazing presents a new challenge. The high stocking rates during grazing mean large volumes of urine are deposited onto bare soil with no opportunity for plant uptake of N, at a time of year when drainage rates are typically high, creating a high potential for nitrate leaching. There is also the potential for multiple overlapping urine depositions because of the intensity of stocking.
A number of recent New Zealand winter forage grazing studies have reported nitrate leaching losses ranging from 52 to 173 kg N ha−1 (Shepherd et al. Citation2012; Smith et al. Citation2012; Monaghan et al. Citation2013; Malcolm et al. Citation2015) but currently there is little information on the effect of using a catch crop to reduce these. There is recognition that these losses need to be reduced if these open grazing systems are to continue (Monaghan et al. Citation2007b). However, there are several difficulties in the use of a catch crop to reduce nitrate leaching. Firstly, planting a catch crop in winter means germination and growth might be too slow to make any significant impact on N losses before the main part of the drainage season has passed. Secondly, the lag phase between the finish of winter grazing and soil conditions being suitable for sowing a particular crop may also limit the catch crop’s effectiveness. Selection of a suitable catch crop, therefore, relies on a plant species that is both winter-active and robust enough to establish in less than ideal soil physical conditions. The selection of potential catch crops is, therefore, limited to winter-active annual grass species like Italian (It.) ryegrass (Lolium multiflorum L.) or forage cereals like oats (Avena sativa L.). Recent research by Malcolm et al. (Citation2014) examining the ability of differing pasture species under simulated grazing to reduce nitrate leaching over late-autumn/winter found It. ryegrass particularly effective, reducing nitrate leaching losses from grazed pasture by 24–54% from an autumn (mid-May) urine application. Although there is little current research on the use of forage cereals post-winter forage grazing, oats has been used successfully in Canterbury as a catch crop in cropping sequences (although the oats is generally sown in autumn) (Francis et al. Citation1998). Oats also have other advantages due to their ability to tolerate low temperatures in seedling and tillering stages whilst resisting frost better than other forage cereals such as wheat and barley (Zwer Citation2004).
We report a field lysimeter study where a comparison was made between two potential catch crops, It. ryegrass and oats, sown after simulated winter forage grazing according to current recommended practice in New Zealand. Deposited urine was labelled with 15N in order to determine the fate of the N applied and achieve a mass balance over the course of the experiment. There were two main objectives for the experiment:
Compare the performance of two winter-active plant species to capture N from a simulated winter forage grazing including single and double urine applications and quantify any differences in nitrate leaching loss, and
Obtain a nitrogen balance of 15N-labelled urine to ascertain the pathways of urinary-N transfer and loss after sowing a catch crop post-winter forage grazing.
Materials and methods
Soil and lysimeter preparation
The study was conducted using a Balmoral stony silt loam soil (Typic Dystrudept, US Department of Agriculture) collected from Lincoln University’s Ashley Dene research farm situated near Springston (New Zealand Geodetic Datum 2000: 43 38 42S 172 20 33E) on the Canterbury Plains of New Zealand. Soil texture in the first 15 cm of each lysimeter profile was silt loam, but the soil profile became increasingly stony below this depth with c. 50% of the soil volume occupied by stones by 30 cm depth and the remaining volume interspersed with fine-to-coarse sands. The soil initially supported established pasture consisting of a mixture of perennial ryegrass (Lolium perenne L., cultivar Prospect) and white clover (Trifolium repens L., cultivar Kopu 11). Thirty-two monolith lysimeters, 500 mm in diameter and 700 mm deep, were collected from the site in early January 2013 (summer). Basic soil chemical and physical properties are presented in .
Table 1. Key soil fertility (0–7.5 cm) and physical properties for the Balmoral soil.
Lysimeter collection followed the procedure described by Cameron et al. (Citation1992) where each lysimeter casing was placed upon the soil surface, and by digging a small trench around the casing to expose a 100-mm depth of soil, the casing was progressively pushed down in a number of steps until the soil inside the lysimeter casing was 2 cm from the top. An internal cutting ring in the casing created a 5-mm gap between the side of the casing and the soil monolith that was sealed with liquefied (50°C) petroleum jelly. Readers are directed to the papers by Cameron et al. (Citation1992) and Di and Cameron (Citation2007) for further details. A gravel layer at the base of each lysimeter was installed to allow a free drainage system to be used as matric potential in this layer was assumed to be zero (Clothier et al. Citation1977). The lysimeters were moved to a purpose-built field trench at Lincoln University where a drainage tube was connected to the base of each lysimeter and placed into a sealed 10 L collection can.
After the lysimeters had been installed, the pasture vegetation was sprayed out with herbicide, and the soil surface was lightly hand-cultivated a fortnight later. Three three-month-old forage kale (cultivar Regal) plants were transplanted into each lysimeter in mid-December, giving a plant population of c. 16 plants m−2. Prior to lysimeter collection the site had received a basal fertiliser dressing of 15% potassic super at 200 kg ha−1 (15.4 kg P ha−1; 15 kg K ha−1 and 18.4 kg S ha−1) with nitrogen (2 × 25 kg N ha−1) applied as urea (non-labelled) in February and April 2013 to assist establishment of the kale plants. The kale was allowed to grow until winter when it was harvested to simulate grazing. Once the kale plants had been cut, the soil surface was ‘poached’ or trampled using a manually operated trampling device, designed to provide c. 200 kPa downward pressure, similar to that of the mechanical hoof described by Di et al. (Citation2001). This simulated the impact of animal grazing on the soil surface under typical winter forage grazing conditions.
Irrigation was used to supplement natural rainfall to the 75th percentile for the Lincoln area over the winter/early spring months on all lysimeters using a rain irrigation simulation system (RISS). This was done either as simulated rain or irrigation using an automated sprinkler system applied by Tee Jet FL-5VC spray nozzles mounted directly over the top of each of the lysimeters. During drier periods of the year (approx. October–March), the lysimeters were irrigated at regulated rates and time intervals to replace moisture lost through evapotranspiration and to prevent soil moisture deficiency. The system was primarily controlled by historical and daily climate data, driven by a CR 1000 Campbell Scientific data logger (UT, USA). This was used to simulate a realistic ‘wet’ year and overcome the risk of drought conditions affecting the results. From June to September (winter), simulated rainfall was applied when necessary to supplement rainfall through randomly generated rainfall events in order to meet daily target levels and to reach the 75th percentile of local rainfall records for the same period of the year (c. 670 mm vs. annual mean of c. 600 mm). Winter–spring drainage was considered to be from the start of the experiment until 30 November. From approximately mid-October, the RISS moved through to summer irrigation mode, once daily evapotranspiration loss persistently exceeded water inputs, with water applied in 15 mm increments approximately every three days, in line with the calculated (Penman) loss. Extra irrigation, however, was applied in the month of November to help complete the nitrate breakthrough curve.
Treatments
Treatments consisted of 2 catch crops (oats or It. ryegrass) × 3 rates of urine application (control, 350, and 700 kg N ha−1) × 4 replicates (24 lysimeters) in an orthogonal design (). Urine at the 700 kg N/ha rate was split over two applications, seven days apart. Urinary-N rates and concentrations were based on studies showing that the N content of urine from non-lactating cows fed kale is around half of those fed pasture (Miller et al. Citation2012; Selbie et al. Citation2015a).
Table 2. Lysimeter treatment ID (It. ryegrass – IR; oats – OT) and urine application rates.
An isotopic 15N label was added to the urine by addition of 98% 15N-urea and 15N-glycine in a 9:1 ratio, respectively, as used by Fraser (Citation1992). This ratio was used to approximate the 20–30% of the N fraction in urine that is present in organic but readily mineralisable N compounds (Bristow et al. Citation1992). The addition of the 98% 15N-urea/glycine solution to the collected urine raised its 15N enrichment to c. 9%. Control treatments also received the labelled urea/glycine (c. 32 kg N ha−1) but in water to the same volume.
Lysimeter management
The catch crops were sown according to current recommended practice and the ability to prepare a suitable seedbed. For the larger oats seeds, this meant they could be sown in mid-August but it was four weeks later in mid-September for the soil conditions to be suitable to sow the smaller It. ryegrass seed (). The oats (Milton cultivar) and It. ryegrass (Moata cultivar) were sown at 120 and 25 kg ha−1, respectively, after a light hand working of the soil surface to prepare a level seedbed. Problems were experienced in sowing and establishing the It. ryegrass control treatments and the seed needed to be sown again three weeks later after the initial September sowing date.
Table 3. Major tasks and dates for the field lysimeter experiment.
The It. ryegrass-sown lysimeters were harvested at regular intervals, from 1 December till 30 May whilst the oats were harvested once on 22 November. After harvest, the oats treatment lysimeters were sprayed with glyphosate to kill any remaining activity and then the surface of each was lightly reworked to prepare a seed bed for the sowing of the second kale crop (Regal cultivar; 4 kg ha−1) two weeks later. An application of diammonium phosphate at 200 kg ha−1 was applied (36 kg N ha−1) at sowing to help establish the plants (). Kale that was grown after the oats harvest was cut on 30 May. All harvest material was placed in a fan-forced oven and dried at 60°C and stored until ground for total-N and 15N analysis using a Retsch (Hann, Germany) cyclonic mill (<0.5 mm mesh).
On 31 May 2014 the lysimeters were uplifted and the soil monoliths were deconstructed to sample soil and plant roots and tops to complete the 15N balance study. Soil and root mass samples were extracted and stored at 4°C for up to two weeks prior to soil mineral-N extraction (Blakemore et al. Citation1987) and for further cleaning of the roots, drying and grinding (plant). A further soil sample was air-dried and pulverised for analysis of total-N and 15N content.
Ammonia volatilisation
Ammonia volatilisation losses following urine application were measured using soil blocks collected from the field site at Ashley Dene research station. The soil blocks (23 cm × 7 cm deep) were transferred intact to the field measurement site at Lincoln University. These soil blocks were inserted into bare soil and the same rates of urinary-N (350 and 700 kg N ha−1) applied as used in the lysimeter experiment, with the 700 kg N ha−1 rate again split over two equal applications, seven days apart. Each treatment was replicated three times and the gas enclosures were then sealed with clear Perspex covers. Three additional enclosures did not receive urine and were used as controls. Ambient air was continuously drawn through each enclosure at 0.41 L s−1 (approx. 17 air changes min−1) with 10% of the flow partitioned off to pass through an acid trap containing 50 mL of 0.05 M H2SO4 whilst the remaining flow was vented. Solution from each acid trap was changed daily with any evaporative loss replaced prior to collection (Black et al. Citation1985). The solutions were stored in 50 mL plastic bottles and frozen until the ammonium content was determined. Volatilisation rates were measured (c. one month) until rates approached background levels.
Nitrous oxide measurements
Collection and measurement of N2O emissions was carried out the day following urine application and thereafter, twice a week, for approximately six months (28 June 2013–24 January 2014) until N2O emissions were negligible. The hourly flux of N2O was measured using gas samples taken during a period of chamber enclosure over the soil surface (Hutchinson and Mosier Citation1981) following the procedure used by Rochette (Citation2011). On each sampling day, measurements were carried out between 11 am and 3 pm. Temperature was monitored and measured over the period using an extra enclosure with a thermometer probe fitted. Analysis was conducted by gas chromatograph (GC) (Model 8610C, SRI Instruments, CA, USA) with an automated Gilson GX-271 auto sampler (Gilson Inc., MI, USA) coupled to an electron capture detector (ECD). The 15N content of nitrous oxide (15N2O) and di-nitrogen was determined by taking an additional gas sample (12 mL exetainer vial), 2 h after placing the enclosure over the gas ring. The samples were analysed using a PDZ Europa 20–22 continuous flow isotope ratio mass spectrometer (Sercon Ltd., Cheshire, UK) enabling measurement of stable isotopes of gases at both enriched and natural abundance levels. Gas samples were prepared using cryo-trapping and focusing to isolate the N2O/N2 species.
Nitrogen leaching
Drainage water was collected from the lysimeters after every major rainfall event or when there was more than 0.5 L in the drainage collection vessels. Drainage and N leaching loss were considered over two periods; winter–spring (26 June–30 November 2013) and ‘annual’ (26 June 2013–31 May 2014). The first period included the main Canterbury winter drainage season and the second period, the full duration of the study up to lysimeter deconstruction. Drainage water samples were analysed by flow injection analysis (FIA) for and
content. The 15N proportion of the ammonium and nitrate present in the leachates was measured by taking a selection of samples covering the range of concentration for both ions over the breakthrough curve after FIA results had been obtained. The 15N present in the samples was concentrated on 7 mm glass fibre disks using the method described by Brooks et al. (Citation1989) before combustion at 1000°C using a PDZ Europa 20–20 stable isotope mass spectrometer (Sercon Ltd., Cheshire, UK). The 15N fraction of the other leachate samples were interpolated from these results.
15N balance measurements
The proportion of N from the 15N-labelled urine present in drainage water, gaseous-N emissions (N2O/N2), plant N uptake (tops and roots) and soil immobilised-N (organic and inorganic N) fractions was calculated using the ‘calculation-of-fertiliser-recovered’ formula by Cabrera and Kissel (Citation1989). Measurement of the 15N enrichment in di-nitrogen gas (N2) was only possible in the first 15 weeks of the study before it decreased to below detection levels.
Statistical analysis
Statistical analysis of the drainage data was considered over two periods; winter–spring, from urine application (26 June 2013) to 30 November 2013, and annually, from urine application to lysimeter deconstruction (31 May 2014). Crop-by-N-rate interactions between treatments were conducted using an orthogonal non-block ANOVA procedure in Genstat 9.0 (Lawes Agricultural Trust Citation2007). Residuals were tested for normalisation of data.
Results
Climate data
Average winter weekly soil and air temperatures were both about one degree warmer over 2013–2014 compared to the recent long-term (LT) means (2000–2016) whilst average spring, summer and autumn weekly soil and air temperatures were around the LT average (c. 0.3°C) (). Average weekly seasonal solar radiation and potential evapotranspiration (Penman) values for 2013–2014 were, overall, similar to the 2000–2016 means ().
Table 4. Mean daily winter (June–August), spring (September–November), summer (December–February), and autumn (March–May) soil, air, solar radiation, and evapotranspiration values for 2013–2014 compared with recent LT 2000–2016 averages.
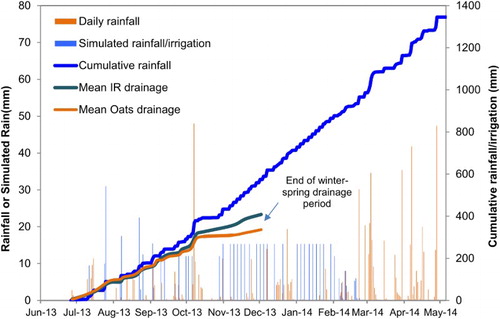
The main winter/early spring period from 25 June to 30 September 2013 was drier than usual with only 103 mm falling in natural rainfall (mean rainfall c. 210 mm) so a further 189 mm (65%) was applied randomly using the RISS protocol to bring the total to the 75th percentile (c. 290 mm). A further 100 mm fell as natural rainfall in October and November, which was augmented with an additional 180 mm, largely in November, to increase nitrate curve breakthrough, bringing total rainfall to c. 560 mm (), c. 140 mm more than the 75th percentile. Mean drainage over the first five months to the end of spring, was 408 and 336 mm for the It. ryegrass and oats treatments, respectively (P < .001; ). Although the remaining 500–600 mm is approximately the normal summer crop irrigation requirement for Canterbury (Foundation for Arable Research Citation2010) irrigation in the immediate post-spring period was largely to compete the nitrate breakthrough curves for each treatment. A further 350 mm was collected in drainage over this period.
Figure 1. Daily rainfall, simulated rainfall/irrigation and cumulative rainfall for 2013–2014 and mean cumulative drainage for It. ryegrass (IR) and oats to November from the commencement of treatment application.
Winter–spring nitrogen leaching losses
Nitrogen leaching losses were specifically considered over the winter–spring period (26 June–30 November) as this is the critical drainage interval for nitrate leaching. Cumulative drainage over this period was 22% less (P < .001) for oats U350 and U700 treatments compared to It. ryegrass treatments (313 vs. 401 mm, respectively) () but 40% (113 vs. 189 mm, respectively) in the October–November period. Nitrate leaching loss for both the It. ryegrass and the oats 350 (U350) and 700 (U700) kg urine-N ha−1 treatments peaked at approximately 100 and 150 mg N L−1, respectively, although the peak for the U350 treatments occurred earlier than those for the 700 treatments (140–160 vs. 170–190 mm; ). Nitrate peaks for the control treatments (0 kg urine-N ha−1) generally remained below 10 mg N L−1. The 15N-labelled proportion for both U350 and U700 treatments followed closely at about two-thirds of the peak nitrate concentration (not shown). Ammonium concentrations (not shown) in the leachate varied considerably between lysimeters but were significant, peaking on average at approximately c. 25 and c. 45 mg N L−1 for both crop U350 and U700 treatments, respectively, after c. 50 and c. 200 mm drainage, respectively. Ammonium in the drainage of the U700 treatments continued to persist to the end of the winter–spring period. Negligible amounts of ammonium were recovered in the drainage of the control treatments.
Figure 2. Nitrate concentration vs. cumulative drainage following the June/July urine applications (0, 350, and 700 kg N ha−1) for the It. ryegrass (A, top) and oats (B, bottom) lysimeter treatments. Time scale approximate only. Standard error bars (±1 SE) shown.
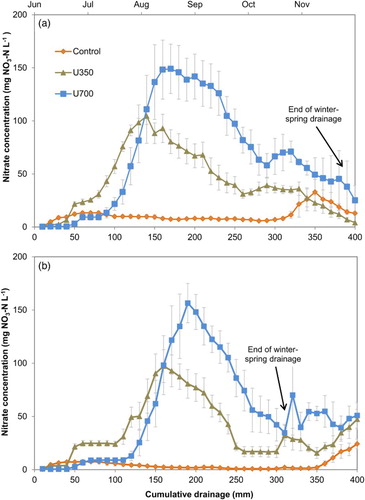
Table 5. Total inorganic-N leaching ( , , and total-N), drainage and inorganic-15N leaching losses for It. ryegrass and oats urine treatments (control, 350, and 700 kg N ha−1) to the end of the winter–spring drainage period.
Sowing oats in the urinary-N treatments (350 and 700 kg N ha−1) significantly reduced total nitrate loss (P < .01) and total-N leached (P < .05) overall by 25% and 21%, respectively, compared to the equivalent It. ryegrass treatments (). This effectively reduced nitrate loss from 167 and 264 kg N ha−1 to 131 and 193 kg N ha−1 for U350 and U700 treatments, respectively. Nitrogen drainage losses for control treatments were also lower for oats (11 vs. 46 kg N ha−1) but not significantly. Overall, however, sowing oats was more effective at reducing N leaching loss than sowing It. ryegrass.
Ammonium leaching loss in drainage was not different between catch crops but increased significantly with urinary-N rate (P < .001) at c. 30 and c. 80 kg N ha−1 for U350 and U700 treatments, respectively. This represented, on average, 10% to 12% (range 7–13%) of the total-N leaching loss for U350 and U700 treatments, respectively. Approximately 60% of the nitrate leaching loss (range 55–65%) to the end of the winter–spring period was directly attributable to the applied 15N-labelled urine but for ammonium it exceeded 75% (range 76–78%) (; ).
15N-nitrogen recovery
Nitrogen recovery from the 15N-labelled urine was calculated from the sum of the 15N found in drainage, gaseous-N emissions, plant N uptake, soil mineral-N, and N immobilised in the soil (15N only) over the one year of the study (26 June 2013–30 May 2014). Although there were significant differences between catch crops in the winter–spring 15N-nitrate leaching losses (P < .05), the annual 15N-nitrate leaching loss in drainage water was not significantly different, averaging c. 90 and c. 155 kg N ha−1 for the U350 and U700 treatments, respectively (). This represented 22–25% of the applied urinary-15N. Total inorganic-15N leaching loss in drainage water for both catch crops, including ammonium, was c. 200 and c. 350 kg N ha−1 for U350 and U700 treatments, respectively, representing c. 50% of the total-N applied. The fraction of 15N in nitrate and total-N drainage losses directly attributable to the labelled urine was 60% and 64%, respectively (range 56–69%; ).
Table 6. Annual total-N and 15N inorganic-N leaching loss (, , and total), gaseous-N loss (NH3-N and N2O-N), DM N content and soil-15N for It. ryegrass and oats urine treatments (control, 350, and 700 kg N ha−1).
Ammonia volatilisation (P < .01) and N2O (P < .001) loss both increased linearly with urinary-N rate with no difference in N2O loss between crops (ammonia measurements were on bare soil). Ammonia volatilisation losses were on average 1, 11, and 28 kg N ha−1 for control, U350, and U700 treatments, respectively, and essentially completed within the first 14 days of application (). Although the 15N proportion was not measured directly for volatilisation loss it was assumed to be almost totally derived from the applied urine (i.e. >90%) (Lee et al. Citation2011).
Nitrous oxide losses totalled 1.6, 7.6, and 11.7 kg N ha−1 for control, U350, and U700 treatments, respectively (), but emission factors (EF3 range: 1.3–2.1%) were not significantly different between treatments for either crop or urinary-N rate. Peak N2O emissions for U350 and U700 treatments were c. 230 and c. 280 g N2O-N ha−1, respectively with approximately 50% of the N2O loss directly attributable to the 15N-labelled urine ().
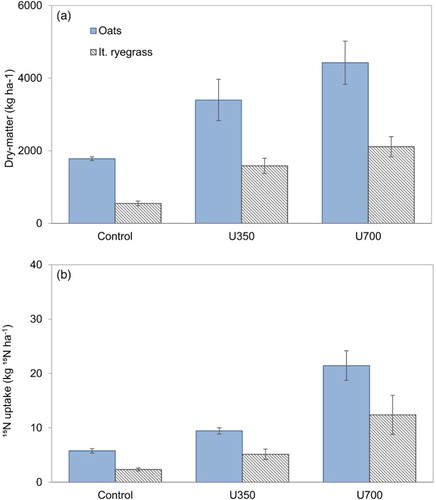
Dry-matter (DM) production and 15N uptake for the It. ryegrass and oats treatments to the end of the winter–spring period increased with urinary-N rate (P < .001) () but the It. ryegrass treatments grew only about half the DM and had half the 15N uptake of the oats U350 and U700 treatments, respectively. However, even for the oats the proportion of 15N captured from the applied urine overall was small, being only 2–3%, increasing to 3–4% with the harvest of the second kale crop at the end of the study (). The It. ryegrass captured a similar proportion after five harvests at the same point. Total annual N recovered for both catch crop treatments by the end of the study was similar at c. 40, c. 85, and c. 100 kg N ha−1 for control, U350, and U700 treatments, respectively, but the majority of the N captured was not derived from the labelled urine ().
Figure 3. Oats and It. ryegrass DM production (A) and 15N uptake (B) to the end of the winter–spring period (December 2013) after winter (June 2013) application of 15N-labelled urine. Standard error bars (±1 SE) shown.
15N balance
Total 15N recovery ranged from c. 67% to 91% of that applied with average recoveries for the oats treatments slightly higher overall than for the It. ryegrass treatments (79% vs. 73%; ). With the exception of the It. ryegrass control treatment, total 15N recoveries were higher for the lower urinary-N rates (). Approximately one-third of the labelled urinary-N in the U350 and U700 treatments was recovered in drainage losses with the next largest component, soil, accounting for a further 30% (range 23–37%). The soil-15N fraction decreased with increasing application rate (c. 35%, c. 33%, and c. 24%, on average, for control, U350, and U700 treatments, respectively). Half-to-two-thirds of the 15N recovered in the soil component was, on average, located in the top 10 cm with the remainder distributed to 60 cm down the profile. Soil mineral-N analysis for each depth increment revealed negligible quantities present (<1 kg N ha−1) as either or
at the time of deconstruction and thus most 15N was assumed associated with soil organic matter. Ammonium in drainage water was a significant proportion of the 15N recovered ranging from 6% to 10% of the total urinary-15N applied for both U350 and U700 treatments (negligible
recovered in controls) ().
Figure 4. Summed total (%) of 15N recovered in drainage, soil, plant, and gaseous-N fractions from applied 15N-labelled urine or water. Standard errors (±1 SE) for total 15N recovery shown.
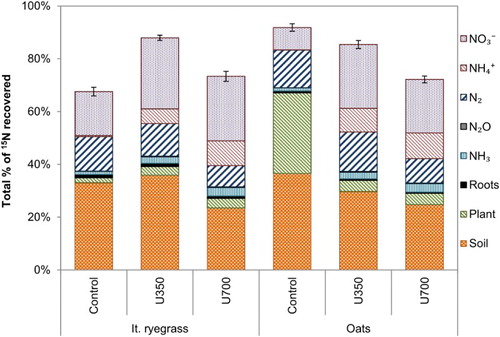
The fraction of 15N retained in harvested plant material for both catch crops in the U350 and U700 treatments was small and comprised only 3–4% of the N applied (). The 15N recovery in roots was small, making up only 1–3% of that applied and almost entirely from roots collected in the top 10 cm. Dinitrogen-15N loss comprised around 10–15% of the total-N applied but was only able to be measured in the first three months after urine application due to emissions falling below measurable levels. Nitrous oxide and volatilisation losses as a proportion of the applied urinary-15N were small overall at <1.0% and 1–3%, respectively.
Discussion
Drainage and nitrogen leaching
Sowing oats reduced nitrate leaching losses over the winter–spring drainage period by between 21% and 27% (av. 25%) for urine 350 (U350) and 700 (U700) kg N ha−1 rates compared with the It. ryegrass treatments. However, this was not due to differences in N uptake between the catch crops (<2% of urinary-N for both) but principally because of the smaller amount of drainage (c. 22% less) under the oats compared with the It. ryegrass, over the winter–spring period. Oats have an ability to grow under cool, moist soil conditions and have a high water use per unit DM than other cereals (Zwer Citation2004) meaning oats can establish in conditions where even winter-active ryegrass species might struggle. The early establishment of the oats meant their activity in the latter part of the winter–spring period reduced drainage by c. 40% compared with the It. ryegrass despite applying an extra 140 mm of irrigation over and above the 75th percentile through October and November. This demonstrates oats potential to lower leaching risk over a critical drainage period.
The small proportion of N captured by the catch crops, and few differences between, underlined that sowing both 7–11 weeks after urine application was too late to reduce the soil mineral-N pool sufficiently before drainage removed most of the nitrate from the reach of the plant roots. Although the soil was trampled and compacted prior to urine application, drainage rates were still relatively rapid as indicated by the amount of ammonium recovered in drainage. By the time the crops were sown, 100–200 mm of drainage had already been collected and the breakthrough curves for both crops show nitrate concentrations by this stage were at, or nearing, maximums (). Establishing the catch crop earlier appears to be crucial to increasing N uptake and recent lysimeter (Carey et al. Citation2016) and field (Malcolm et al. Citation2016) studies in Canterbury have shown this to be a successful and practical option.
Although It. ryegrass is known to be winter-active and able to take up and utilise N at a time when perennial ryegrass pasture would not (Malcolm et al. Citation2014), establishing a smaller seeded ryegrass species on a heavily compacted soil post-winter forage grazing is potentially problematic, as found in this study on some lysimeters. Cereals like oats, with their larger seed size and higher sowing rates, are able to establish quicker than the smaller seeded crucifers and grasses, especially in the early growth stages where they can develop roots to 40–50 cm depth after only 400 degree (C°) days (Thorup-Kristensen Citation2001). Although winter cereals are not necessarily better at taking up nitrate at low soil temperatures compared with, for example, winter brassicas (Laine et al. Citation1994), their ability to translocate N to shoots and to the root system whilst remaining active probably assists in retaining some N against leaching during this period. Indeed, dicot species like forage radish or winter rape, for example, are superior in terms of DM production and N uptake compared with winter cereals but on average they require 600 degree days before their root systems reach the same level of development (Thorup-Kristensen Citation2001). A key to catch crop success is the rate of root growth and therefore, deeper rooting species like winter cereals have an immediate advantage (Thorup-Kristensen et al. Citation2003). Although from 600 degree days onwards other catch crop species might have growth characteristics superior to cereals in terms of N uptake, the window to act as an effective catch crop post-winter forage grazing is small. Consequently, the range of suitable catch crops that might germinate and establish an effective deep root system at an initial soil temperature range of c. 5–6°C is small and favours winter-active cereals like oats.
Annual N losses
On an annual basis, the total-N leaching loss was similar between catch crops at c. 40, c. 200, and c. 350 kg N ha−1 for the control, U350, and U700 treatments, respectively, comprising around 50% of the urinary-N applied. Nitrate comprised c. 75–88% of the total-N leaching loss with ammonium leaching comprising the remainder (10–12%). Frequent irrigation events after the end of the winter–spring period (end of November) largely leached any remaining nitrate present within the lysimeters but it differed significantly between catch crops. Breakthrough curves for the oats saw larger and repeated spikes in nitrate concentration in drainage immediately following the post-oats harvest period but for the It. ryegrass there was only a single smaller peak in nitrate concentration before declining to baseline. This suggests that while the oats did not take up any more N than the ryegrass, it was able to reduce drainage sufficiently to retain the nitrate within the lysimeter, albeit to lose it in drainage in the post-harvest period. Consequently, nitrate losses for the It. ryegrass U350 and U700 treatments were largely completed by the end of the winter–spring period but for the oats a further 23–24% of the annual nitrate leached was captured in the following period. Under a winter forage/catch crop system, the normal management plan would be to harvest the oats by early-to-mid November and immediately prepare a seed bed for another winter forage crop or a return back into pasture. This suggests that with careful management, much of this N could be captured by a following crop or pasture if excess drainage can be avoided. Of course, if the catch crop could be established earlier this situation might be largely avoided altogether.
The relatively large proportion of ammonium recovered in drainage for both U350 and U700 treatments was surprising but half the 25% reported by Malcolm et al. (Citation2015) for a urine-N leaching study also on the Balmoral soil. Reports of ammonium leaching are normally rare but most N leaching studies are typically conducted on less-free draining and/or deeper soil profiles (e.g. Fraser Citation1992; Sprosen et al. Citation2009) and/or at more optimal times for nitrification and plant-N uptake (Di and Cameron Citation2002). The significant quantity of ammonium in drainage water can probably be attributed to a combination of preferential leaching and saturation of the soil’s cation exchange complex. Cichota et al. (Citation2016) has recently reported a study examining preferential leaching under a Canterbury stony Lismore soil under two levels of irrigation intensity and reported in both cases that the lower soil water fraction (ft) boundary involved in solute transport for a moist soil was c. 0.35. The instantaneous winter applications of urine (10 mm at a time) occurring on the U350 (one application) and U700 (two applications) lysimeters, a week apart, would not be dissimilar to an intense irrigation event and given the Balmoral soil’s relatively high stone content (around 50% at 20–30 cm), means a high potential for rapid solute transport. Although the soil surface on each lysimeter was pugged by the artificial hoof prior to urine application, some preferential channels likely remained open for rapid transfer of the urine to occur. It is also highly likely that with potassium concentrations in urine comparable with those for N (Williams et al. Citation1990), there was competition between K+ and ions for the soil’s cation exchange sites but these diminish rapidly with depth. Once below the A horizon (>15 cm) there is a reduced presence of nitrifying bacteria and with soil temperatures remaining cool, ammonium concentrations might decline relatively slowly. The breakthrough curves for the drainage of the U700 treatments showed that, once at depth, ammonium can apparently persist for some time.
The range of N2O emission factors (EF3 range 1.3–2.1%) for our treatments were relatively high compared to values of c. 1% given by de Klein et al. (Citation2003) but peak daily N2O emissions were similar to those reported by de Klein et al. (Citation2014) when the urinary-N rates were similar. The high EF3 values arise because of measurements directly from a urine patch involving a single or double urine application to an already compacted wet soil surface, with reduced aeration, minimal plant growth and a high water-filled pore space (WFPS) (Ball et al. Citation2008). Nitrate, under these soil conditions, is likely to undergo denitrification (Bolan et al. Citation2004) and since these conditions are often prevalent in winter forage grazing, N2O emission factors can be high (Ball et al. Citation2012).
The calculation of the proportion of denitrification contributed from di-nitrogen emissions was partly compromised by the difficulties in obtaining accurate values at low rates of emissions due to the relatively low 15N enrichment (c. 9%) of the labelled urine. It is likely that further loss continued after the first three months of measurement and the reported
loss of 8–12% is probably an underestimate. Other New Zealand studies quantitatively reporting N2 loss directly or indirectly from pasture-applied 15N-labelled urine have suggested values from 23% to 37% (Clough et al. Citation2001; Di et al. Citation2002; Buckthought et al. Citation2015).
Fate of urinary-15N and 15N balance
Total 15N recovery was as high as 90% (oats control) but generally, recoveries declined with increasing urinary-N rate to between 65% and 70% for the U700 treatments. The lower recoveries probably stem from undetectable N2 denitrification losses below the level of 15N detection. Given that soil and climatic conditions under winter forage grazing favour an accumulation of nitrate then prolonged low-level denitrification loss is probably not surprising. The lower N recovery in the It. ryegrass control probably stemmed from the poorer initial establishment producing a similar, albeit smaller, pool of nitrate subject to the same denitrification processes but at a greater enrichment level (98% 15N; 35 kg N ha−1). If it is assumed the unaccounted 15N proportion is due to dinitrogen loss then the total denitrification loss under winter forage grazing, and as proportion of urinary-N applied at 350–700 kg N ha−1, can probably be estimated at 30–35%. This is similar to that reported by Fraser et al. (Citation1994) (c. 28%) but high compared with the range of 15N recoveries published for other New Zealand studies where N2 loss was measured or implied by difference (Clough et al. Citation2001; Di et al. Citation2002; Buckthought et al. Citation2015). However, recently Selbie et al. (Citation2015b) found in an Irish grassland study N2 losses as high as 56% from urine application. Given that soil temperatures (>9°C), WFPS, labile-C, and nitrate supply conditions in this study were probably near optimal for denitrification by late August/early September probably enhanced gaseous-N losses (Haynes and Williams Citation1993; Di et al. Citation2014).
Nitrate-15N leaching losses for U350 and U700 treatments were about 25% of the urinary-N applied but this was only 52–60% of the total nitrate leaching loss. Di et al. (Citation2002) and Fraser et al. (Citation1994), who measured 15N-nitrate leaching losses under a urine patch in two pasture trials on a deep Templeton silt-on-sandy loam, found 83% and 69% of nitrate leaching losses occurred from autumn (May; 1000 kg N ha−1) and winter applied (July; 500 kg N ha−1) 15N-labelled urine applications, respectively.
Ammonium-15N leaching constituted between 6% and 10% of 15N loss for U350 and U700 treatments of both catch crops. These are high values from what has been reported previously but there are few comparable studies on similar soil types, apart from that reported by Malcolm et al. (Citation2015) from simulated winter forage grazing on kale.
The 15N proportion of ammonia loss from volatilisation was not measured directly but was assumed to be the majority (i.e. c. 90%) of the 3% and 4% recorded for U350 and U700 treatments, respectively (Lee et al. Citation2011). The proportion of the 15N-labelled urine retained in the soil fraction was reasonably high (approximately 33% and 24% on average for U350 and U700 treatments, respectively, of both catch crops) but similar to that reported by Di et al. (Citation2002) and Fraser et al. (Citation1994). However, those studies were on pastures whereas soils in this study were essentially fallow at the time of urine application (apart from the harvested kale plant roots) and thus, little of the urinary-N applied was able to be cycled in root or plant residues prior to the establishment of the crops. In addition, the urinary-N rates used in this study were considerably lower and thus, the absolute amount of N retained from the application ranged between c. 115 and c. 169 kg N ha−1 as opposed to the 200–250 kg N ha−1 cited in the other two studies. This 15N fraction has presumably been retained by a mix of immobilisation, root uptake and ammonium fixation but as there is little other 15N recovery data on winter urine applications, let alone under winter forage grazing conditions, to compare it with, it is difficult to say. Indeed, comparisons have to be made with cropping where the N is usually applied as inorganic fertilisers, but these applications are normally in spring or autumn, not mid-winter. Nevertheless, Gardner and Drinkwater (Citation2009) found in a meta-analysis of cropping 15N studies that soil accounted for c. 29% of the 15N applied.
By the end of the study there was relatively little 15N recovered in the roots of the remaining vegetation (c. 1%) and this is similar to Fraser (Citation1992) who also found that live roots only accounted for a small fraction (c. 1%) of the 15N recovered. Since the oats were harvested six months prior to lysimeter deconstruction, whatever 15N was retained in the roots would have been recycled back into the soil with only a small proportion recovered in the subsequent kale crop. The ryegrass treatments had five harvests over the growing season thus, little 15N remained in the root mass by the time of lysimeter deconstruction.
Conclusions
The earlier sowing and establishment of an oats catch crop significantly (P < .01) reduced nitrate leaching losses by 25% compared to the later sowing of It. ryegrass (both sown at recommended dates) over the winter–spring period. This was principally attributed to a smaller amount of drainage (22% less, P < .001) created by a higher evapotranspirative loss rather than differences in plant N uptake.
The annual N leaching loss was similar between catch crops, with only 3–4% of the urinary-N recovered (as 15N) in either catch crop, indicating that the lower initial nitrate loss for the oats’ treatments was due to a greater amount of nitrate being retained within the soil profile because of the smaller amount of drainage.
A significant amount of N recovered in drainage was as ammonium, representing between 13% and 26% of the total-N leached, indicating that rapid leaching is a major feature of the Balmoral soil.
The total amount of 15N recovered from the labelled urine ranged from 90% to 65% with values declining with increasing urinary-N rate. For the U350 and U700 treatments, approximately 23% of the 15N applied was recovered in drainage water from nitrate leaching whilst a further 6–10% was recovered from ammonium leaching.
A relatively high proportion (33%) of the 15N loss was attributed to denitrification. The proportion of 15N retained in the soil and roots was approximately 25% and 1%, respectively, whilst 3–4% was lost via volatilisation.
Acknowledgements
The authors wish to thank Mr Simon Kelly, Mr Trevor Hendry, Mr Roger Atkinson, Mr Chris Abraham, Ms Shelagh Bassett, Mrs Jenet Hendry, and Mr Barry Anderson for skilled technical assistance.
Disclosure statement
No potential conflict of interest was reported by the authors.
Additional information
Funding
References
- Ball BC, Cameron KC, Di HJ, Moore S. 2012. Effects of trampling of a wet dairy pasture soil on soil porosity and on mitigation of nitrous oxide emissions by a nitrification inhibitor, dicyandiamide. Soil Use and Management. 28:194–201. doi: 10.1111/j.1475-2743.2012.00389.x
- Ball BC, Crichton I, Horgan GW. 2008. Dynamics of upward and downward N2O and CO2 fluxes in ploughed or no-tilled soils in relation to water-filled pore space, compaction and crop presence. Soil and Tillage Research. 101:20–30. doi: 10.1016/j.still.2008.05.012
- Black AS, Sherlock RR, Cameron KC, Smith NP, Goh KM. 1985. Comparison of three field methods for measuring ammonia volatilization from urea granules broadcast on to pasture. Journal of Soil Science. 36:271–280. doi: 10.1111/j.1365-2389.1985.tb00331.x
- Blakemore LC, Searle PL, Daly BK. 1987. Methods for chemical analysis of soils. NZ Soil Bureau Report no. 80. 103 p. Lower Hutt.
- Bolan NS, Saggar S, Luo J, Bhandral R, Singh J. 2004. Gaseous emissions of nitrogen from grazed pastures: processes, measurements and modelling, environmental implications, and mitigation. Advances in Agronomy. 84:37–120. doi: 10.1016/S0065-2113(04)84002-1
- Bristow AW, Whitehead DC, Cockburn JE. 1992. Nitrogenous constituents in the urine of cattle, sheep and goats. Journal of the Science of Food and Agriculture. 59:387–394. doi: 10.1002/jsfa.2740590316
- Brooks PD, Stark JM, McInteer BB, Preston T. 1989. Diffusion method to prepare soil extracts for automated nitrogen-15 analysis. Soil Science Society of America Journal. 53:1707–1711. doi: 10.2136/sssaj1989.03615995005300060016x
- Brown HE, Maley S, Wilson DR. 2007. Investigations of alternative kale management: production, regrowth and quality from different sowing and defoliation dates. In: Popay AJ, editor. Proceedings of the New Zealand grassland association. Wairakei: NZGA; p. 29–34.
- Buckthought LE, Clough TJ, Cameron KC, Di HJ, Shepherd MA. 2015. Urine patch and fertiliser N interaction: effects of fertiliser rate and season of urine application on nitrate leaching and pasture N uptake. Agriculture, Ecosystems & Environment. 203:19–28. doi: 10.1016/j.agee.2015.01.019
- Cabrera ML, Kissel DE. 1989. Review and simplification of calculations in 15N tracer studies. Fertilizer Research. 20:11–15. doi: 10.1007/BF01055396
- Cameron KC, Di HJ, Moir JL. 2013. Nitrogen losses from the soil/plant system: a review. Annals of Applied Biology. 162:145–173. doi: 10.1111/aab.12014
- Cameron KC, Smith NP, McLay CDA, Fraser PM, McPherson RJ, Harrison DF, Harbottle P. 1992. Lysimeters without edge flow: an improved design and sampling procedure. Soil Science Society of America Journal. 56:1625–1628. doi: 10.2136/sssaj1992.03615995005600050048x
- Carey PL, Cameron KC, Di HJ, Edwards GR, Chapman DF, Aitkenhead M. 2016. Sowing a winter catch crop can reduce nitrate leaching losses from winter-applied urine under simulated forage grazing: a lysimeter study. Soil Use and Management. 32:329–337. doi: 10.1111/sum.12276
- Cichota R, Kelliher FM, Thomas SM, Clemens G, Fraser PM, Carrick S. 2016. Effects of irrigation intensity on preferential solute transport in a stony soil. New Zealand Journal of Agricultural Research. 59: 1–15.
- Clothier B, Scotter D, Kerr J. 1977. Water retention in soil underlain by a coarse-textured layer: theory and a field application. Soil Science. 123:392–399. doi: 10.1097/00010694-197706000-00008
- Clough TJ, Sherlock RR, Cameron KC, Stevens RJ, Laughlin RJ, Muller C. 2001. Resolution of the 15N balance enigma? Australian Journal of Soil Research. 39:1419–1431. doi: 10.1071/SR00092
- Di HJ, Cameron KC. 2002. The use of a nitrification inhibitor, dicyandiamide (DCD), to reduce nitrate leaching from cow urine patches in a grazed dairy pasture under irrigation. Soil Use and Management. 18:395–403. doi: 10.1111/j.1475-2743.2002.tb00258.x
- Di HJ, Cameron KC. 2007. Nitrate leaching losses and pasture yields as affected by different rates of animal urine nitrogen returns and application of a nitrification inhibitor—a lysimeter study. Nutrient Cycling in Agroecosystems. 79:281–290. doi: 10.1007/s10705-007-9115-5
- Di HJ, Cameron KC, Milne J, Drewry JJ, Smith NP, Hendry T, Moore S, Reijnen B. 2001. A mechanical hoof for simulating animal treading under controlled conditions. New Zealand Journal of Agricultural Research. 44:111–116. doi: 10.1080/00288233.2001.9513465
- Di HJ, Cameron KC, Podolyan A, Robinson A. 2014. Effect of soil moisture status and a nitrification inhibitor, dicyandiamide, on ammonia oxidizer and denitrifier growth and nitrous oxide emissions in a grassland soil. Soil Biology and Biochemistry. 73:59–68. doi: 10.1016/j.soilbio.2014.02.011
- Di HJ, Cameron KC, Silva RG, Russell JM, Barnett JW. 2002. A lysimeter study of the fate of 15N-labelled nitrogen in cow urine with or without farm dairy effluent in a grazed dairy pasture soil under flood irrigation. New Zealand Journal of Agricultural Research. 45:235–244. doi: 10.1080/00288233.2002.9513514
- Foundation for Arable Research. 2010. Irrigation management for cropping – a grower’s guide. FAR Focus. Canterbury, NZ, FAR. p. 28; [cited 2017 May 4]. Available from: https://www.far.org.nz/assets/files/uploads/Iss_04_Irrigation.pdf.
- Francis GS, Bartley KM, Tabley FJ. 1998. The effect of winter cover crop management on nitrate leaching losses and crop growth. The Journal of Agricultural Science. 131:299–308. doi: 10.1017/S0021859698005899
- Fraser PM. 1992. The fate of nitrogen under an animal urine patch [Unpublished PhD. thesis]. Canterbury (NZ): Lincoln University.
- Fraser PM, Cameron KC, Sherlock RR. 1994. Lysimeter study of the fate of nitrogen in animal urine returns to irrigated pasture. European Journal of Soil Science. 45:439–447. doi: 10.1111/j.1365-2389.1994.tb00529.x
- Gardner JB, Drinkwater LE. 2009. The fate of nitrogen in grain cropping systems: a meta-analysis of 15N field experiments. Ecological Applications. 19:2167–2184. doi: 10.1890/08-1122.1
- Haynes RJ, Williams PH. 1993. Nutrient cycling and soil fertility in the grazed pasture ecosystem. Advances in Agronomy. 49:119–199. doi: 10.1016/S0065-2113(08)60794-4
- Hutchinson GL, Mosier AR. 1981. Improved soil cover method for field measurement of nitrous oxide fluxes. Soil Science Society of America Journal. 45:311–316. doi: 10.2136/sssaj1981.03615995004500020017x
- Judson HG, Dalley DE, Edwards GR, Stevens DR, Gibbs SJ. 2010. Improving winter feeding outcomes in south island dairy herds. In: Edwards GR, Bryant RH, editors. Proceedings of the 4th Australasian dairy science symposium 2010. Lincoln (NZ): Lincoln University; p. 137–143.
- de Klein CAM, Barton L, Sherlock RR, Li Z, Littlejohn RP. 2003. Estimating a nitrous oxide emission factor for animal urine from some New Zealand pastoral soils. Australian Journal of Soil Research. 41:381–399. doi: 10.1071/SR02128
- de Klein CAM, Letica SA, Macfie PI. 2014. Evaluating the effects of dicyandiamide (DCD) on nitrogen cycling and dry matter production in a 3-year trial on a dairy pasture in South Otago, New Zealand. New Zealand Journal of Agricultural Research. 57:316–331. doi: 10.1080/00288233.2014.941508
- Laine P, Bigot J, Ourry A, Boucaud J. 1994. Effects of low temperature on nitrate uptake, and xylem and phloem flows of nitrogen, in Secale cereale L. and Brassica napus L. New Phytologist. 127:675–683. doi: 10.1111/j.1469-8137.1994.tb02970.x
- Lawes Agricultural Trust. 2007. Genstat release 9. Rothamsted Experimental Station, UK, Lawes Agricultural Trust.
- Ledgard SF, Penno JW, Sprosen MS. 1999. Nitrogen inputs and losses from clover/grass pastures grazed by dairy cows, as affected by nitrogen fertilizer application. The Journal of Agricultural Science. 132:215–225. doi: 10.1017/S002185969800625X
- Lee C, Hristov AN, Cassidy T, Heyler K. 2011. Nitrogen isotope fractionation and origin of ammonia nitrogen volatilized from cattle manure in simulated storage. Atmosphere. 2:256–270. doi: 10.3390/atmos2030256
- Malcolm B, Teixeira E, Johnstone P, Maley S, de Ruiter J, Chakwizira E. 2016. Catch crops after winter grazing for production and environmental benefits. Proceedings of the Agronomy Society of New Zealand. 46:1–2. doi: 10.1080/03036758.2015.1108346
- Malcolm BJ, Cameron KC, Di HJ, Edwards GR, Moir JL. 2014. The effect of four different pasture species compositions on nitrate leaching losses under high N loading. Soil Use and Management. 30:58–68. doi: 10.1111/sum.12101
- Malcolm BJ, Cameron KC, Edwards GR, Di HJ. 2015. Nitrogen leaching losses from lysimeters containing winter kale: the effects of urinary N rate and DCD application. New Zealand Journal of Agricultural Research. 58:13–25. doi: 10.1080/00288233.2014.961644
- Miller ME, Bryant RH, Edwards GR. 2012. Dry matter intake and nitrogen losses of pregnant, non-lactating dairy cows fed kale with a range of supplements in winter. Proceedings of the New Zealand Society of Animal Production. 72:8–13.
- Monaghan RM, Hedley M, Di HJ, McDowell RW, Cameron KC, Ledgard SF. 2007a. Nutrient management in New Zealand pastures – recent developments and future issues. New Zealand Journal of Agricultural Research. 50:181–201. doi: 10.1080/00288230709510290
- Monaghan RM, Smith LC, de Klein CAM. 2013. The effectiveness of the nitrification inhibitor dicyandiamide (DCD) in reducing nitrate leaching and nitrous oxide emissions from a grazed winter forage crop in southern New Zealand. Agriculture, Ecosystems & Environment. 175:29–38. doi: 10.1016/j.agee.2013.04.019
- Monaghan RM, Wilcock RJ, Smith LC, Tikkisetty B, Thorrold BS, Costall D. 2007b. Linkages between land management activities and water quality in an intensively farmed catchment in southern New Zealand. Agriculture, Ecosystems & Environment. 118:211–222. doi: 10.1016/j.agee.2006.05.016
- Rochette P. 2011. Towards a standard non-steady-state chamber methodology for measuring soil N2O emissions. Animal Feed Science and Technology. 166–167:141–146. doi: 10.1016/j.anifeedsci.2011.04.063
- Selbie DR, Buckthought LE, Shepherd MA. 2015a. The challenge of the urine patch for managing nitrogen in grazed pasture systems. Advances in Agronomy. 129:229–292.
- Selbie DR, Lanigan GJ, Laughlin RJ, Di HJ, Moir JL, Cameron KC, Clough TJ, Watson CJ, Grant J, Somers C, Richards KG. 2015b. Confirmation of co-denitrification in grazed grassland. Scientific Reports. 5:1–9. doi: 10.1038/srep17361
- Shepherd M, Stafford A, Smeaton D. 2012. The use of a nitrification inhibitor (DCn™) to reduce nitrate leaching under a winter-grazed forage crop in the central plateau. In: Swain D, editor. Opportunities of changing land use. Gore: New Zealand Grassland Association; p. 103–107.
- Smith LC, Orchiston T, Monaghan RM. 2012. The effectiveness of the nitrification inhibitor dicyandiamide (DCD) for mitigating nitrogen leaching losses from a winter grazed forage crop on a free draining soil in northern Southland. In: Swain D, editor. Opportunities of changing land use. Gore: New Zealand Grassland Association; p. 39–44.
- Sprosen MS, Ledgard SF, Lindsey SB. 2009. Effect of rate and form of dicyandiamide application on nitrate leaching and pasture production from a volcanic ash soil in the Waikato. New Zealand Journal of Agricultural Research. 52:47–55. doi: 10.1080/00288230909510488
- Thorup-Kristensen K. 2001. Are differences in root growth of nitrogen catch crops important for their ability to reduce soil nitrate-N content, and how can this be measured? Plant and Soil. 230:185–195. doi: 10.1023/A:1010306425468
- Thorup-Kristensen K, Magid J, Jensen LS. 2003. Catch crops and green manures as biological tools in nitrogen management in temperate zones. Advances in Agronomy. 79:227–302. doi: 10.1016/S0065-2113(02)79005-6
- Williams PH, Gregg PEH, Hedley MJ. 1990. Fate of potassium in dairy cow urine applied to intact soil cores. New Zealand Journal of Agricultural Science. 33:151–158. doi: 10.1080/00288233.1990.10430672
- Zwer PK. 2004. Oats. In: Wrigley C, editor. Encyclopedia of grain science. Oxford: Elsevier; p. 365–375.