
ABSTRACT
At Winchmore, single superphosphate fertiliser has been applied annually to grazed pasture plots since 1949. To determine whether or not cadmium (Cd) in the fertiliser had accumulated in the soil, samples were collected at intervals (0–0.075, 0.075–0.15, 0.15–0.25, 0.25–0.50, 0.50–0.75 and 0.75 –1.00 m) to a depth of 1 m, the Cd concentration and bulk density measured and Cd density calculated. The relationship between Cd density and depth was curvilinear and the slope or curvature increased with increasing fertiliser application rate. Nearly 100% of the Cd stock was located in a depth of 0–0.5 m and 36% in the uppermost 0.075 m depth. Leaching calculations using Burn’s equation accurately estimated the measured Cd stock’s vertical distribution. Estimating the inputs to soils from fertiliser and atmospheric deposition and the loss by leaching and outwash accounted for the measured Cd stock. We concluded Cd accumulated in these soils at a rate determined by the fertiliser’s Cd concentration and application rate.
KEYWORDS:
Introduction
In New Zealand (NZ), farmers have applied phosphorus (P) fertiliser to soils since the 1940s to increase pasture production (Smith et al. Citation2012). This fertiliser can include impurities, such as cadmium (Cd), a potentially bio-toxic heavy metal (Walkley Citation1940; Schroeder and Balassa Citation1963, Williams and David Citation1973; Abraham et al. Citation2016). An additional source of Cd input to soils will be atmospheric deposition (Gray et al. Citation2003a). As well as Cd input to soils, Cd can be lost from soils by leaching (Gray et al. Citation2003b) and outwash (McDowell Citation2010). For pasture grazed by sheep, 99% of the Cd intake was found to be returned to soils in the excreta (Lee et al. Citation1994). For Cd to accumulate in soils, the inputs must exceed the losses in accordance with mass conservation. The retention of Cd in soils has been attributed to sorption on colloids (Loganathan & Hedley Citation1997; Gray et al. Citation1999a).
At the Winchmore Research Station located near Ashburton (43.8° S, 171.8° E), four levels of single superphosphate (SSP) fertiliser have been applied annually to grazed pasture plots since 1949 in the long-term irrigation trial and 1952 in the long-term P fertiliser trial (Rickard and Moss Citation2012). To determine whether or not Cd had accumulated in the soil at this site, there have been two studies based on repeatedly sampling soils to a depth of 0.075 m. While the evidence from one study suggested Cd was accumulating in the soil during 1952–1996 at rates proportional to the fertiliser application rate (Gray et al. Citation1999b), the other study’s evidence for 1952–2009 suggested Cd may not have accumulated in the soil after ‘a peak in the mid-1990s’ (McDowell Citation2012). There are two possible explanations for the observed plateauing of topsoil Cd concentrations found by McDowell (Citation2012). The first may be attributed to the reduction in Cd concentrations in P fertiliser from 1996 onwards as result of the fertiliser industries Cd management strategy which introduced a voluntary target of 26 mg Cd kg−1 SSP (Fertiliser Matters Citation2005). The second is a result of increased losses of Cd from the topsoil, presumably either by plant uptake or movement down the soil profile. If indeed the rate of Cd accumulation in topsoil is beginning to decrease over time, this is important information. It may mean that some soils will be less likely to exceed soil Cd thresholds levels that are a central component of the risk-based framework for managing Cd in agricultural (MAF Citation2011).
Repeated sampling can be a straightforward method to estimate the Cd accumulation rate in soils, provided the samples have been representative. Representativeness implies an assumption of completeness, but by sampling soils, it can be uncertain whether or not all of the input Cd has been recovered. However, the deeper soils are sampled the more likely the input Cd should be recovered. This leads to the aims of our study which were to sample the soils at Winchmore in 2009 at intervals to a maximum depth of 1 m and estimate the mean Cd accumulation rate for each level of P fertiliser application. With this data we wanted to test the hypothesis that Cd accumulation is determined by the fertiliser’s Cd concentration and application rate, as well as atmospheric deposition, drainage and outwash rates.
There were five stages in this study. First, for each level of P fertiliser application from 0 to 34 kg P ha−1 y−1, we determined the relationship between Cd concentration and depth. Second, we vertically integrated these data to determine the corresponding Cd stocks. Third, for comparison with the measured Cd stocks, we estimated the Cd inputs to soils and the losses for the period 1952–2009. Fourth, the fraction of the Cd input which was lost by leaching beyond each sampled layer of soil was estimated using Burn’s equation (Magesan et al. Citation1999). By these calculations, the fraction of Cd input retained in each layer of soil was also being estimated, providing another opportunity for comparisons with the measured Cd stocks. Finally, combining measured Cd concentrations to a depth of 0.075 m from this study and the earlier measurements, the time series was statistically analysed.
Methods
Trials
There were two trials at Winchmore called the fertiliser and irrigation trials. As stated, the purpose of these trials was to determine the effects of different levels of SSP fertiliser application and irrigation on the production of pasture grazed by sheep. For both trials, the soil was a Lismore stony silt loam, an Orthic Brown order according to the New Zealand soil classification system (Hewitt Citation2010).
The fertiliser trial had three P application rate treatments, including 0, 17 and 34 kg P ha−1 y−1. For each treatment, there were four plots arranged in a randomised design. All plots had the same irrigation frequency, irrigated when the soil’s water content reached 15% over a depth of 0–0.10 m. For this depth interval, the soil’s maximum and minimum water contents were 32% (field capacity) and 9%, respectively (Kelliher et al. Citation2012). The plots were irrigated one to six times per year or about four times per year on average between approximately mid-September and mid-March (Srinivasan and McDowell Citation2009). Irrigation frequency depended on rainfall which averaged 60 mm month−1 during September–March, while the potential evaporation from well-watered pasture averaged 92 mm month−1 (Kelliher et al. Citation2012). Each plot was grazed during September–March by a separate flock of sheep to avoid nutrient transfer between treatments. The sheep stocking rate was adjusted to optimise pasture utilisation.
The irrigation trial had a P fertiliser application rate of 22 kg P ha−1 y−1. There were three irrigation treatments, including no irrigation and irrigation applied when the soil water content over a depth of 0–0.10 m reached levels of 10 and 20%. For each treatment, there were four plots. For the 10% treatment, the plots were irrigated two to three times per year. For the 20% treatment, the plots were irrigated 2–12 times per year or about seven times per year on average. Each plot was grazed by sheep during September–March and the stocking rate was adjusted to optimise pasture utilisation. For example, the 20% treatment had approximately 40 sheep ha−1, leaving the plots for mating in March as one-year-old females weighing about 40–50 kg (Kelliher et al. Citation2012).
Soil sampling
This study was mostly based on soil samples collected from the fertiliser and irrigation trials during April 2009 in 24 plots. Midway between the borders in each plot, a mechanical digger was used to excavate a pit, approximately 1 m wide, 2 m long and 1.5 m deep. Along the pit face, using a steel frame (0.4 m by 0.4 m by 0.25 m) to delineate the extracted volume, soil and stone samples were collected from six depth intervals (0–0.075, 0.075–0.15, 0.15–0.25, 0.25–0.50, 0.50–0.75 and 0.75–1.00 m). Each sample was transported to a laboratory, weighed and separated into soil and stones (the roots having been removed) using sieves and weighed again. From each sample, approximately 3 kg of (fresh) subsample was set aside for analysis. From each subsample, a portion was weighed, dried at 105°C for 24 h and weighed again. By applying the subsample’s water content to the sample’s fresh soil and stone weights and accounting for the sample’s volume, the sample’s stone content and bulk density were determined.
Soil samples were also collected in the fertiliser trial plots from a depth of 0–0.075 m on 10 occasions in addition to those collected in 2009. The additional samples were collected in the years 1952, 1958, 1964, 1971, 1974, 1979, 1985, 1989, 1996 and 2016. After the roots and stones were removed, the samples were dried at 105°C for 24 h and placed in labelled containers in an archive.
Measurements
Total recoverable Cd concentration in the soil samples was determined by nitric acid/hydrochloric digestion (US EPA Citation2002) followed by analysis using inductively coupled plasma-mass spectrometry. Quality control measures included the use of blanks, duplicate samples and a certified reference material AGAL-10 (Australian Government Analytical Laboratories, Sydney, Australia). In the blanks, Cd concentration was less than the detection limit of 0.010 mg Cd kg−1. The duplicate results were within 10%. Recovery of Cd from the certified reference material was within the limits of the certified value.
Soil pH was measured in a deionised water suspension with a soil: solution ratio 1:25 (Blakemore et al. Citation1987). Amorphous iron (Fe) and aluminium (Al) oxide concentrations in the soil samples were determined by oxalate-extraction (McKeague and Day Citation1966). Total organic carbon (C) concentration in the soils samples was measured by a combustion method (Kelliher et al. Citation2012).
Estimating cadmium inputs to soils, losses and resident stock
As stated, for each layer of soil sampled in 2009, the Cd concentration and bulk density were measured and the Cd stock calculated. To better understand these results, we also estimated the inputs and losses which would have determined the Cd stock. Thus, for 1952–2009, we estimated the Cd inputs by atmospheric deposition and P fertiliser application. The assumed Cd input rate to soils by atmospheric deposition was 0.2 g Cd ha−1 y−1 as previously measured at the site (Gray et al. Citation2003a). We assumed that 10% of the input Cd was lost by leaching beyond the sampled depth. This is within the range of values that have been reported in the small number of studies that have measured Cd leaching losses from pasture soil amended with P fertiliser and is the value that has been previously reported for a Brown soil (Gray et al. Citation2003b) which is the soil order at the trial site. Losses of Cd in outwash were assumed to be 5% of inputs for the 17 and 34 kg P ha−1 y−1 fertiliser treatments, and 10% for the 22 kg P ha−1 y−1 treatment, based on the values in outwash previously reported for the site (McDowell Citation2010).
The estimated Cd input rate by P fertiliser application was determined by the Cd concentration and the application rate. As stated, P fertiliser was applied annually to soils at 17, 22 and 34 kg P ha−1 y−1. These rates were constant from the start of the trials until sampling in 2009. However, it has been observed that from 2003 onwards on the irrigation trial, the scheduled P fertiliser inputs ceased (Ray Moss, personal communication), although the irrigation treatments continued (Rickard and Moss Citation2012). Instead, while P fertiliser has continued to be applied, the rate and timing have no longer been recorded. While it cannot be known for certain, we think the same fertiliser rates and timing were probably continued from 2003 through 2009. Phosphatic rocks from different locations were blended to manufacture the P fertiliser. The blends and periods of manufacture have been described by the NZ fertiliser industry (Anonymous Citation2008). For 1952–1996, the phosphatic rocks came from three locations, including Nauru, Christmas Island and North Carolina, USA. Using the published data, we estimated a mean Cd concentration for the phosphatic rocks from each location (). From the P fertiliser blend descriptions, we estimated the percentages of the rocks from each location. Thus, for 1952–1996, the estimated Cd input rate by P fertiliser application was determined by multiplying the mean Cd concentration for each rock’s location by the percentage of the rocks from each location and the application rate ().
Table 1. Measured cadmium (Cd) concentration in SSP (phosphorus, P) fertiliser made of phosphatic rock samples from Nauru, Christmas Island and North Carolina.
Table 2. Estimated mean cadmium (Cd) input rates for periods determined by the SSP (phosphorus, P) fertiliser blends (see for nomenclature and Cd concentration data) based on interpretations of blend descriptions provided by the Fertiliser Association of New Zealand (Anonymous Citation2008).
To assess the uncertainty of the Cd input rate by P fertiliser application, we calculated a standard error (SE) for the Cd concentration data from each of the three phosphatic rock’s locations. Each SE was divided by the corresponding mean to calculate a fractional SE (FSE). For each fertiliser blend, the FSE for each phosphatic rock’s location was weighted by its percentage contribution, the three weighted FSEs were summed and the total quantity was squared. Next, the squared quantity was multiplied by a weighting factor for the fraction of the years for which the fertiliser blend had been applied to the plots. For example, this weighting factor for the fertiliser blend applied during 1952–1975 was 0.40 (=23/57). A root-mean-square sum of these weighted squared quantities was taken to estimate an overall FSE for the fertiliser blends. Finally, a fractional 95% confidence interval (95% CI) was estimated as twice the overall FSE on each side of the mean.
For 1996–2009, the Cd concentration of P fertiliser was estimated differently. For 1996–2003, the estimate was 344 mg Cd kg−1 P, determined by measurement of a sample of P fertiliser which had been manufactured in NZ in the year 2000 (Salmanzadeh et al. Citation2016b). Since January 2003, the Cd concentration of P fertiliser manufactured in NZ has been measured weekly. Consequently, for 2003–2009, the estimate was 191 mg Cd kg−1 P, a mean estimated from the data reported by Abraham et al. (Citation2016).
In the year 2009, as indicated, the measurements yielded a Cd stock for each layer of soil which was sampled. To better understand these results, we developed a calculation method using Burn’s equation to estimate the fraction of the Cd input which was retained in each sampled layer of soil. Using Burn’s equation, the estimated fraction of the solute input which was leached () has been found to agree with measurements in a number of lysimeter studies (Magesan et al. Citation1999; Shepherd et al. Citation2012; Cichota et al. Citation2016). On this basis, we estimated the fraction of Cd input which was leached as a function of the cumulative drainage (D) according to the following equation:
(1) where z was the depth of soil and fc the volumetric water content at the field capacity. By estimating
using Burn’s equation and assuming there had been no other Cd losses, we also estimated the fraction of the Cd input which was retained in each layer of soil sampled in 2009 as (1 –
).
Anticipating the results, the Burn’s equation calculations were done for the four sampled layers of soil from 0 to 0.5 m. The estimated fc was 0.29 ± 0.07 m3 m−3, a mean for this depth interval (Kelliher et al. Citation2012). To estimate D, we began by recognising that P fertiliser had been applied to the plots each year between mid-July and mid-August (Ray Moss, personal communication). Next, we postulated Cd leaching would begin on 1 August and end on 31 August. This recognises that the Cd in SSP fertiliser is soluble in water (Williams and David Citation1973; Hamon et al. Citation1998; Prochnow et al. Citation2001), so the Cd contained in SSP should have been prone to loss by leaching provided there was sufficient rainfall. On this basis, for August 1952–2009, we needed to estimate the balance of rainfall and evaporation which would have determined D. For this purpose, monthly rainfall and potential evaporation measurements made at Winchmore in August 1952–2009 were extracted from a national climate database (https://cliflo.niwa.co.nz/) maintained by NZ’s National Institute of Water and Atmosphere.
Statistical analysis
The computing package ‘R’ was used for statistical analysis of the data (R Core Team Citation2016). Linear regression models were fitted to the data. Beforehand, if appropriate, the data had been transformed by taking the (base e) logarithm.
Results
The vertical distribution of Cd in the sampled soils
For a depth of 0–0.5 m, the sampled soil was characterised by relatively constant mass proportions of about 45% as silt, 30% as clay and 25% as sand. Stone density in the sampled intervals increased with increasing depth from 22 ± 34 to 869 ± 320 kg m−3 (). Below a depth of 0.5 m, there was much more sand and stones and less silt and clay.
Table 3. Measured physical characteristics of soil samples collected in the irrigation trial plots (mean ± 95% CI).
In the fertiliser trial plots, for the samples from a depth of 0–0.075 m, the soil’s Cd density (=Cd concentration x bulk density) was significantly affected by the P application rate (P < .05, (A)). For these samples, the soil’s Cd density averaged 55 ± 9 mg Cd m−3 for 0 kg P ha−1 y−1, 235 ± 35 mg Cd m−3 for 17 kg P ha−1 y−1 and 395 ± 50 mg Cd m−3 for 34 kg P ha−1 y−1. In contrast, for the samples from a depth of 0.75–1.00 m, the soil’s Cd density averaged only 14 ± 2 for 0 kg P ha−1 y−1, 10 ± 6 for 17 kg P ha−1 y−1 and 15 ± 10 mg Cd m−3 for 34 kg P ha−1 y−1 and there were no statistically significant differences.
Figure 1. Relationships between soil cadmium (Cd) density (product of Cd concentration and the bulk density) and depth, represented by a midpoint of the sampling interval, in the plots which received one level of irrigation and three levels of phosphorus (P) fertiliser, including 0 (◊), 17 (○) and 34 (Δ) kg P ha−1 y−1. Also shown in panel B are the regression lines. The regression slope and intercept were: 2.52 and 4.12 for 0 kg P ha−1 y−1, −5.84 and 5.67 for 17 kg P ha−1 y−1 and −5.35 and 6.22 for 34 kg P ha−1 y−1.
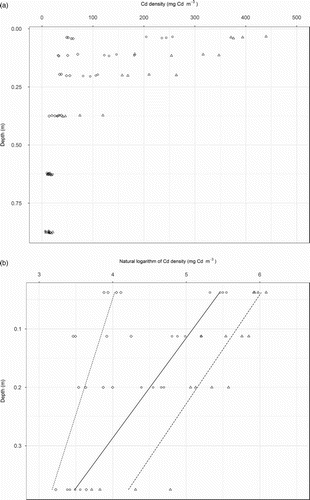
Linear regression analyses yielded statistically significant relationships between soil Cd density (log base e transformed) and sampling depth which accounted for 88% of the variability ((B)). The regression slope and intercept were significantly affected by the P application rate. The regression slope and intercept were −2.52 and 4.12 for 0 kg P ha−1 y−1, −5.84 and 5.67 for 17 kg P ha−1 y−1 and −5.35 and 6.22 for 34 kg P ha−1 y−1.
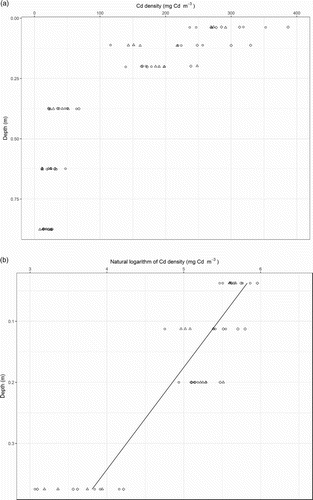
In the irrigation trial plots, neither irrigation nor irrigation frequency significantly affected the soil’s Cd density ((A)). These results were interpreted to indicate there had not been any excess drainage following irrigation due to ‘over watering’ the soils. In these plots, the soil’s mean Cd density ranged from 323 ± 24 mg Cd m−3 at a depth of 0–0.075 m to 37 ± 4 mg Cd m−3 at a depth of 0.75–1.00 m. For all of the data from the irrigation plots, linear regression analysis yielded a statistically significant relationship between soil Cd density (log base e transformed) and sampling depth which accounted for 82% of the variability ((B)). The regression slope and intercept were −6.05 and 6.08, respectively.
Figure 2. Relationships between cadmium (Cd) density in the soil and depth, represented by a midpoint of the sampling interval, measured in plots which received one level of phosphorus (P) fertiliser (22 kg P ha−1 y−1) and no irrigation (◊) or irrigation when soil water content reached 10% (○) and 20% (Δ). Also shown in panel B are the regression lines. The regression slope and intercept were −6.05 and 6.08, respectively.
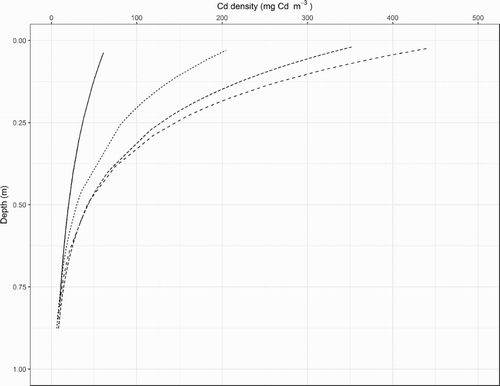
As indicated, the soil’s texture and stone content changed at a depth of 0.5 m. For a depth of 0–0.5 m, on average, sand comprised 25% of the soil and there was a total of 261 kg m−2 of stones. In contrast, for a depth of 0.5–1.0 m, the sand content averaged 85% and there were 583 kg m−2 of stones. For each of the four P application rates, the curvilinear relationship between the back-transformed regression estimates of the soil’s Cd density and depth were interpreted to estimate the percentage of the total Cd stock sampled to a depth of 1 m which was located in the uppermost 0.5 m depth of soil (). In the plots which received 0 kg P ha−1 y−1, an estimated 78% of the total Cd stock sampled to a depth of 1 m was located in the uppermost 0.5 m depth of soil. In the plots which received 17, 22 and 34 kg P ha−1 y−1, an estimated 95% of the total Cd stock was located in the uppermost 0.5 m depth of soil.
Figure 3. Relationships between the back-transformed regression estimates of cadmium (Cd) density in the soil and depth, represented by a midpoint of the sampling interval, in plots which received one level of irrigation and no fertiliser (solid curve) or phosphorus (P) fertiliser applications at 17 kg P ha−1 y−1 (curve with the shortest dashes), 22 kg P ha−1 y−1 (curve with intermediate-length dashes) and 34 kg P ha−1 y−1 (curve with the longest dashes).
Like the vertical distribution of Cd density, from a depth of 0–0.075 m to 0.75–1.00 m, the soil’s mean C and Fe concentrations also decreased from 35.9 ± 4.1 to 6.1 ± 0.7 kg kg−1 and 2129 ± 428 to 1240 ± 329 mg kg−1, respectively (). In contrast, the corresponding mean pH and Al concentrations increased from 5.4 ± 0.1 to 5.9 ± 0.1 and 2017 ± 384 to 4583 ± 766 mg kg−1. By plotting the plot-level concentrations of C (X axis) and Cd, the relationship resembled an ice hockey stick with the stick as a positive linear trend when C concentration was greater than 0.01 kg kg−1 and the horizontal blade when C concentration was less than 0.01 kg kg−1 (data not shown). By excluding the samples with a C concentration less than 0.01 kg kg−1, linear regressions between the C and Cd concentrations accounted for 76% of the variability in the plots which received 0 kg P ha−1 y−1, and 93–97% of the variability in the plots which received 17, 22 and 34 kg P ha−1 y−1 (data not shown). These percentages were substantially greater than the corresponding values of 71% and 30–64% for the pH and Cd concentration, 58% and 1–35% for the Al and Cd concentrations and 42% and 12–57% for the Fe and Cd concentrations. These results were interpreted to indicate that Cd accumulation in the soil was mostly closely correlated with the C concentration, so mostly attributed to sorption on the organic matter in agreement with the interpretations of Kim and Fergusson (Citation1992) and Gray et al. (Citation1999b).
Table 4. Measured chemical characteristics of the soil samples including soil pH and the concentrations of oxalate extractable iron (Fe), aluminium (Al) and total carbon (C) (mean ± 95% CI).
P fertiliser application and cd accumulation rates in the sampled soils
For plots which received 0, 17, and 34 kg P ha−1 y−1 and 22 kg P ha−1 y−1 from the 20% irrigation treatment, accounting for atmospheric and fertiliser inputs less leaching and outwash losses, the estimated cumulative Cd input for 1952–2009 was 1, 346 ± 22, 444 ± 28 and 682 ± 44 g Cd ha−1, respectively (). There was a statistically significant (P < .05) linear relationship between the estimated cumulative Cd input (X axis) and the soil’s Cd stock (0–0.5 m samples collected in 2009) which accounted for 92% of the variability (). The slope of the relationship, 1.03 ± 0.08, was not significantly different to one. These results were interpreted to indicate that the Cd accumulated in the soil was located throughout a depth of 0–0.5 m, determined by the Cd input according to mass conservation.
Figure 4. Relationship between the estimated cumulative cadmium (Cd) input to plots and the mean cumulative Cd stock (0–0.5 m samples collected in 2009). For the data from left to right, the plots received annual phosphorus (P) applications (inputs) of 0, 17, 22 and 34 kg P ha−1 y−1. In addition, the estimated atmospheric deposition (input) rate was 0.2 g Cd ha−1 y−1 (Gray et al. Citation2003a). An estimated 10% of the total Cd input was lost by leaching (Gray et al. Citation2003b), and loss in outwash of 5% of inputs for the 17 and 34 kg P ha−1 y−1 fertiliser treatments and 10% for the 22 kg P ha−1 y−1 treatment (McDowell Citation2010). Also shown is the regression line.
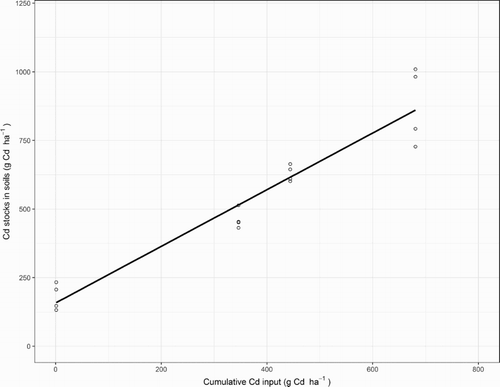
Table 5. The difference between soil cadmium (Cd) stock to a depth of 0.5 m in plots which received annual phosphorus (P) fertiliser applications from 1952 to 2009 and the mean soil Cd stock in four control plots which were not fertilised (180 ± 77 g Cd ha−1, mean ± 95% CI, n = 4 plots; for 17, 22 and 34 kg P ha−1 y−1, n = 4 plots each).
For soil samples collected in the year 2009 from a depth of 0–0.5 m in the fertiliser trial’s four control plots which received no P fertiliser, the mean measured stock was 180 ± 77 g Cd ha−1. As stated, accounting for atmospheric deposition less leaching and outwash losses, the estimated cumulative Cd input for 1952–2009 to these plots had been 1 g Cd ha−1. For the plots which received 17, 22 and 34 kg P ha−1 y−1, a P fertiliser effect on the soil’s Cd stock was calculated by subtracting 180 g Cd ha−1 from each plot’s measured Cd stock. Thus, for 17 kg P ha−1 y−1, the mean calculated P fertiliser effect on the Cd stock was 283 ± 56 g ha−1 (). Alternatively, as stated, the estimated (net) Cd input from this rate of annual P fertiliser application was 346 ± 22 g Cd ha−1 and the estimated atmospheric deposition was 1 g Cd ha−1, so an estimated P fertiliser effect on the soil’s Cd stock was 345 ± 22 g Cd ha−1 or 22% greater. For the plots which received 22 and 34 kg P ha−1 y−1, the estimated P fertiliser effect on the soil’s Cd stock was slightly less than the effect calculated from the measurements, but only by 7 g ha−1 or 2% and 17 g ha−1 or 2%, respectively. These results were also interpreted to indicate that Cd had accumulated in the soil in accordance with the Cd inputs, loss and mass conservation.
To better understand Cd accumulation in the soils sampled in 2009, calculations were done to estimate the Cd stock’s vertical distribution from a depth of 0–0.5 m in the fertilised plots. For this purpose, was estimated using Burn’s equation. As indicated, the calculations required a mean (1952–2009) estimate of drainage in August which would be calculated from the amount of rainfall in excess of the evaporation (term D in equation (1)). The mean potential evaporation in August was 32 ± 3 mm. While the corresponding mean rainfall was 66 ± 13 mm, the median was 48 mm which showed the frequency distribution of rainfall in August was skewed ().
Figure 5. The frequency distribution of rainfall in August (mm) for the years 1952–2009 with the area under the curve equal to unity. The left-hand vertical line was plotted at 32 mm, the mean potential evaporation for August. The right-hand vertical line was plotted at 79 mm, the rainfall used to estimate drainage from the soil in August (47 mm = 79 mm–32 mm) for Burn’s equation.
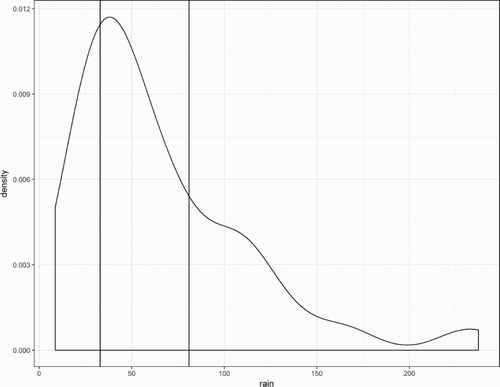
Consequently, to estimate the drainage for Burn’s equation, calculations were not done using the mean rainfall. Instead, we used the rainfall which minimised the root-mean-squared difference between the measured and estimated Cd stocks in 2009 expressed as percentages accumulated across the four sampled layers of soil. Thus, the measured value was 100% accumulated to a depth of 0.50 m. The rainfall used for the drainage calculations was 79 mm (). For this rainfall, the estimated mean D was 47 mm (=79–32 mm). On this basis, 37% of the Cd stock was estimated to have been retained in the uppermost 0.075 m depth of soil, the rest estimated to have leached beyond this sampled layer (). This estimate was not significantly different to the corresponding measured mean of 36 ± 4%. The same was true for the percentages estimated to have accumulated to depths of 0.15 and 0.25 m and the percentage estimated to have accumulated to a depth of 0.50 m (95%) was nearly 100%. These results were also interpreted to support that the Cd accumulated in the soil was located throughout a depth of 0–0.5 m.
Table 6. Measured cadmium (Cd) stock in the soil as a percentage of the cumulative stock to a depth of 0.5 m in plots which received annual SSP fertiliser applications from 1952 to 2009 (mean ± 95% CI, n = 8 plots).
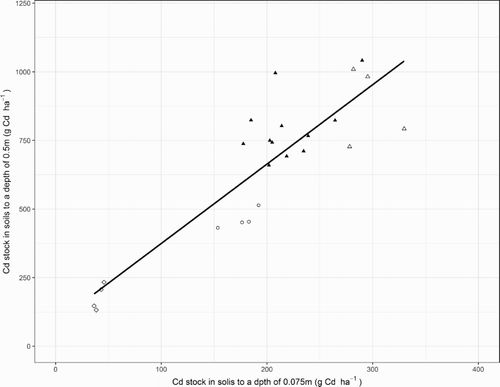
The Cd stocks in soils have commonly been assessed by sampling to a depth of only 0.15 m (e.g. Taylor Citation1997). From the results of this study, there was a statistically significant, linear relationship between the cumulative Cd stocks to depths of 0.075 and 0.5 m which accounted for 77% of the variability (). However, the SE of a regression estimate was relatively large, 130 g Cd ha−1 or 20% of the mean cumulative Cd stock to a depth 0.5 m. Consequently, there would be considerable uncertainty associated with estimating the cumulative Cd stock to a depth of 0.5 m from measurements of the Cd stock to a depth of 0.075 m. Moreover, by excluding data from the fertiliser trial’s four control plots which received no P fertiliser (the lower, left-hand group of data in ), linear regression accounted for only 40% of the variability and the SE of an estimate increased to 141 g Cd ha−1. These results were interpreted to suggest that sampling soils deeper than 0.075 m can improve the accuracy of Cd accumulation estimates.
Figure 6. Relationship between measurements of cadmium (Cd) stock in soils to a depth of 0.075 m and to a depth of 0.5 m in plots which received no fertiliser (◊) or phosphorus (P) applications of 17 (○), 22 kg P ha−1 y−1 (▴) and 34 kg P ha−1 y−1 (Δ). Also shown is the regression line which had a SE of 130 g Cd ha−1, 20% of the mean Cd stock to a depth of 0.5 m.
Discussion
The vertical distribution of Cd in the sampled soils
For soils in the Winchmore plots which had received superphosphate fertiliser for nearly six decades, the relationship between depth and the Cd density was curvilinear and the slope or curvature increased with increasing fertiliser application rate. Using Burn’s equation and assuming a 10% leaching loss in the first month (August) after each year’s fertiliser application, 37% of the total Cd stock was estimated to have been retained in the uppermost 0.075 m depth of soil and 95% in the uppermost 0.5 m. These estimated percentages were not significantly different to those derived from the measurements. In the sampled soils, the Cd concentration was mostly closely and positively correlated with the C concentration. Thus, the vertical distributions of Cd and C were remarkably similar. On this basis, Cd accumulation in the soils was attributed to sorption on the organic matter.
At Winchmore, by sampling soils to a depth of 0.25 m, significantly more earthworms were found in the fertilised plots than in those which had not been fertilised (Fraser et al. Citation1994). The dominant species was Aporrectodea caliginosa which readily migrates between the top and subsoil. By feeding on organic matter, excreting that which was not digested and vertical migration, earthworms could have transported Cd deeper in the soil. Consequently, at least in part, the vertical distribution of Cd in the soils sampled for our study could have been attributed to the action of earthworms.
In New Zealand, pastoral soils have not commonly been sampled deeply. Previously, soils have been sampled to a depth of 0.15–0.30 m to examine Cd accumulation in response to P fertiliser application (Rothbaum et al. Citation1986; Loganathan and Hedley Citation1997; Taylor Citation1997; Zanders et al. Citation1999). A recently published study was the exception by sampling three soils at intervals to a depth of 0.60 m on thirty pastoral farms with the same P fertiliser history (Salmanzadeh et al. Citation2016a). For the Horotiu, Bruntwood and Te Kowhai soils, using the supplemental data published by Salmanzadeh et al. (Citation2016a) and assuming the bulk density was the same for all of the samples in the absence of alternative data, we calculated the mean percentage of the total Cd stock measured in the uppermost 0.075 m depth of soil was 33 ± 3%, 33 ± 6% and 33 ± 4%, respectively, and 96 ± 2%, 98 ± 1% and 97 ± 1%, respectively, in the uppermost 0.5 m. These percentages were not significantly different to those determined by this study.
P fertiliser application and Cd accumulation rates in the sampled soils
In two previous studies, soils were repeatedly sampled at Winchmore to a depth of 0.075 m in the plots which received different levels of P fertiliser and the sample’s Cd concentration was measured. The soils were sampled in the years 1952, 1958, 1964, 1971, 1974, 1979, 1985, 1989 and 1996 by Gray et al. (Citation1999b) and 1952, 1958, 1961, 1965, 1974, 1977, 1981, 1987, 1990, 1994, 1998, 2004 and 2009 by McDowell (Citation2012). For this study, as stated, the soils were sampled to a depth of 0.075 m in 2009 and 2016. The three time series data sets were combined for regression analysis.
For the time series data from plots which had received no fertiliser, linear regression analysis indicated the slope was not significantly different to zero (P > .05, ). For the plots which received 17 kg P ha−1 y−1, by linear regression, the slope of 0.0031 ± 0.0012 mg Cd kg−1 soil y−1 was significantly greater than zero and the intercept was 0.0743 ± 0.0421 mg Cd kg−1 soil. For the plots which received 34 kg P ha−1 y−1, the slope of 0.0054 ± 0.0012 mg Cd kg−1 soil y−1 was also significantly greater than zero and the intercept was 0.1188 ± 0.0421 mg Cd kg−1 soil. Overall, linear regression accounted for 92% of the variability according to the adjusted R2 statistic. Alternatively, for data from the plots which received 17 and 34 kg P ha−1 y−1, a polynomial function was also used and a curvilinear model fitted, but the second-order (squared) term was too small to be statistically significant.
Figure 7. Relationships between time and the mean cadmium (Cd) concentration in soils to a depth of 0.075 m measured in plots which received no fertiliser (○ from McDowell (Citation2012) and ● from Gray et al. (Citation1999b) and this study) or phosphorus (P) applications of 17 (□ and ▪) and 34 kg P ha−1 y−1 (Δ and ▴). Also shown are regression lines fitted to the data for the plots which received 17 kg P ha−1 y−1 (solid) and 34 kg P ha−1 y−1 (dashed) as described in the text.
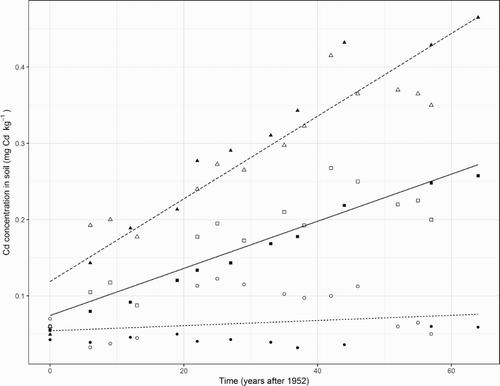
For 1952–2016 in the plots receiving 34 kg P ha−1 y−1, as stated, the estimated mean Cd accumulation rate in soils was 0.0054 ± 0.0012 mg Cd kg−1 soil y−1 which was 1.8 ± 0.8 times greater than that in the plots receiving 17 kg P ha−1 y−1. Accounting for the sampled depth of soil and the bulk density, the mean Cd accumulation rates were equivalent to 2.1 and 3.9 g ha−1 y−1 for the plots receiving 17 and 34 kg P ha−1 y−1, respectively. In contrast with these statistically significant, positive linear time trends, the Cd input rate by P fertiliser application was estimated to have reduced from 8.3 to 3.2 g ha−1 y−1 to the plots receiving 17 kg P ha−1 y−1 and from 16.7 to 6.5 g ha−1 y−1 to the plots receiving 34 kg P ha−1 y−1 (). While the additional estimates of atmospheric Cd input and leaching loss were based on experimental evidence, we acknowledge that accuracy of the estimated Cd input rates from the fertiliser could not be independently verified during the trial because samples of the fertiliser applied to the plots were not archived. Furthermore, the time series data came from soil samples collected only to a depth of 0.075 m and the Cd stock’s vertical distribution was measured only once. Though in 2009, 36% of the soil’s total Cd stock was found in the depth of 0–0.075 m, it is not known if this percentage varied during 1952–2016. Sampling soils more deeply in future could provide valuable information for better understanding the relationship between Cd input and accumulation rates in soils.
For soils in the Winchmore plots which had received 0, 17, 22 and 34 kg P ha−1 y−1 for nearly 60 years, we were able to account for the measured Cd stock to a depth of 0.5 m by estimating the cumulative Cd inputs by atmospheric deposition and P fertiliser application and the corresponding losses by leaching. These results were interpreted to indicate that Cd had accumulated in these soils according to mass conservation. Consequently, provided P fertiliser containing Cd continues to be applied to soils, atmospheric deposition of Cd continues, only 10% of these inputs will be lost by leaching, and between 5–10% by outwash, the existing Cd stock remains stable and sufficient capacity remains for further Cd sorption, Cd should continue to accumulate in these soils. The accumulation rate should be determined mostly by the fertiliser’s Cd concentration and application rate. Consequently, by reducing the Cd concentration as has been done by NZ’s fertiliser industry or the application rate or both, the Cd accumulation rate in soils should be proportionally reduced.
Conclusions
For soils beneath grazed pasture which had received P fertiliser for nearly six decades, the relationship between Cd density and depth was curvilinear and the slope or curvature increased with increasing fertiliser application rate. Nearly all of the soil’s total Cd stock was located from a depth of 0–0.5 m and about one-third was found in the uppermost 0.075 m depth. Leaching calculations using Burn’s equation reasonably estimated the measured Cd stock’s vertical distribution. Following the estimated month of leaching, the evidence which indicated no further losses included nil effects of irrigation on the Cd stock’s vertical distribution and a strong positive correlation between the Cd and soil carbon concentrations, suggesting Cd sorption on soil organic matter. Estimating the cumulative inputs from fertiliser and atmospheric deposition and the loss by leaching and outwash reasonably accounted for measurements of the soil’s Cd stock. By this evidence and the results from repeatedly sampling the soils from 1952 to 2016, we concluded Cd had accumulated in these soils at a rate dependent on the P fertiliser application rate.
Acknowledgements
We thank Professor Leo Condron for sharing archived soil samples which had been collected in the Winchmore plots in 2009 and Richard McDowell for sharing the Winchmore time series data from his earlier study. Ants Roberts and Richard McDowell reviewed a draft manuscript and provided constructive criticism.
Disclosure statement
No potential conflict of interest was reported by the authors.
Additional information
Funding
References
- Abraham E, Cavanagh J, Wood P, Pearson A, Mladenov P. 2016. Cadmium in New Zealand’s agriculture and food systems. In: LD Currie, R Singh, editor. Integrated nutrient and water management for sustainable farming. Occasional Report No. 29, Palmerston North: Fertilizer and Lime Research Centre, Massey University; p. 13.
- Anonymous. 2008. Report one: Cadmium in New Zealand agriculture. Report to Ministry of Agriculture and Forestry, 85 pages.
- Bech J, Suarez M, Reverter F, Tume P, Sánchez P, Roca N, Lansac A. 2010. Selenium and other trace element in phosphorites: a comparison between those of the Bayovar-Sechura and other provenances. Journal of Geochemical Exploration. 107:146–160. doi: 10.1016/j.gexplo.2010.04.002
- Blakemore LC, Searle PL, Daly BK. 1987. Methods for chemical analysis of soils. New Zealand Soil Bureau Scientific Report 80, 103 pages.
- Bramley RGV. 1990. Cadmium in New Zealand agriculture. New Zealand Journal of Agricultural Research. 33:505–519. doi: 10.1080/00288233.1990.10428451
- Cichota R, Kelliher FM, Thomas SM, Clemens G, Fraser PM, Carrick S. 2016. Effects of irrigation intensity on preferential solute transport in a stony soil. New Zealand Journal of Agricultural Research. 59:141–155. doi: 10.1080/00288233.2016.1155631
- David DJ, Pinkerton A, Williams CH. 1978. Impurities in Australian phosphate fertilizers. The Journal of the Australian Institute of Agricultural Science. 44:132–135.
- Fertiliser Matters. 2005. Cadmium in New Zealand – an update. New Zealand Fertiliser Manufacturer’s Research Association, Auckland. Newsletter 34.
- Fraser PM, Haynes RJ, Williams PH. 1994. Effects of pasture improvement and intensive cultivation on microbial biomass, enzyme activities, and composition and size of earthworm populations. Biology and Fertility of Soils. 17:185–190. doi: 10.1007/BF00336320
- Gray CW, McLaren RG, Roberts AHC. 2003a. Atmospheric accessions of heavy metals to some New Zealand pastoral soils. The Science of the Total Environment. 305:105–115. doi: 10.1016/S0048-9697(02)00404-7
- Gray CW, McLaren RG, Roberts AHC. 2003b. Cadmium leaching from some New Zealand pasture soils. European Journal of Soil Science. 54:159–166. doi: 10.1046/j.1365-2389.2003.00495.x
- Gray CW, McLaren RG, Roberts AHC, Condron LM. 1999a. Solubility, sorption and desorption of native and added cadmium in relation to properties of soils in New Zealand. European Journal of Soil Science. 50:127–137. doi: 10.1046/j.1365-2389.1999.00221.x
- Gray CW, McLaren RG, Roberts AHC, Condron LM. 1999b. The effect of long-term phosphatic fertiliser applications on the amounts and forms of cadmium in soils under pasture in New Zealand. Nutrient Cycling in Agroecosystems. 54:267–277. doi: 10.1023/A:1009883010490
- Hamon RE, McLaughlin MJ, Naidu R, Correll R. 1998. Long-term changes in cadmium bioavailability in soil. Environmental Science and Technology. 32:3699–3703. doi: 10.1021/es980198b
- Hewitt AE. 2010. New Zealand soil classification, Landcare Research Science Series No. 1, 3rd ed. Lincoln: Manaaki Whenua Press. 136 p.
- Kelliher FM, Condron LM, Cook FJ, Black A. 2012. Sixty years of seasonal irrigation affects carbon storage in soils beneath pasture grazed by sheep. Agriculture, Ecosystems and Environment. 148:29–36. doi: 10.1016/j.agee.2011.10.022
- Kelliher FM, Curtin D, Condron LM. 2013. Soil carbon stocks in particle-size fractions under seasonally irrigated, grazed pasture. New Zealand Journal of Agricultural Research. 56:239–244. doi: 10.1080/00288233.2013.808673
- Kim ND, Fergusson JE. 1992. Adsoprtion of cadmium by an aquent New Zealand soil and its components. Australian Journal of Soil Research. 30:159–167. doi: 10.1071/SR9920159
- Lee J, Grace ND, Rounce JR. 1994. Cadmium accumulation in liver and kidney of sheep grazing ryegrass/white clover pastures. Proceedings of the New Zealand Society of Animal Production. 54:31–34.
- Loganathan P, Hedley MJ. 1997. Downward movement of cadmium and phosphorus from phosphatic fertilisers in a pasture soil in New Zealand. Environmental Pollution. 95:319–324. doi: 10.1016/S0269-7491(96)00142-X
- MAF. 2011. Cadmium and New Zealand agriculture and horticulture: a strategy for long term risk management. Wellington: Ministry of Agriculture and Forestry.
- Magesan GN, Scotter DR, White RE. 1999. The utility of Burn’s equation to describe solute movement through soils under various boundary and initial conditions. European Journal of Soil Science. 50:649–656. doi: 10.1046/j.1365-2389.1999.00262.x
- McDowell RW. 2010. Is cadmium loss in surface runoff significant for soil and surface water quality: a study of flood irrigated pastures? Water Air and Soil Pollution. 209:133–142. doi: 10.1007/s11270-009-0186-6
- McDowell RW. 2012. The rate of accumulation of cadmium and uranium in a long-term grazed pasture: implications for soil quality. New Zealand Journal of Agricultural Research. 55:133–146. doi: 10.1080/00288233.2012.662901
- McKeague JA, Day JH. 1966. Dithionite- and oxalate-extractable Fe and Al as aids in differentiating various classes of soils. Canadian Journal of Soil Science. 46:13–22. doi: 10.4141/cjss66-003
- Prochnow LI, Plese LPM, Abrei MF. 2001. Bioavailability of cadmium contained in single superphosphate produced from different Brazilian raw materials. Communications in Soil Science and Plant Analysis. 32:283–294. doi: 10.1081/CSS-100103007
- Pulsford J. 1989. The Australian fertiliser industry–some perspectives. Agricultural Science. 2:38–43.
- R Core Team. 2016. R: a language and environment for statistical computing. R Foundation for Statistical Computing. Vienna, Austria. https://www.R-project.org/.
- Rickard DS, Moss RA. 2012. Winchmore and the long-term trials: the early history. New Zealand Journal of Agricultural Research. 55:93–103. doi: 10.1080/00288233.2012.662157
- Rothbaum HP, Goguel RL, Johnston AE, Mattingly GEG. 1986. Cadmium accumulation in soils from long-continued applications of superphosphate. Journal of Soil Science. 37:99–107. doi: 10.1111/j.1365-2389.1986.tb00011.x
- Salmanzadeh M, Balks MR, Hartland A, Schipper LA. 2016a. Cadmium accumulation in three contrasting New Zealand soils with the same superphosphate fertilizer history. Geoderma Regional. 7:271–278. doi: 10.1016/j.geodrs.2016.05.001
- Salmanzadeh M, Hartland A, Stirling C, Balks MR, Schipper LA, Georger E. 2016b. Use of cadmium isotopes to distinguish sources of cadmium in New Zealand agricultural soils: preliminary results. Fertolizer and Lime Research Centre Occasional Report 29, Palmerston North: Massey University; p. 4.
- Schroeder HA, Balassa JJ. 1963. Cadmium uptake by vegetables from superphosphate in soil. Science. 140:819–820. doi: 10.1126/science.140.3568.819
- Shepherd M, Wyatt J, Welten B. 2012. Effects of rainfall and soil type on dicyandiamide concentration in drainage from lysimeters. Soil Research. 50:67–75. doi: 10.1071/SR11330
- Smith LC, Moss RA, Morton JD, Metherell AK, Fraser TJ. 2012. Pasture production from a long-term fertiliser trial under irrigation. New Zealand Journal of Agricultural Research. 55:105–117. doi: 10.1080/00288233.2012.662897
- Srinivasan MS, McDowell RW. 2009. Irrigation and soil physical quality: an investigation at a long-term irrigation site. New Zealand Journal of Agricultural Research. 52:113–121. doi: 10.1080/00288230909510495
- Syers JK, Mackay AD, Brown MW, Currie LD. 1986. Chemical and physical characteristics of phosphate rock materials of varying reactivity. Journal of the Science of Food and Agriculture. 37:1057–1064. doi: 10.1002/jsfa.2740371102
- Taylor MD. 1997. Accumulation of cadmium derived from fertilisers in New Zealand soils. Science of the Total Environment. 208:123–126. doi: 10.1016/S0048-9697(97)00273-8
- US EPA. 2002. Sample preparation procedure for spectrochemical determination of total recoverable elements. Cincinnati, OH: National Exposure Research Laboratory, Office of Water, United States Environmental Protection Agency. October 1999.
- Walkley A. 1940. The zinc content of some Australian fertilizers. Journal of Council for Scientific and Industrial Research. 13:255–260.
- Williams CH, David DJ. 1973. The effect of superphosphate on the cadmium content of soils and plants. Australian Journal of Soil Research. 11:43–56. doi: 10.1071/SR9730043
- Zanders JM, Hedley MJ, Palmer AS, Tillman RW, Lee J. 1999. The source and distribution of cadmium in soils on a regularly fertilised hill-country farm. Australian Journal of Soil Research. 37:667–678.