
 ?Mathematical formulae have been encoded as MathML and are displayed in this HTML version using MathJax in order to improve their display. Uncheck the box to turn MathJax off. This feature requires Javascript. Click on a formula to zoom.
ABSTRACT
The objective of this study was to model the growth of dairy heifers to estimate the effects of breed and heterosis on live weight (LWT) and growth from three to 22 months of age. Data comprised of 1,653,214 LWT records obtained from 189,936 dairy heifers in 1547 herds. At all ages Holstein-Friesian (F) heifers were heavier than Holstein-Friesian–Jersey crossbred (F × J) which were heavier than Jersey (J) heifers. Heterosis effects for LWT were greatest at nine months of age (3.6%) and least at 22 months of age (2.0%). The growth pattern differed, as evidenced by the regression coefficients of the Legendre polynomial. Growth was non-linear and heterosis effects were different throughout the growth period. Friesian, J and F × J heifers exhibited different growth patterns. These differences in growth pattern should be considered when formulating target LWTs and growth rates for a pasture-based system.
Introduction
The predominant dairy breeds in New Zealand are Holstein-Friesian (F; 33.0%), Jersey (J; 9.3%) and Holstein-Friesian–Jersey crossbred (F × J; 48.0%) (Livestock Improvement Corporation and DairyNZ Citation2017). Holstein-Friesian is considered a later maturing and heavier breed than J (Leche Citation1971; Burke et al. Citation1998). Hickson et al. (Citation2011) reported that J heifers attained puberty at a younger age than F heifers, further emphasising their earlier maturity. Positive heterosis for mature live weight (LWT) has been reported in F × J cattle and ranged from 7.2 to 10 kg (Harris et al. Citation1996; Harris Citation2005). It would be expected that growing F × J heifers would also exhibit heterosis for LWT, although there are no estimates in the literature.
The recommended target LWTs for dairy heifers are 30% of mature LWT at 6 months of age, 60% at 15 months (mating) and 90% at 22 months (pre-calving) (Troccon Citation1993; Wathes et al. Citation2014). However, differences in the proportion of target LWT achieved between breeds at different ages have been reported (McNaughton and Lopdell Citation2013; Handcock et al. Citation2016), indicating that the appropriate target percentage may be different among breeds.
In pastoral farming systems, dairy heifers tend to follow a seasonal pattern of growth that matches pasture quality and quantity (Litherland et al. Citation2002; Handcock et al. Citation2016), rather than the linear trajectory that the target LWTs infer. Thus, the growth trajectory of heifers is likely to be influenced by breed and heterosis, as well as a range of environmental factors including feed supply and nutrition. An understanding of the potential breed and heterosis effects is needed to refine growth targets for heifers of different breeds and crosses under a pastoral system.
The objective of this study was to model growth curves of dairy heifers to estimate the effects of breed and heterosis on the LWT and growth from 3 to 22 months of age.
Materials and methods
Dataset
LWT records of New Zealand dairy heifers were extracted from the Livestock Improvement Corporation database. Heifers that were born from June to December (spring-calving season) between the 2006–07 and 2013–14 dairy seasons were considered. The heifers had at least two LWT records between birth and 12 months of age and two LWT records between 13 months of age and first calving at two years of age (between June and December) or 24 months of age for heifers that did not have a recorded calving date at two years of age. Heifers that had a LWT record within 15 days of each age in months were included for that age. Only heifers with known dam and sire and ≤2/16 (12.5%) of breeds other than F or J were included in the initial dataset of 189,936 heifers with 1,657,856 LWT records. Of these heifers, 48,026 were F; 12,407 were J and 129,503 were F × J. Breeds were defined as follows: heifers that were at least 87.5% (14/16) F were classified as F; heifers that were at least 87.5% (14/16) J were classified as J; heifers that were neither F nor J were classified as F × J.
Based on recorded pedigree and sire and dam breed proportions; individual animals’ breed proportions were known, and were used to calculate the coefficient of specific heterosis between F and J, F and Other breeds (O), and J and O using the following formula:where hij is the coefficient of expected heterosis between breeds i and j in the progeny; αsi and αsj are proportions of breeds i and j in the sire, respectively; and αdi and αdj are proportions of breed i and j in the dam, respectively (Dickerson Citation1973).
Initial data cleaning was completed by calculating the mean and standard deviation of LWT for each month of age, and for each breed. LWT records that were more than four standard deviations from their corresponding breed-age mean were removed (Pietersma et al. Citation2006). This method was iterated until no more records were deleted (Pietersma et al. Citation2006). This left a dataset comprised of 1,656,433 LWT records (1423 removed) obtained from 189,936 dairy heifers located in 1547 herds.
Heifers were born in the North (n = 90,353) and South Island (n = 99,583) of New Zealand. Age of dam was condensed into two ages: two years of age (n = 13,717), and mixed-age (greater than two; n = 176,219), where two-year-old dams were less than 30 months of age and mixed-age dams were greater than 30 months of age.
Growth curve model
Legendre polynomials of order two, three and four were fitted to LWT data using random regression to obtain an average growth curve for each heifer using ASReml (Gilmour et al. Citation2015). The goodness of fit achieved with the model was evaluated using the relative prediction error (RPE) (Rook et al. Citation1990). The model with the least RPE was selected.
To remove further outlier observations, the relative measurement error (RME) was calculated as:The RME calculates the percentage deviation of the actual LWT from the predicted LWT by assuming that the predicted LWT is the ‘true’ value. Ages where the model predicted LWT with an RPE greater than 6% were not considered when identifying outliers due to the predicted LWT not being accurate enough to be defined as the ‘true’ value. For all other ages; any actual LWT that had an absolute RME greater than 18% (mean + four standard deviations) was considered an outlier and removed from the dataset. The new dataset (Order4-clean) was 1,653,214 observations (3219 removed) on the same 189,936 animals. An order four Legendre polynomial was then fitted to ‘Order4-clean’ and was used for subsequent analysis.
The estimates of the regression coefficients from the fourth-order Legendre polynomial for each heifer were used to predict LWT at specific ages. The absolute growth rate (AGR) was calculated as (LWT2 – LWT1)/(t2 – t1). Where t1 is the initial age in days, t2 is the final age in days, and LWT1 and LWT2 are the corresponding predicted LWTs at these ages (Fitzhugh and Taylor Citation1971). The relative growth rate (RGR) was calculated as (ln (LWT2) – ln (LWT1))/(t2 – t1) (Fitzhugh and Taylor Citation1971).
Statistical analysis
The regression coefficients from the Legendre polynomial for each animal were analysed using linear mixed models that included the fixed effects of birth year, age of dam, island (North or South), the interaction between birth year and island, and the random effect of herd. Deviation from median birthdate (within-herd-year), proportion of F, proportion of O, heterosis F × J, heterosis F × O and heterosis J × O were fitted as covariates. The solutions of the mixed models were then used to predict the growth curves for heifers that were 16/16 F (F16), 16/16 J (J16) and first-cross F × J. The AGR and RGR curves for each breed were calculated from the growth curves.
Breed and heterosis effects for LWT and RGR at different ages were obtained using the same linear mixed model as above. Breed and heterosis effects for AGR at different ages were obtained using the same linear mixed model as for RGR with the addition of LWT at the initial age (LWT1) fitted as a covariate. The estimates from the models were used to predict the LWT, AGR and RGR of F16, J16 and first-cross F × J heifers at different ages. Confidence intervals at the 95% level (µ ± 1.96 standard error) were used to test for differences among breeds.
Results
Comparison of Legendre polynomials
The fourth-order Legendre polynomial was selected as the preferred model as it predicted LWT the best with the lowest RPE of 3.73%. At zero, one, two and 24 months of age the RPE was greater than 6% (21.74, 11.03, 6.49 and 6.28%, respectively). From 3 to 23 months of age, the RPE was between 2.24% and 5.11%. Due to the consistent under prediction of LWT between zero and two months of age and at 24 months of age, and the small number of records at zero, one, 23 and 24 months of age (data not shown), records were not removed during data cleaning at these ages due to the predicted LWT not being accurate enough to be defined as the ‘true’ value. Consequently, growth curves have been evaluated from 3 to 22 months of age.
Growth curve model – shape and parameters
The growth curve as indicated by the regression coefficients differed among breeds for the intercept (α0), linear effect (α1), quadratic effect (α2), cubic effect (α3) and quartic effect (α4; ).
Table 1. Estimates (±SEM) of the regression coefficients of the growth curve modelled with a fourth-order Legendre polynomial fitted to purebred Holstein-Friesian (F16), purebred Jersey (J16) and first-cross Holstein-Friesian–Jersey (F1 F × J) heifers born between spring 2006 and spring 2013.
Live weight
LWT was different among breeds such that F16 heifers were heavier than F1 F × J and J16 heifers throughout the growth period (, ). Estimates for breed and heterosis effects for LWT are shown in . Breed differences between F16 and J16 were estimated to be greatest at 18 months of age. Heterosis, in absolute values, was positive at all ages and greatest at 18 months of age. Heterosis (as a proportion of parent average) was greatest at nine months of age.
Figure 1. Predicted growth curves from three to 22 months of age for Holstein-Friesian (F16), Jersey (J16) and first-cross Holstein-Friesian–Jersey crossbred (F1 F × J) dairy heifers born between spring-2006 and spring-2013.
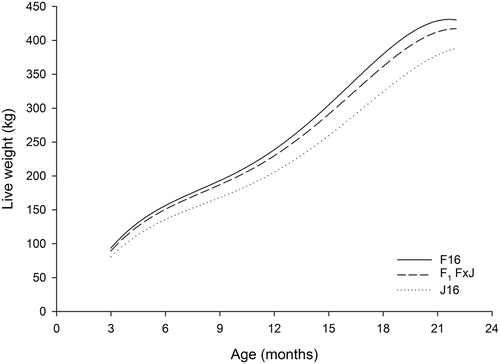
Table 2. Predicted live weight, absolute growth rate and relative growth rate (±SEM) of purebred Holstein-Friesian (F16), purebred Jersey (J16) and first-cross Holstein-Friesian–Jersey (F1 F × J) heifers and estimates of breed and heterosis effects at different ages.
Absolute growth rate
All breeds displayed seasonal variations in growth rate, as expected in a pasture-based system. Key periods of faster than average and slower than average growth can be identified from . The periods of the fastest growth were between 3 and 5 months of age (spring to early-summer) and between 12 and 20 months of age (late-winter to summer). The first period of slower growth occurred between summer and winter of their first year (5–12 months of age). The second period of slowest growth occurred during the pre-calving period (20–22 months of age) when F16 heifers grew on average 0.205 kg/d, F1 F × J and J16 heifers grew on average 0.239 and 0.263 kg/day, respectively ().
Figure 2. The absolute growth rate (AGR) from three to 22 months of age for Holstein-Friesian (F16), Jersey (J16) and first-cross Holstein-Friesian–Jersey crossbred (F1 F × J) dairy heifers born between spring-2006 and spring-2013 estimated from a fourth-order Legendre polynomial.
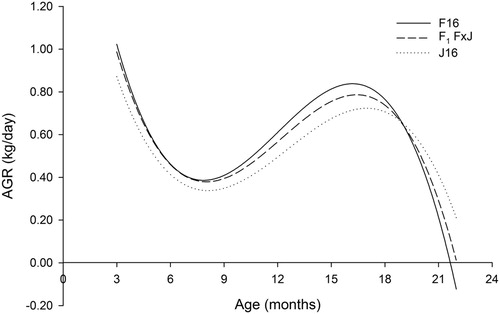
The mean AGR over the growth period studied (3–22 months) was greatest for F16 at 0.584 kg/day, intermediate for F1 F × J and slowest for J16 (0.567 and 0.529 kg/day, respectively). The maximum growth rate of 0.83 kg/d that was attained by F16 heifers occurred at 16 months of age, whereas the maximum growth rate that J16 heifers attained was 0.72 kg/d which occurred approximately a month later (17 months; ). Heterosis for AGR was greatest between 3 and 12 months of age and was not significant between 20 and 22 months of age.
Relative growth rate
The RGR followed a similar pattern for all breeds throughout the growth period studied (). RGR was the greatest for all breeds at three months of age, followed by a rapid decline in RGR up to six months of age. Between 6 and 18 months of age, RGR was relatively stable between 0.2% and 0.3% per day, followed by a further decline up to 22 months of age.
Figure 3. The relative growth rate (RGR) from three to 22 months of age for Holstein-Friesian (F16), Jersey (J16) and first-cross Holstein-Friesian–Jersey crossbred (F1 F × J) dairy heifers born between spring-2006 and spring-2013 estimated from a fourth-order Legendre polynomial.
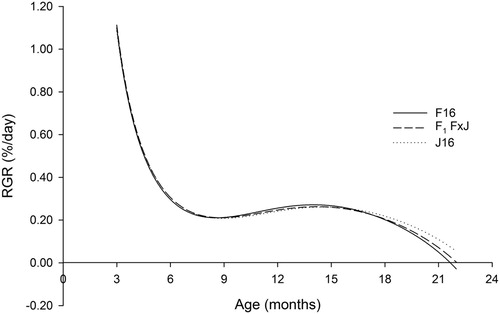
Over the 3–22-month growth period studied, the RGR for J16 heifers was the fastest, followed by F1 F × J, and F16 was the slowest (). This resulted in an overall small negative breed effect and a small negative heterosis effect (). As evidenced by the 95% CI, the RGR was similar for F16, F1 F × J and J16 heifers from three to 12 months (). From 12 to 20 months of age, the RGR for J16 heifers was similar to F16, but greater for J16 heifers compared with F1 F × J heifers (). By 20–22 months of age, J16 heifers were growing proportionally the fastest at 0.106% per day compared with F1 F × J and F16 heifers which grew at 0.069% and 0.050% per day over this period.
Discussion
Goodness of fit
Fuentes-Pila et al. (Citation1996) considered a model to be satisfactory when the RPE was less than 10%, therefore, the accuracy of the fourth-order Legendre polynomial for predicting LWT of dairy heifers in the current study was excellent (RPE less than 4%). Bryant et al. (Citation2004) considered an RPE between 5% and 8% to be acceptable for predicting LWT of dairy heifers at puberty using a modified version of the von Bertanlaffy equation. Hence, the selected fourth-order polynomial of the current study was demonstrated to be a very good model for predicting LWT in pasture-based dairy heifers.
Growth curve
All breeds demonstrated seasonal variations in growth, with the periods of slowest growth occurring between 20 and 22 months of age. The average age at first calving for the heifers in the current study was 24 months of age, so the period of slow growth coincided with the period when heifers returned from a heifer rearing facility to the milking farm, were introduced to the herd and the nutrient requirements for foetal growth increased exponentially. Thomson et al. (Citation1991) reported that the LWT gain of heifers in the three months prior to calving was 8 kg, compared with 33 kg for mature cows when heifers and mature cows were grazed together before heifers first calving. This may explain why the heifers in the current study showed minimal growth from 20 months onward.
In pasture-based systems, the majority of heifers rely entirely on pasture for their nutritional needs, whereas in grain-based systems, diets are specifically formulated to meet nutritional needs (Waghorn and Clark Citation2004). Heifer performance on pasture is affected by both the quality and quantity of pasture on offer, both of which are determined by temperature and rainfall (Waghorn and Clark Citation2004). In periods of high pasture quality and/or quantity; for example, in spring, growth rates of heifers will be faster compared with periods of low pasture quality and/or quantity such as in mid-summer (low rainfall) and mid-winter (low temperature). As seen in the present study, heifers grew slower in summer and winter than in spring.
The LWT of F16 heifers was consistently heavier than F1 F × J and J16 heifers in the present experiment, as expected based on the differences in mature size of 510, 471 and 420 kg, respectively (Livestock Improvement Corporation and DairyNZ Citation2017). However, the growth pattern was different as demonstrated by different regression coefficients: the intercept (α0) and linear (α1) effects of the Legendre polynomial represent overall growth rate, so larger values denote faster overall growth. Quadratic (α2), cubic (α3) and quartic (α4) effects are related to the curvature of the growth curve. Greater absolute values for these three effects create more curvature in the pattern compared with values closer to zero. The intercept and linear effects were greater for F16 than for F1 F × J and J16, which reflects that the overall growth rate was fastest for F16, intermediate for F1 F × J, and slowest for J16. The mean regression coefficient for the cubic effect was negative for F16 and positive for J16 (). This difference in direction of the cubic effect reflects that F16 heifers did not gain weight between 21 and 22 months, whereas J16 continued to increase in LWT. This is also reiterated in that the breed effects for AGR were positive up to 20 months of age and negative between 20 and 22 months of age.
Heterosis estimates for mature F × J cows ranged from 7.2 to 10 kg (Harris et al. Citation1996; Harris Citation2005), similar to the values in the current study from nine months of age onwards. Heterosis varied throughout the growth period in first generation F × J heifers in the USA (Hilder and Fohrman Citation1949). Furthermore, heterosis for LWT exhibited by F1 F × J heifers in the current study was the greatest (3.6%) at nine months of age and heterosis for AGR was greatest between 3 and 12 months of age. In beef heifers, the greatest effects of heterosis on growth rate were expressed from 200 to 400 days of age (approximately 6–13 months of age) (Gregory et al. Citation1978), similar to what was found in the present study. The difference in growth pattern among the breeds indicates that at different ages, one parent breed has a greater potential for growth compared with the other, and heterosis significantly contributes to the difference in growth pattern.
Animals that have heavy mature weights are generally later maturing compared with animals that have lighter mature weights (Taylor Citation1965). Similarly, animals that were heavier at maturity tended to be less mature at the same age compared with animals that were lighter at maturity (Fitzhugh and Taylor Citation1971). It would be expected that F16 heifers would be later maturing compared with J16 heifers, as F16 heifers were heavier than J16 heifers throughout the growth period studied, and mature F cows were heavier than mature J cows (Livestock Improvement Corporation and DairyNZ Citation2017). However, the RGR of F16 and J16 heifers in the present study was similar up to 20 months of age, which indicates that the breeds were maturing at similar rates, due to RGR being equal to the relative maturing rate, as demonstrated by Fitzhugh and Taylor (Citation1971). Additionally, Butler-Hogg and Wood (Citation1982) reported that at each age interval studied British F and J steers deposited similar proportions of body fat, which suggested that they were equally mature. Over the entire 3–22 months of age period studied the RGR of J16 was greater than F16 and F1 F × J, suggesting J16 were in fact earlier maturing. However, this difference appears to be driven by growth near the end of the measurement period; just prior to first calving. The differences over this period were more likely to be due to the combination of foetal growth and body growth, rather than body growth alone. In addition, Jersey and F × J heifers were better able to reach target LWTs in the pasture-based system, compared with F heifers (McNaughton and Lopdell Citation2013). It was hypothesised that if heifers were in grazing mobs of mixed breeds then the feeding level provided may not have been sufficient for the larger F heifers (McNaughton and Lopdell Citation2013).
Common growth models for animals require an asymptote of mature LWT (e.g. Brody, von Bertalanffy and Gompertz), however, this is not required for random regression. The LWT records on the heifers in the current study are only up until first calving, hence the heifers are still in the ascending growth stage with no information on mature LWT. If LWT measurements were available throughout the lifetime of the heifers in the current study, then a more traditional growth model would be appropriate and would enable further understanding of maturing rate differences among breeds.
The results from this study reiterate that heifer growth in a seasonal pasture-based system does not follow the linear trajectory that the target LWTs necessitate. Further research should be directed at understanding whether there are optimum growth trajectories for each breed in the pasture-based system to yield maximum milk production and reproductive performance.
Conclusions
Results reported here indicate that random regression using Legendre polynomials can accurately predict LWT and growth curves of dairy heifers. The results also showed that F, J and F × J cattle exhibit different absolute growth curves, and the expression of breed and heterosis effects varied throughout the growth period studied. Heifer growth in a seasonal pasture-based system does not follow the linear trajectory that the target LWTs necessitate. Different growth patterns for each breed should be considered when formulating target LWTs and growth rates.
Acknowledgements
The authors would like to acknowledge Katie Eketone for extracting the data provided by Livestock Improvement Corporation (Hamilton, New Zealand).
Disclosure statement
No potential conflict of interest was reported by the authors.
ORCID
Rhiannon C. Handcock http://orcid.org/0000-0001-7017-9948
Nicolas Lopez-Villalobos http://orcid.org/0000-0001-6611-907X
Additional information
Funding
References
- Bryant JR, Holmes CW, Lopez-Villalobos N, McNaughton LR, Brookes IM, Verkerk GA, Pryce JE. 2004. Use of breeding values for live weight to calculate individual live weight targets for dairy heifers. Proceedings of the New Zealand Society of Animal Production; Hamilton. Vol. 64, p. 118–121.
- Burke JL, Purchas RW, Morris ST. 1998. A comparison of growth, carcass, and meat characteristics of Jersey- and Friesian-cross heifers in a once-bred heifer system of beef production. NZ J Agri Res. 41(1):91–99. doi: 10.1080/00288233.1998.9513291
- Butler-Hogg BW, Wood JD. 1982. The partition of body fat in British Friesian and Jersey steers. Animal Production. 35(2):253–262. doi: 10.1017/S0003356100027434
- Dickerson GE. 1973. Inbreeding and heterosis in animals. J Anim Sci. 1973 (Suppl.):54–77. doi: 10.1093/ansci/1973.Symposium.54
- Fitzhugh HA, Taylor CS. 1971. Genetic analysis of degree of maturity. J Anim Sci. 33:717–725. doi: 10.2527/jas1971.334717x
- Fuentes-Pila J, DeLorenzo MA, Beede DK, Staples CR, Holter JB. 1996. Evaluation of equations based on animal factors to predict intake of lactating Holstein cows. J Dairy Sci. 79:1562–1571. doi: 10.3168/jds.S0022-0302(96)76518-9
- Gilmour AR, Gogel BJ, Cullis BR, Welham SJ, Thompson R. 2015. ASReml user guide release 4.1 structural specification, Hemel Hempstead, HP1 1ES, UK. VSN International.
- Gregory KE, Laster DB, Cundiff LV, Koch RM, Smith GM. 1978. Heterosis and breed maternal and transmitted effects in beef cattle II. Growth rate and puberty in females. J Anim Sci. 47:1042–1053. doi: 10.2527/jas1978.4751042x
- Handcock RC, Lopdell T, McNaughton LR. 2016. More dairy heifers are achieving liveweight targets. Proceedings of the New Zealand Society of Animal Production, Adelaide. Vol. 76, p. 3–7.
- Harris BL. 2005. Breeding dairy cows for the future in New Zealand. N Z Vet J. 53(6):384–389. doi: 10.1080/00480169.2005.36582
- Harris BL, Clark JM, Jackson RG. 1996. Across breed evaluation of dairy cattle. Proceedings of the New Zealand Society of Animal Production; Hamilton. Vol. 56, p. 12–15.
- Hickson RE, Balcomb CC, Fraser KR, Lopez-Villalobos N, Kenyon PR, Morris ST. 2011. The effect of breed on the onset of puberty in heifers. Proceedings of the Association for the Advancement of Animal Breeding and Genetics; The University of Western Australia, Perth, WA. Vol. 19, p. 51–54.
- Hilder RA, Fohrman MH. 1949. Growth of first-generation crossbred dairy calves. J Agri Res. 78:457–469.
- Leche TF. 1971. Growth and feed conversion of Jersey and Friesian bulls. Aus J Agri Res. 22:829–838. doi: 10.1071/AR9710829
- Litherland AJ, Woodward SJR, Stevens DR, McDougal DB, Boom CJ, Knight TL, Lambert MG. 2002. Seasonal variations in pasture quality on New Zealand sheep and beef farms. Proceedings of the New Zealand Society of Animal Production; Palmerston North, New Zealand. Vol. 62, p. 138–142.
- Livestock Improvement Corporation, Dairy NZ. 2017. New Zealand dairy statistics 2016–17. Hamilton: Livestock Improvement Corporation, DairyNZ.
- McNaughton LR, Lopdell T. 2013. Effect of heifer live weight on calving pattern and milk production. Proceedings of the New Zealand Society of Animal Production; Hamilton. Vol. 73, p. 103–107.
- Pietersma D, Lacroix R, Lefebvre D, Cue RI, Wade K. 2006. Trends in growth and age at first calving for Holstein and Ayrshire heifers in Quebec. Can J Anim Sci. 86:325–336. doi: 10.4141/A05-080
- Rook AJ, Dhanoa MS, Gill M. 1990. Prediction of the voluntary intake of grass silages by beef cattle. 2. Principal component and ridge regression analyses. Animal Production. 50(3):439–454. doi: 10.1017/S000335610000492X
- Taylor CS. 1965. A relation between mature weight and time taken to mature in mammals. Animal Production. 7(2):203–220. doi: 10.1017/S0003356100025629
- Thomson NA, Barnes ML, Prestidge R. 1991. Effect of cow age and winter liveweight gain, liveweight at calving and subsequent effects on dairy production in a seasonal supply herd. Proceedings of the New Zealand Society of Animal Production. 51:277–282.
- Troccon JL. 1993. Effects of winter feeding during the rearing period on performance and longevity in dairy cattle. Livestock Production Science. 36:157–176. doi: 10.1016/0301-6226(93)90149-C
- Waghorn GC, Clark DA. 2004. Feeding value of pastures for ruminants. N Z Vet J. 52(6):320–331. doi: 10.1080/00480169.2004.36448
- Wathes DC, Pollot GE, Johnson KF, Richardson H, Cooke JS. 2014. Heifer fertility and carry over consequences for life time production in dairy and beef cattle. Animal. 8:91–104. doi: 10.1017/S1751731114000755