
 ?Mathematical formulae have been encoded as MathML and are displayed in this HTML version using MathJax in order to improve their display. Uncheck the box to turn MathJax off. This feature requires Javascript. Click on a formula to zoom.
ABSTRACT
The efficacy of control tactics for Ranunculus acris was quantified on poorly- and well-drained soils in a factorial experiment conducted over three years in 18 dairy pastures. Soil drainage, gibberellic acid and nitrogenous fertiliser (growth promoters), and a bioherbicide utilising Sclerotinia sclerotiorum had no effect on the cover of R. acris. The herbicides aminopyralid and aminopyralid+triclopyr, by contrast, gave long-lasting reductions in the cover of the weed and substantial temporary reductions in the clovers. Flumetsulam, thifensulfuron methyl, MCPA, MCPB and MCPB+bentazone were less effective overall. Pregraze mowing reduced R. acris as the frequency of mowing increased. For all herbicides, there was a 1:1 replacement of R. acris by grasses and clovers. The efficacy of the treatments varied greatly between pastures, possibly due to genetic differences between the R. acris populations and their historical exposure to the herbicides.
Introduction
Ranunculus acris L. is a morphologically highly variable species complex in its native European range, consisting of several subspecies and varieties (Coles Citation1971). A weed of old pasture and hay meadows (Harper and Sagar Citation1953), it has naturalised in New Zealand (Webb et al. Citation1988) where it has become an economically significant weed of dairy pastures in some districts (Bourdôt et al. Citation2003). New Zealand is climatically optimal throughout (Bourdôt et al. Citation2013), putting all dairying districts at risk. Like other members of the genus, it produces the glycoside, ranunculin (Connor Citation1977). Through enzymatic breakdown after inadvertent ingestion by grazing animals, ranunculin forms the vesicant, protoanemonin (Harper and Sagar Citation1953) causing blistering of the lips and tongue, intestinal disorders, and potentially fatal ventricular fibrillation and respiratory failure. Protoanemonin also causes R. acris and its nearby pasture plants to be avoided by dairy cattle and other grazing animals, reducing livestock carrying capacity (Harper Citation1957) and the economic returns from dairy farming (Bourdôt et al. Citation2003; Bourdôt and Saville Citation2010; Saunders et al. Citation2017).
Paraquat, diquat, 2,4-D and MCPA herbicides reduced R. acris and increased the abundance of more nutritious species in experiments in deteriorated natural meadows in Czechoslovakia (Hrazdira Citation1970), Russia (Babenko Citation1991), Norway (Vidme Citation1973), Slovakia (Lackovic Citation1974) and in north-western and central France (Delpech Citation1976). The combined application of NPK fertilisers and MCPA also reduced the weed’s population sizes in deteriorated natural grasslands in Norway (Vidme Citation1973), Slovakia (Lackovic Citation1974) and Czechoslovakia (Hrazdira Citation1975). An analysis of published field experiments in New Zealand showed that herbicides provide partial (and highly variable) control of the weed; MCPA, MCPB, thifensulfuron methyl, flumetsulam, glyphosate, 2,4-D+picloram and 2,4-D+dicamba giving mean reductions in cover of 59%, 23%, 53%, 67%, 75%, 53% and 18%, respectively, when assessed 2–3 weeks after application (Lamoureaux and Bourdôt Citation2007). Variability between experiments may be due to: (1) evolved herbicide resistance (Bourdôt et al. Citation1990); (2) differences between pastures in their ability to suppress the recruitment and regeneration of R. acris plants after spraying (Brown Citation1993); (3) genotype differences within the species (Houliston et al. Citation2015).
Two plant pathogenic fungi occurring naturally on R. acris in New Zealand have been evaluated as bioherbicides. One of these, probably a species of Gnomonia, readily sporulated in culture but the foliar application of spores resulted in only 30%–40% of R. acris plants becoming infected and there was no mortality (Hardwick et al. Citation1993). The second fungus, Sclerotinia sclerotiorum, causes a watery soft-rot disease and death of infected R. acris plants. It is harmless to pasture grasses and clovers, and despite its wide host range, the risk of disease in crops downwind of a treated pasture is negligible due to the spore-trapping ability of pastures (Bourdôt et al. Citation2006). Field experiments evaluating a wheat-based S. sclerotiorum bioherbicide have revealed variable mortality and stunting of survivors (Verkaaik et al. Citation2004).
Cutting pastures containing R. acris reduced its flowering in red fescue (Festuca rubra)-dominated dry valley meadows in Russia (Saurina Citation1972). With increasing frequency, cutting reduced the occurrence of R. acris in ‘set-aside’ vegetation in Scotland (Ford Citation1996), in a cocksfoot (Dactylis glomerata) dominated grassland in Austria (Buchgraber and Sobotik Citation1995), and in low-yielding meadows under-sown to lucerne (Medicago sativa) in Dagastan (Andreev and Gamidov Citation1985). By contrast, in long-term trials in Slovenia, R. acris encroached into intensively grazed meadows after 5–7 years when the annual cutting frequency was increased from 2 to 3–4 cuts per year due to loss of competitive tussock grasses (Leskosek Citation1996). These results suggest that mowing may reduce R. acris in a pasture so long as competitors are not also reduced.
Grazing tends to promote R. acris. In an abandoned semi-natural grassland in northern Finland, small herbs, including R. acris, increased when sheep (10/ha) were introduced; litter removal and exposure of bare soil (presumably promoting germination of R. acris seeds) and the suppression of dominant competitive grasses and herbs apparently facilitated this increase (Hellstrom et al. Citation2003). In grass fields in Iceland, R. acris also increased with increased grazing (in spring) (Thorvaldsson Citation1996). In Britain, R. acris increased in abundance with pasture age, cropping for hay, and with overgrazing by animals that avoid the plant (Harper Citation1957). In the Tasman district of New Zealand, R. acris is much less prevalent in sheep than in dairy pastures (Brown Citation1993), but the extent to which this is due to the species being eaten by sheep is unclear (Brown Citation1993).
Fertilisers applied to deteriorated pastures in experiments in Austria (Buchgraber and Sobotik Citation1995), Slovenia (Leskosek Citation1996), Russia (Babenko Citation1991) and New Zealand (Brown Citation1993) had little effect on the abundance of R. acris. By contrast, low-yielding natural grassland on peat bog soils near Moscow in Russia dominated by R. acris had a higher proportion of palatable grasses following an application of nitrogen, phosphorus and potassium fertilisers with phosphorus (as P2O5) being most effective (Melnikov et al. Citation1975). Similarly, in low-pH grassland dominated by annual grasses in north-western Greece, nitrogen addition reduced the relative abundance of R. acris (Tzialla et al. Citation2002). Overall, these experiments suggest that fertilisation of deteriorated pasture containing R. acris does not reduce the weed’s abundance, although it may promote the more palatable species.
This paper presents the results of a three-year study conducted on nine dairy farms in the Golden Bay district of the Tasman region of New Zealand in which chemical, biological and mechanical approaches for controlling R. acris varying in mode-of-action were compared in a factorial experiment. The study compared all herbicides available in New Zealand with label claims for R. acris in pastures using the recommended rate of application. It also included growth promoters and mowing suggested by dairy farmers based on their experience. The main objective was to quantify the effects of each approach separately, and in combination, as a basis for recommendations for dairy farmers for cost-effective control of the weed without inducing herbicide resistance. Efficacy of a treatment was gauged by the magnitude and longevity of replacement of R. acris in the treated sward by grasses and clovers.
Methodology
Experiment design
The experiment was established on three different dairy farms in the Golden Bay (Tasman region of New Zealand) in spring of each of the years 2014/15 (Year-1), 15/16 (Year-2) and 16/17 (Year-3) giving nine farms in total. The most northerly farm was near Collingwood at 40°39′29.92′S and 172°38′58.81′E (0.0 m a.s.l.) and the most southerly in the Upper Takaka valley at 41°01′03.10′S and 172°49′09.84′E (84 m a.s.l.). On each farm, the design, represented in the diagram below, was a 2 × 2 × [8 × 3 + 1 (3 replicates)] factorial (with no replication) occupying 108 plots on each farm, 54 in each of two paddocks (blocks). The two paddocks on each farm were selected as ‘wet’ and ‘dry’ (judged by the farmer according to how rapidly the soil becomes dry enough in spring to support a tractor); they were used as blocks for the purpose of the analysis since their lack of consistency in wetness across the nine farms became apparent after set up.
The treatments were arranged in the field in a split plot layout (). The ‘pregraze mowing’ treatment was allocated to main plots, and ‘herbicide’, ‘growth promoter’ and a ‘Sclerotinia’ treatment to subplots.
Figure 1. A block in the experiment as established in each of two paddocks on each of nine dairy farms illustrating the layout of the ‘pregraze mowing’ main plots (10 m × 54 m) and the ‘herbicide’, ‘growth promoter’ and ‘Sclerotinia’ subplots (2 m × 10 m).
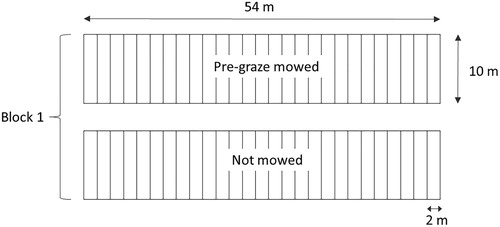
All chemicals () were applied using a hand-operated CO2-gas-powered precision out-rigger boom fitted with either four size 02 (200 L/ha) or size 03 (300 L/ha) hydraulic nozzles (Teejet) spaced at 50 cm. The Sclerotinia sclerotiorum bioherbicide was applied by hand as a dry mycelial-infested brewers waste barley formulation at 10 g/m2 produced according to a previously described method (Verkaaik et al. Citation2004); to ensure adherence to the R. acris, the subplots were sprayed with water prior to application. All treatments were applied on the same day to the 2 m × 10 m plots in mid-October 2014, 2015 and 2016 at the Year-1, -2 and -3 farms, respectively. Weather conditions were generally suitable for spraying but potentially suboptimal for the ‘Sclerotinia’ treatment. After spraying, the pregraze mowing treatment was imposed by the farmer ahead of every grazing (when possible), except the grazing immediately following the herbicide applications, until the termination of the experiment in June 2017.
Table 1. Details of the chemical and bioherbicide treatments applied in the experiment.
Measured variables
Treatment effects were assessed 2, 7, 19 and 31 months after herbicide application for the Year-1 farms (mid-December 2014, mid-May 2015, mid-May 2016, mid-May 2017), 2, 7 and 19 months after treatment for the Year-2 farms and 2 and 7 months after for the Year-3 farms. On each occasion, two independent observers visually estimated the ground cover (%) of six sward components: ‘R. acris’; ‘grasses’ (Lolium perenne and other grass species); ‘clovers’ (mainly Trifolium repens); ‘dock’ (Rumex obtusifolius); ‘other’ (dicotyledonous species); ‘bare soil/litter’. The five components summed to 100 and were averaged across both observers to provide the raw data for analysis. The percentage cover estimates were made by visual observation on the central 9 × 1 m area in each 10 × 2 m subplot.
Paddock management records were kept by each of the dairy farmers for the duration of the experiment. They recorded, for each grazing, the time and date of the mowing treatment, number of cows in the herd and when the cows entered and vacated the paddock. Reasons for not mowing were recorded. The plots were mown as close to the ground as possible, typically the day before the cows entered the paddock. Historical records of the management activities in the experiment paddocks were provided by the farmer where available including when the pasture was sown, what species were sown and herbicide usage.
Pasture plant species
The 18 pastures in this experiment were typically dominated by grasses and clovers, with sown Lolium perenne and Trifolium repens common species along with broad-leaved dock Rumex obtusifolius. Grasses other than L. perenne occurred but were not identified to the species level. The dicotyledonous species constituting the ‘other’ component of the pasture swards varied between the pastures and included: Achillea millefolium; Bellis perennis; Capsella bursa-pastoris; Cichorium intybus; Cirsium arvense; Cirsium vulgare; Conzya sp.; Crepis capillaris; Cyperus eragrostis; Daucus carota; Geranium molle; Hypochaeris radicata; Jacobaea vulgaris; Lotus corniculatus; Lycopus europaeus; Mentha pulegium; Modiola caroliniana; Oaxlis sp.; Pastinaca sativa; Persicaria hydropiper; Plantago lanceolata; Plantago major; Prunella vulgaris; Ranunculus repens; Ranunculus sardous; Ranunculus sceleratus; Rumex pulcher; Sonchus oleraceus; Stellaria media; Taraxacum vulgaris; Veronica arvensis; Veronica persica. Several rushes (Juncus spp.) were also included in the ‘other’ component.
Derived variables
Absolute change in the percentage ground covers of R. acris and of grasses and clovers
Two variables were derived from the raw data to assess the extent to which desirable pasture species replaced R. acris when its abundance was reduced by treatments. These were: (a) the absolute increase in the percentage ground cover of grasses and clovers (sum of the covers of ‘grasses’ and ‘clovers’ sward components [‘grasses and clovers’]) and (b) the absolute decrease in cover of R. acris. They were derived for each of the four assessment occasions (2, 7, 19 and 31 months after application) as the difference between the treated and not-treated (nil herbicide and unmown) plots averaged over the ‘growth promoter’ treatments. Thus, the nil plots were transformed to mean zero with variation around this mean. The decrease in the cover of R. acris was calculated in the same manner. These variables illustrate absolute differences in covers of R. acris and ‘grasses and clovers’ sward components as compared to covers that would have been expected at each point in time in the absence of the herbicide or mowing treatments.
Relative change in the ground cover of R. acris, grasses and clovers
Two additional variables, to compare the efficacy of the ‘herbicide’ treatments, were derived from the raw data: the relative reduction or increase, respectively, in the ground covers of (a) R. acris and (b) the ‘grasses and clovers’ components of the swards. These variables were calculated as for the absolute covers, but expressed as percentage reduction or increase, respectively, relative to the unmown control plots.
Statistical analyses
A linear model was fitted to the natural log-transformed percentage cover of R. acris or grasses and clovers, with the farm and paddock (blocks) combined as a random effect. Significance of effects in the model were found by comparing models with and without that effect with the appropriate Chi-square statistic. All models were fitted using the lme4 package (Bates et al. Citation2015) in R (R Core Team Citation2017). Results are presented as raw means.
The consequence of fitting the random effect is that that the data were averaged over nine farms for the assessments conducted two and seven months after treatment. The nine farms comprised three established in each of Year-1, Year-2 and Year-3. Hence, the results are not only averaged over the nine farms, but also over the three years. Similarly, for the assessments conducted after 19 months, data were averaged across farms established in Year-1 and Year-2 (three in each year). Finally, at 31 months, data were available for only Year-1 farms. Averaging treatment effects in this way confounds year-to-year and farm-to-farm variability. The individual year and farm effects, as well as their interaction, can be estimated, but these have not been included in any of our reported models because they were small and their inclusion did not change the overall conclusions. Such variation would, in any case, be inherent in any practical use of the treatments on other farms in other years.
In summary, at the lowest level of the experiment, we have a factorial design with eight herbicide treatments and three growth promoter treatments allowing us to average over these to quantify the main effects. For the assessments made at 2 and 7 months after treatment, we have three farms in each of the years 1, 2 and 3. So we can conclude that any effects of the herbicides evident at these times are not a result of particular environmental influences in a single year, but that they are present in each of the years. Beyond 7 months after treatment, any persisting effects of the herbicides are less robustly estimated because they are based on decreasing number of observations (farms) in each subsequent year. The latter is a result of the design being resource-constrained (to three years) and our philosophy of spreading the treatments over time (three years) and space (six paddocks per year).
Results and discussion
Grazing and mowing frequencies
Paddock management records kept by the farmers during the experiment were available for 16 of the 18 paddocks. These revealed that, across farms and years, grazing occurred between 8 and 10 times per year. The ‘pregraze mowing’ treatment was implemented, on average, for 51% (±22.5 [standard deviation]) of the grazing events (varying between paddocks from 11% to 86%). Where mowing reduced the cover of R. acris, mowing had been implemented, on average, for 65% of the grazing events. Where there was no response, mowing had been implemented, on average, for 40% of grazing events.
Treatment effects
Pasture composition
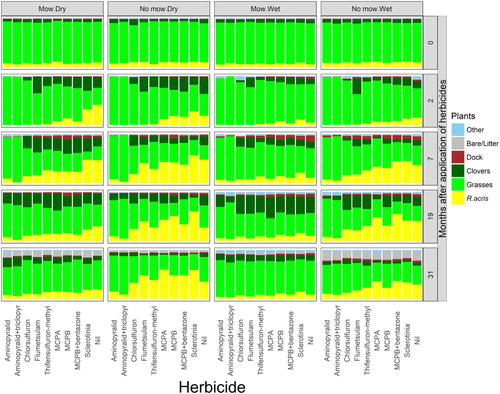
The effects of the ‘herbicide’ and ‘pregraze mowing’ treatments on the relative contributions of the five measured components to the total sward are illustrated for one of the Year-1 farms in . The data are averages over the ‘growth promoter’ treatments because there was no effect of gibberellic acid or nitrogenous fertiliser on this farm, or any of the other eight farms, a result consistent with the fertile nature of the soils on these dairy farms. Despite considerable variation between the farms and paddocks in treatment responses (considered in detail below), illustrates several consistent features. First, at all times of observation following application, and similarly in both paddocks (‘wet’ and ‘dry’), the herbicides varied in the extent to which they reduced the cover of R. acris. Second, clovers were absent from the sward 7 months after application of the two herbicides containing aminopyralid, but had returned by 19 months. Third, these two herbicides provided greater and longer-lasting reductions in R. acris than any of the other herbicides. Fourth, pregraze mowing, in both paddocks, reduced the cover of R. acris, an effect evident at 7, 19 and 31 months. Fifth, the cover of ‘grasses’ and ‘clovers’ components was greater where the ‘R. acris’ component was reduced, but the cover of other species and docks was not affected. Sixth, the Sclerotinia had no effect.
Figure 2. Pasture composition on one of the three Year-1 farms as affected by paddock wetness ‘blocks’, ‘pregraze mowing’ and ‘herbicide’ treatments (applied October 2014). The values presented are averages over the ‘growth promoter’ treatments (gibberellic acid and N-fertiliser) which had no effect, and are illustrative of the results on the other 8 farms.
Ground cover of the R. acris, grasses and clovers
Herbicide treatment and mowing significantly reduced R. acris ground cover (). The overall effect of the herbicides was highly significant at all assessment times (2–31 months after treatment) and there is good evidence that the herbicides varied in persistence. By contrast, the mowing effect was not significant until 7 months after treatment and strengthened with time. The latter indicates a cumulative effect of repeated defoliation of the R. acris and may reflect a slow reduction in the regenerative reserves available in the rhizome. There was no evidence of an interaction between herbicide and mowing at any of the assessment times. The lack of any temporal trend in the cover of the R. acris on the control plots, evidenced by the similarity of the covers measured in the three consecutive May periods (7, 19 and 31 months after the study commenced), suggests that these populations may be at an equilibrium at an average of 24% ground cover.
Table 2. The effect of chemical herbicide treatments in the presence (+) and absence (−) of pregraze mowing on the ground cover of Ranunculus acris (%) averaged over the ‘wet’ and ‘dry’ paddocks and the growth promoter treatments ‘gibberellic acid’ and ‘N-fertiliser’ as assessed 2, 7, 19 and 31 months after application.
The percentage ground cover of the ‘grasses and clovers’ sward component increased significantly in both the herbicide and mowing treatments (). The herbicide effect was, again, highly significant at all assessment times (2–31 months after treatment) while the mowing effect was significant from 7 months after treatment, and strengthened with time. There was evidence of an interaction between herbicide and mowing at 2 and 7 months; the proportional increase in the ‘grasses and clovers’ due to herbicide treatment being greater in the absence of mowing.
Table 3 The effect of chemical herbicide treatments in the presence (+) and absence (−) of pregraze mowing on the % ground cover of ‘grasses and clovers’ averaged over the ‘wet’ and ‘dry’ paddocks and the growth promoter treatments ‘gibberellic acid’ and ‘N-fertiliser’ as assessed 2, 7, 19 and 31 months after application.
Absolute change in the ground covers of R. acris, grasses and clovers
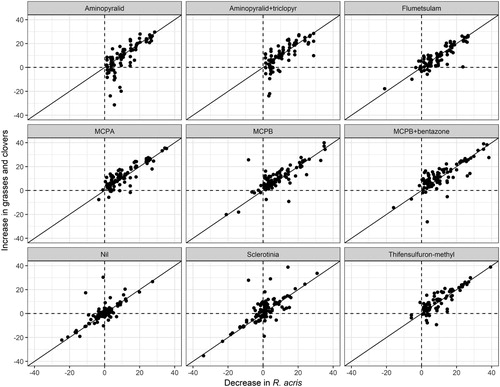
Close adherence to a 1:1 relationship was observed when the decrease in the percentage ground cover of R. acris was plotted against the increase in cover of grass and clover for all four assessment occasions (2, 7, 19 and 31 months after herbicide treatment). This relationship is illustrated using data from the assessment conducted 2 months after application for all 18 paddocks (). The close proximity of the data to the 1:1 line, and the prevalence of positive values for all herbicides, indicates that in all cases the resources released by removing R. acris through the action of the herbicide were utilised by grasses and clovers. The spread of the data along these lines reflects a wide variation between the paddocks (and farms) in the level of infestation of R. acris. The clumping of the data around the zero point for ‘Sclerotinia’ (as for the ‘Nil’ treatment) indicates this treatment had no effect; these data were excluded from subsequent analyses. Points above the 1:1 replacement line may be explained by the presence of weeds on these plots in addition to R. acris being removed by the herbicide and replaced by grasses and clovers. Points below may be explained by toxicity of the herbicide towards the grasses or clovers. The latter is evident, particularly for the herbicides containing aminopyralid, a compound that is highly toxic toward many dicotyledonous plants, including legumes (Young Citation2012).
Figure 3. Relationships between the increase in cover (% of ground covered) of ‘grasses and clovers’ and the decrease in cover of R. acris in the pasture 2 months after the ‘herbicide’ and ‘Sclerotinia’ treatments were applied. The data presented are the averages over the ‘pregraze mowing’ and ‘growth promoter’ treatments and the two blocks (paddocks) for each of the nine farms. The increases and decreases were calculated as the absolute differences in cover between the treated and nil plots. The 1:1 line indicates substitution between R. acris and grasses and clovers.
Relative change in the ground cover of R. acris and of grasses and clovers
The herbicides varied substantially in their short- and long-term impacts on the ground cover of R. acris, grasses and clovers, and in their interaction with pregraze mowing. These effects are best evaluated, for a particular time after treatment application, as the percentage difference (decrease or increase) in ground cover due to the treatment relative to the unmown control ( and ).
Figure 4. Box-plots of the effects on the ground cover of R. acris of the herbicides averaged over the two growth promoter treatments, two paddocks and 9, 9, 6 and 3 farms for 2, 7, 19 and 31 months after application, respectively (2592 observations). The effects are given as percentage reductions in percentage ground cover (mean [diamond within box], median [line within box], 50th percentile [box], 75th percentile [vertical line beyond box] and outliers ([circles beyond vertical lines]) relative to the No-Mow controls (Data in Table S1). A total of 37 outliers out of 2592 observations have been excluded from the graphs. Horizontal dashed lines are drawn to aid interpretation.
![Figure 4. Box-plots of the effects on the ground cover of R. acris of the herbicides averaged over the two growth promoter treatments, two paddocks and 9, 9, 6 and 3 farms for 2, 7, 19 and 31 months after application, respectively (2592 observations). The effects are given as percentage reductions in percentage ground cover (mean [diamond within box], median [line within box], 50th percentile [box], 75th percentile [vertical line beyond box] and outliers ([circles beyond vertical lines]) relative to the No-Mow controls (Data in Table S1). A total of 37 outliers out of 2592 observations have been excluded from the graphs. Horizontal dashed lines are drawn to aid interpretation.](/cms/asset/95b425f6-1404-4a04-a109-f322413194af/tnza_a_1470991_f0004_oc.jpg)
Figure 5. Box-plots of the effects on the ground cover of the ‘grasses and clovers’ sward component of the herbicides averaged over the two growth promoter treatments, two paddocks and 9, 9, 6 and 3 farms for 2, 7, 19 and 31 months after application, respectively. The effects are given as percentage increases in percentage ground cover (mean [diamond within box], median [line within box], 50th percentile [box], 75th percentile [vertical line beyond box] and outliers ([circles beyond vertical lines]) relative to the No-Mow controls (Data in Table S1). A total of 30 outliers out of 2592 observations have been excluded from the graphs. Horizontal dashed lines are drawn to aid interpretation.
![Figure 5. Box-plots of the effects on the ground cover of the ‘grasses and clovers’ sward component of the herbicides averaged over the two growth promoter treatments, two paddocks and 9, 9, 6 and 3 farms for 2, 7, 19 and 31 months after application, respectively. The effects are given as percentage increases in percentage ground cover (mean [diamond within box], median [line within box], 50th percentile [box], 75th percentile [vertical line beyond box] and outliers ([circles beyond vertical lines]) relative to the No-Mow controls (Data in Table S1). A total of 30 outliers out of 2592 observations have been excluded from the graphs. Horizontal dashed lines are drawn to aid interpretation.](/cms/asset/bd95cd1d-5fb2-4c6c-b42b-a1f11fb1e659/tnza_a_1470991_f0005_oc.jpg)
Aminopyralid and aminopyralid+triclopyr were more effective in reducing R. acris ground cover than the other herbicides (). This was the case both in the short term, as assessed 2 months after application, and longer term, as assessed 7, 19 and 31 months after application; reductions in excess of 60% (compared with the control treatment) remained at 31 months after treatment. There were slight increases in the effect of these herbicides with pregraze mowing. By contrast, the other herbicides tended to be much less effective in the short term and their effectiveness declined more rapidly with time. Combining these herbicides with pregraze mowing resulted in greater and more persistent reductions in R. acris. Pregraze mowing alone reduced the cover of R. acris by approximately 25% after an initial reduction of about 45% two months after treatment.
Variability between paddocks in the effectiveness of the different herbicides is a notable feature of the data (). The two herbicides containing aminopyralid were the least variable, the two ALS inhibitors flumetsulam and thifensulfuron the most variable, and the phenoxys MCPA and MCPB intermediate. This is particularly evident at 7 months after treatment (). These differences due to herbicide group may in part be due to variation between paddocks in evolved resistance to the herbicides stemming from their previous use. Historical records predating the experiment (available for 16 of the 18 paddocks – not presented here), revealed that aminopyralid and aminopyralid+triclopyr had not been used on any farms. By contrast, flumetsulam had been used on 10 of the paddocks at a frequency ranging from 1 in 20 to 9 in 9 years. Thifensulfuron methyl had been used on two of the paddocks for 1 in 6 and 1 in 4 years. MCPA had been used in four of the paddocks ranging in frequency between 9 in 26 and 2 in 9 years, while MCPB had been used in two of the paddocks at a frequency of 1 in 24 years.
The effectiveness of herbicides and mowing against R. acris is reflected in corresponding increases in the ‘grasses and clovers’ component of the swards (). The largest increases in cover of the grasses and clovers were associated with the aminopyralid herbicides and pregraze mowing resulted in greater increases only when combined with the other herbicides. The pregraze mowing was effective alone in increasing the grasses and clovers component and there was a tendency for this effect to increase over time.
General discussion
In this experiment, a single application of any one of the seven different herbicides reduced the cover of R. acris in the experimental pastures. Pregraze mowing also reduced the cover of R. acris independently. The magnitude and duration of these effects varied substantially ( and ), implying there will be differences between treatments in their profitability. Furthermore, the profitability of any of the treatments will vary between paddocks because there is also considerable variation in the treatment effects at this scale. In estimating the profitability of a proposed herbicide/mowing regime, these sources of variation, in addition to pasture dry matter production losses associated with any loss in clover (Enriquez-Hidalgo et al. Citation2015; Chapman et al. Citation2017) and pregraze mowing (Kay et al. Citation2018), and the pasture production loss associated with the cover of R. acris in the paddock of interest, will need to be taken into account. A method for estimating pasture production loss associated with R. acris arises from our experiment. R. acris is avoided by dairy cows (Harper and Sagar Citation1953), so arguably the occupied area represents an equivalent loss in pasture dry matter yield (Bourdôt et al. Citation2003). This idea is supported by the 1:1 replacement of R. acris by grasses and clovers in our experiment (). It suggests that the loss, L, in annual pasture dry matter yield of a paddock due to R. acris (kg DM/ha/year) can be given as:where C is the average annual ground cover of the weed in the paddock (as a percentage) in the absence of a control programme and DM is the total annual dry matter yield of the pasture (tonnes/ha/year) from the infested paddock.
The loss in pasture dry matter yield, preventable by a treatment, will be the sum of the losses, L, prevented in each year of a treatment programme discounted by any direct losses in pasture dry matter through herbicide damage to clovers (Enriquez-Hidalgo et al. Citation2015; Chapman et al. Citation2017) and/or reduced pasture growth due to mowing (Kay et al. Citation2018). These ideas will be developed further in the following paper where the profitability of alternative herbicide and mowing tactics will be considered.
Table S1 Percentage decreases and increases, respectively, in the percentage ground cover of Ranunculus acris and ‘grasses and clovers’ as affected by herbicides and mowing, measured 2, 7, 19 and 31 months after herbicide application.
Download MS Word (51.5 KB)Acknowledgements
We express our gratitude to the funding organisations, to the nine dairy farmers who hosted the experiment on their farms (David Rose, Nathan Page, John Freeman, Greg Fellowes, Graham Ball, Wayne Langford, David Rosser, Jeremy Savage, John Nalder), and to Catherine Law, Ken Wright and Randall Milne for organising field days in Taranaki, Tasman and Southland, respectively. We also thank Tracey Nelson (AgResearch) for producing the experimental bioherbicide, Mike Trolove (AgResearch) for applying the herbicides and assisting with data collection, and Dave Saville, Saville Statistical Consulting Ltd., for the experimental design and assistance in the field. We acknowledge Sue Brown, Project Manager, for her unfailing commitment, and the two reviewers for their helpful comments on the manuscript.
Disclosure statement
No potential conflict of interest was reported by the authors.
Additional information
Funding
Related Research Data
References
- Andreev NG, Gamidov ZZ. 1985. Methods of increasing yield of meadows in Dagestan. Kormoproizvodstvo. 1:25–26.
- Babenko SG. 1991. Improvement of flood-plain hayfields. Kormovye Kul'tury. 5:15–18.
- Bates D, Maechler M, Bolker B, Walker S. 2015. Fitting linear mixed-effects models using lme4. Journal of Statistical Software. 67:1–48. doi:10.18637/jss.v067.i01.
- Bourdôt GW, Baird D, Hurrell GA, de Jong MD. 2006. Safety zones for a Sclerotinia sclerotiorum-based mycoherbicide: accounting for regional and yearly variation in climate. Biocontrol Science and Technology. 16:345–358. doi: 10.1080/09583150500531966
- Bourdôt GW, Hurrell GA, Saville DJ. 1990. Variation in MCPA-resistance in Ranunculus acris L. subsp. acris and its correlation with historical exposure to MCPA. Weed Research. 30:449–457. doi: 10.1111/j.1365-3180.1990.tb01733.x
- Bourdôt GW, Lamoureaux SL, Watt MS, Kriticos DJ. 2013. The potential global distribution of tall buttercup (Ranunculus acris subsp. acris); Opposing effects of irrigation and climate change. Weed Science. 61:230–238. doi: 10.1614/WS-D-12-00106.1
- Bourdôt GW, Saville DJ. 2010. Giant buttercup - a threat to sustainable dairy farming in New Zealand. In: Bryant R, editor. Australasian dairy science symposium 2010 – meeting the challenges for pasture-based dairying. Lincoln: Lincoln University, NZ Animal Production Society; Vol. 2010; p. 355–359.
- Bourdôt GW, Saville DJ, Crone D. 2003. Dairy production revenue losses in New Zealand due to giant buttercup (Ranunculus acris). New Zealand Journal of Agricultural Research. 46:295–303. doi:10.1080/00288233.2003.9513557.
- Brown W 1993. The ecology of giant buttercup in Golden Bay dairy pasture [Unpublished Master of Applied Science thesis]. Canterbury, New Zealand: Lincoln University, 127 p.
- Buchgraber K, Sobotik M. 1995. Influence of grassland management on species diversity in various plant communities. Landwirtschaft und Naturschutz Gemeinsam erhalten fur die Zukunft. Expertentagung am. 19:9–23.
- Chapman DF, Lee JM, Rossi L, Edwards GR, Pinxterhuis JB, Minnee EMK. 2017. White clover: the forgotten component of high-producing pastures? Animal Production Science. 57:1269–1276. doi: 10.1071/AN16453
- Coles SM. 1971. The Ranunculus acris L. complex in Europe. Watsonia. 8:237–261.
- Connor HE. 1977. The poisonous plants in New Zealand. Wellington: DSIR, Government Printer.
- Delpech R. 1976. The effect of fertilization and management techniques on the evolution of the weed flora in permanent pasture. Comptes Rendus du Ve Colloque International sur l'Ecologie et la Biologie des Mauvaises Herbes, Dijon. 203–213.
- Enriquez-Hidalgo D, Gilliland T, Hennessy D. 2015. Herbage and nitrogen yields, fixation and transfer by white clover to companion grasses in grazed swards under different rates of nitrogen fertilization. Grass and Forage Science. 71: 559–574. doi: 10.1111/gfs.12201
- Ford MA. 1996. The transformation of surplus farmland into semi-natural habitat I. Effect of seed supply on the conservation value of Scottish set-aside exemplified by the vegetation at a site near Elgin. Aspects of Applied Biology. 44:179–184.
- Hardwick S, Close RC, Field FJ. 1993. Evaluation of a potential mycoherbicide for control of Ranunculus acris, giant buttercup. New Zealand Plant Protection. 46:270–273.
- Harper JL. 1957. Biological flora of the British Isles: Ranunculus acris L., R. repens L., R bulbosus L. Journal of Ecology. 45:289–342. doi: 10.2307/2257092
- Harper JL, Sagar GR. 1953. Buttercups, some aspects of the ecology of buttercups in permanent grassland. 1st British weed control conference. p. 256–263
- Hellstrom K, Huhta AP, Rautio P, Tuomi J, Oksanen J, Laine K. 2003. Use of sheep grazing in the restoration of semi-natural meadows in northern Finland. Applied Vegetation Science. 6:45–52. doi:10.1111/j.1654-109X.2003.tb00563.x.
- Houliston GJ, Goeke DF, Smith LA, Fowler SV. 2015. The genetic variation in giant buttercup in New Zealand pastures. New Zealand Plant Protection. 68:112–117.
- Hrazdira Z. 1970. Recultivation of grass stands with a Rotaseeder. Sbornik Vysoke Skoly Zemedelske. 47–54.
- Hrazdira Z. 1975. Efficacy of selective herbicides in weed infested meadow swards. Rostlinna Vyroba. 21:1337–1343.
- Kay J, Edwards P, Clement A, Bryant R. 2018. The effect of pregraze mowing at different pregraze masses on cow and pasture performance. Sustainable meat and milk production from grasslands. Proceedings of the 27th General Meeting of the European Grassland Federation. Pp. (Accepted for publication in June 2018).
- Lackovic A. 1974. The influence of growth herbicides upon natural grass stand productive ability. 12th International Grassland Congress. p. 304–309.
- Lamoureaux S, Bourdôt GW. 2007. A review of the ecology and management of Ranunculus acris L. in pasture. Weed Research. 47:461–471. doi: 10.1111/j.1365-3180.2007.00588.x
- Leskosek M. 1996. Can we prevent the invasion of weeds in intensively used meadows? Novi izzivi v Poljedelstvu. Zbornik simpozija, Ljubljana, Slovenia, 9–10 decembra 1996. p. 329–336.
- Melnikov N, Pilishvili V, Kuznetsov V. 1975. Response of herbage species to fertilizers on peat-bog soils. Trudy, Vsesoyuznyi Sel'skokhozyaistvennyi Institut Zaochnogo Obrazovaniya. 106:87.
- R Core Team. 2017. R: A language and environment for statistical computing. [accessed December 1] https://www.R-project.org/.
- Saunders J, Bourdot G, Greer G, Saunders C, James T, Watt M, Monge J. 2017. The economic costs to New Zealand of weeds on productive lands. International Journal of Agricultural Sustainability doi:10.1080/14735903.14732017.11334179.
- Saurina NA 1972. Dynamics in plant populations and in the age spectrum in some field associations of Ranunculus acris L. and R. auricomus L. Byulleten’ Moskovskogo Obshchestva Ispytatelei Prirody (Otdel Biologicheskii). 77:115–120.
- Thorvaldsson G. 1996. Botanical composition of Icelandic grass fields. Acta Agriculturae Scandinavica. Section B, Soil and Plant Science. 46:121–127.
- Tzialla CE, Papakosta D, Veresoglou DS. 2002. Effects of liming and N addition on vegetation productivity and species composition in three management systems. Multi function grasslands: quality forages, animal products and landscapes. In: Durand JL, Emile JC, Huyghe C, Lemaire G, editors. Proceedings of the 19th General Meeting of the European Grassland Federation; La Rochelle, France.
- Verkaaik ML, Hurrell GA, Bourdôt GW, Saville DJ. 2004. Evaluation of Sclerotinia sclerotiorum for giant buttercup control in dairy pastures. New Zealand Plant Protection. 57:286–291.
- Vidme T. 1973. Chemical weed control in grassland. Forskning og Forsoek i Landbruket. 24:127–157.
- Webb CJ, Sykes WR, Garnock-Jones PJ. 1988. Flora of New Zealand - volume IV - naturalised pteridophytes, gymnosperms, dicotyledons. Christchurch: Botany Division, Department of Scientific and Industrial Research.
- Young S. 2012. New Zealand Novachem Agrichemical Manual. Christchurch: Agrimedia Ltd. 724 ed. Vol. 2012.