
 ?Mathematical formulae have been encoded as MathML and are displayed in this HTML version using MathJax in order to improve their display. Uncheck the box to turn MathJax off. This feature requires Javascript. Click on a formula to zoom.
ABSTRACT
To quantify plant growth rates, responses to fertiliser and population responses to timing of grubbing (manual removal of plants) in a grassland population of Nassella trichotoma, three experiments were conducted. In Experiment 1, plant diameter growth, measured on 25 farms for up to 6 years, was unaffected by fertiliser and averaged 24 mm year−1, enabling a rapid increase in seed output. In Experiment 2, autumn and spring grubbing, compared on six 5-ha plots on four farms over six years, gave reductions in population size of 71% and 83%, respectively. In Experiment 3, effects of time of grubbing and pasture disturbance in spring/summer on recruitment were measured and combined with published demographic process rates in a simple population model. The model predicts population stability when 33.75% of plants are removed (the current mean grubbing rate) before mid-November with 3% pasture disturbance, and also for later grubbing with higher grubbing rate or lower pasture disturbance.
Introduction
Nassella trichotoma (Nees) Hack. ex Arechav. began invading indigenous tussock grasslands in the eastern parts of the Marlborough and Canterbury regions of New Zealand following their modification for pastoral farming by the early colonists in the mid-nineteenth century (Healy Citation1945). Renovation of these deteriorated grasslands through fertiliser applications and the sowing of improved pasture grasses and legumes in the mid-twentieth century, funded by central government (Leonard Citation1956), and the manual removal of re-invading N. trichotoma plants by ‘grubbing’ (Dingwall Citation1962), has resulted in population densities that no longer reduce the live-weight gains of sheep and other farmed grazing animals (Bourdôt et al. Citation1992). At these low densities, the model of Denne (Citation1988) predicted that the benefit to New Zealand was maximised by ongoing grubbing of the weed in regional-scale programmes at a frequency of once in three years. Conversely, using a new population model, based on a more comprehensive understanding of the demographic processes in N. trichotoma provided by recent experiments in grasslands at six sites in Canterbury (Lamoureaux et al. Citation2011), the net benefit to the region was predicted to be greater with annual grubbing than with three-yearly grubbing (Lamoureaux et al. Citation2015). The sensitivity of these regional-scale bio-economic analyses to the parameter values used in their underlying plant population models, and their representativeness of the geographic domain of the model, emphasises a need for robust parameter estimates.
The new population model accommodates spring and autumn grubbing and assumes grubbed plants leave no offspring (Lamoureaux et al. Citation2015). While providing a sound basis for comparing the costs and benefits of a single grubbing in spring and or autumn, the model does not enable evaluation of the within-season timing of grubbing. The time when grubbing occurs during the spring/early summer, the reproductive period, is likely to influence seed formation (Lamoureaux and Bourdôt Citation2002) and hence recruitment from grubbed plants.
Here we present the results of three experiments. They were conducted in dry-land sheep/beef pasture over a seven-year period on hills in Hurunui District of North Canterbury, New Zealand. The aim was to improve our understanding of the population dynamics of N. trichotoma. To this end the experiments (1) determined the rate of growth in plant size across many sites with and without added fertiliser, (2) compared the effects of autumn and spring grubbing on population size and (3) quantified the effects of time of grubbing in the spring/early summer on recruitment in intact and disturbed grassland across many sites. In addition, we use the results from (3), along with published demographic data (including plant-size-dependent probabilities of being grubbed), to develop a population model that accounts for time of grubbing, proportion of plants grubbed and amount of sward disturbance.
Methodology
Experiment 1 – plant growth
The experiment was established in early spring (late September/early October) on 27 sheep/beef farms in the Hurunui District of North Canterbury; 10, 9 and 8 farms in 2007, 2008 and 2009, respectively. The sites were selected by a ‘Project Team’ (of farmers, biosecurity officers and scientists) based on suitability for N. trichotoma, availability of plants and farmer willingness to participate, and occupied some of the most heavily infested farms in the district (Bourdôt and Saville Citation2016). On each farm, 10 pairs of similar-size N. trichotoma plants, each plant about 25 mm basal diameter, were marked with pegs (two per plant). One of each pair was fertilised initially and every second subsequent year with 150 kg ha−1 of Ravensdown Sulphur Super 15 (N 0.0%; P 8.6%; K 0.0%; S 14.8%; Mg 0.0%; Ca 19.2% w/w) applied to the 1 square metre around the plant. The design was a randomised complete block with 10 replicates. Annually, the basal diameter was measured (mean of two measurements made at right angles to each other at ground level using a caliper or a tape measure for plants too large for the caliper) in September or October for up to 6 years and each plant was photographed.
To test for a fertiliser effect, the variable ‘mean annual change in plant diameter’ (based upon initial and last available measurements) was statistically analysed using analysis of variance (ANOVA) for each of the 25 farms for which data were available for two or more September/October assessments. Also, an overall nested ANOVA was performed for this variable for each of the three groups of farms, with farms as main-plots, blocks as sub-plots and plots (and fertiliser treatments) as sub-sub-plots. For the farms with experiments set up in 2007, there was complete data for this purpose over 5 years on 7 out of the 10 farms, so this subgroup of farms and years was used in the ANOVA. For 2008 experiments, 3 years of data were used from 6 of the 9 farms, and for 2009 experiments 2 years of data were used from 6 of the 8 farms.
Also, for each group of farms, a mean pattern of growth was estimated by calculating the mean diameter for each year and farm as an average over all plots with complete data, and by inputting these means into a randomised block ANOVA with ‘x’ farms and ‘y’ years, with a ‘missing value’ code inserted for years without data. Here ‘x’ was 10, 7 and 8 farms for the 2007, 2008 and 2009 experiments, respectively, with two of the 2008 experiments being destroyed during their first year. Years ‘y’ were 6, 5 and 4 years, respectively, with the final data collection being in October 2013.
To derive a smoothed overall mean growth rate, the mean diameter (calculated as described above) was plotted against year for each of the 25 sites that survived for at least one year, the plot centred on the origin for each farm, and linear and quadratic regressions fitted through the combined centred data set. These analyses used all data from all years and sites. Before plotting, the resulting (quadratic) regression was moved to the point specified by the overall means for (y) diameter and (x) year.
The effect of soil fertility on N. trichotoma growth rate was investigated using seven analyses of covariance (ANCOVA). The ‘treatments’ were years of establishment. The dependent variable was ‘change in diameter averaged over the unfertilised plots on each farm during the first year of the experiment’. The first of two covariates was always the ‘mean initial diameter for the unfertilised plots on each farm’. The second covariate was the initial soil pH in the first ANCOVA and one of Olsen-P, SO4-S, K, Ca, Mg and Na in successive ANCOVAs.
Experiment 2 – autumn versus spring grubbing
The experiment was established on four farms in autumn 2008. On each farm, a 30 ha block was divided into six 5 ha ‘plots’ with three plots randomly allocated to each of two experimental treatments: ‘grubbing in autumn’ and ‘grubbing in spring’. The blocks supported an initial N. trichotoma population averaging 278 plants ha−1. Under the Canterbury Regional Pest Management Strategy, annual ‘compliance inspections’ are carried out by Environment Canterbury Biosecurity Officers following grubbing work due to be completed by 31 October each year. To compare the efficacies of the treatments in terms of passing these inspections, the plan was to assess each of the 24 plots in November each year (after both ‘autumn’ and ‘spring’ grubbing treatments had been applied for that year). To this end, N. trichotoma plants were counted along randomly positioned transects using a method described previously (Bourdôt and Saville Citation2016). The counting was done by one or both of the same two Biosecurity Officers on four occasions: initially (before any treatments were applied) and after 1, 2 and 6 years of grubbing (the latter at the conclusion of the experiment in late spring 2013). Unfortunately, the counts were not done after 3, 4 and 5 years. Statistical analysis was performed using ANOVA with model terms ‘farm’ and ‘season of grubbing’ (autumn versus spring). The initial estimated densities of N. trichotoma plants varied considerably between plots on the same farm (by >10-fold on one farm), so density estimates after years 0, 1, 2 and 6 were logarithm transformed prior to analysis, as was the final (year 6) density expressed as a percentage of the initial density.
Experiment 3 – time of spring/summer grubbing
The experiment was established early spring (late September/early October) in the Hurunui District of North Canterbury on the same 27 sheep/beef farms (with one exception) as used for Experiment 1. The idea was to simulate the effect of grubbing (uprooting and leaving the plant on the ground) an N. trichotoma plant at various times in the spring/summer reproductive period. This was achieved by grubbing and securing plants (flat on the ground) with staples (to prevent them blowing away, ensuring any seeds fell onto the plot) on un-infested plots at six equally spaced times, on both undisturbed and disturbed (described below) pasture plots. To this end, 12 N. trichotoma plants, each about 60 mm in basal diameter, were marked with pegs numbered 1–12 (). Six areas (at least 20 m × 6 m) were located nearby to accommodate six groups of four un-infested 1 m × 1 m plots (one group for each of six different times of grubbing). The 24 plots were each at least 5 m from their neighbours, and were marked using three numbered wooden pegs. All N. trichotoma plants in the vicinity of the plots were grubbed and, for the duration of the experiment, the farmer was asked to remove additional plants that occurred outside the 1 m × 1 m plots.
Table 1. An example of the random layout for one of the 27 sites in the ‘time of grubbing’ study, Experiment 3.
The treatments imposed on each group of four plots () were the (simulated) grubbing of an N. trichotoma plant, or not, in combination with disturbance of pasture, or not. This was achieved by the farmer grubbing one of the twelve 60-mm basal diameter plants and securing it (with 1–4 steel staples) on its allocated plot, or not, in a 2 × 2 factorial combination with prior ‘disturbance’ (described below), or ‘no disturbance’. The times of grubbing (1–6: September 30, October 14, October 28, November 11, November 25 and December 9, respectively) were randomly assigned to the six groups of four plots. These dates were used in the first two years, while all dates were moved five days later in the third year.
In the first and second years, the disturbance involved destroying the vegetation by thoroughly cultivating the soil using a grubber (a lightweight adze hoe). For the third year of establishment, the surface vegetation was chipped off with the grubber but without cultivating the soil.
Each cooperating farmer was trained by setting up the four plots (as above) for the first grubbing time (e.g. plots 17–20 in ) under the supervision of a scientist during a half-day visit to the farm by the two scientists (authors) and a biosecurity officer (during which a suitable site was found, Experiment 1 was set up, and Experiment 3 was organised). For reference, each farmer was left with a loose-leaf folder containing detailed instructions, the randomisation for their farm, and recording sheets.
Data collection, maintenance and validation
The farmer was asked to record (on a sheet provided) the actual date on which he/she established each group of four plots. Also, for each N. trichotoma plant grubbed and stapled down, he/she was asked to estimate and record the reproductive development [panicle development] stage of the plant (‘not emerged from sheath’, ‘beginning to emerge; green’, ‘emerged but not extended above leaves; green’, ‘extended above the leaves; purple’ and ‘fully extended, drooping to ground; straw coloured’), the amount of seed on it (none, little, medium, lots), and, from the disturbed plots, the soil moisture (dry, damp, wet). The ‘green’, ‘purple’ and ‘straw coloured’ refer to the colour of the glumes on a panicle’s spikelets.
In May of each year, the N. trichotoma plants in each quarter of each 1 m × 1 m plot were counted (by the farmer or a Project Team member) using a 0.5 m × 0.5 m quadrat. Nine of the 27 sites had to be completely abandoned. Two, three and five sites established in 2007, 2008 and 2009 ran full term until June 2014 (6.5, 5.5 and 4.5 years, respectively). At the other 8 sites, worthwhile data were obtained for 2.5–5.5 (average 3.9) years, but the experiment was terminated early for various reasons. For each of the 18 sites, there was a complete series of May counts for each plot until the date of termination (a maximum of seven May counts); here we report upon the final May count at each site.
The experiment, superficially, consisted of a single replicate at each of 18 sites (‘blocks’) of a split-plot design, with 6 grubbing times as main-plot treatments and a 2 (N. trichotoma plant grubbed, or not) × 2 (disturbance, or not) factorial as sub-plot treatments. However, the treatment ‘no N. trichotoma, no disturbance’ was identical between the 6 grubbing time treatments, so this invalidated statistical analysis using this design. Therefore, instead, the variable ‘the effect of securing a grubbed N. trichotoma plant on the plot’ was calculated as the difference in final May count between the ‘N. trichotoma’ and ‘no N. trichotoma’ (control) plots for each pair of ‘disturbed’ and ‘undisturbed’ plots for each grubbing time. With this new variable, the design was 18 sites (‘blocks’) of a split-plot design, with 6 grubbing times as main-plot treatments and soil disturbance (or not) as 2 sub-plot treatments.
Statistical analysis by way of a split-plot ANOVA was inappropriate owing to the large number of zeroes in the data. The time of grubbing with the least zeroes will be seen in the Results to be 11 December; for this time, all counts were square-root transformed, then the above ‘effect of stapling down a grubbed N. trichotoma plant (Tussock–Control)’ was calculated for both disturbed and undisturbed pairs of plots at each site. The resulting paired difference between disturbed and undisturbed was calculated for each site, and these 18 differences input into a paired samples t test to check for a difference in recruitment rate between disturbed and undisturbed. Also, for disturbed plots only, the effect of grubbing on 11 December was statistically compared to grubbing on 27 November using the same methodology.
Results
Experiment 1 – plant growth
The average of the initial soil test values for the 25 farm sites that survived beyond the first year are pH = 5.64, Olsen-P = 13, SO4-S = 4.2, K = 15, Ca = 8, Mg = 40 and Na = 5.
The plant growth data for the 25 farm sites that survived beyond the first year are in . For the 10 ‘2007’ farms, the average rate of growth in basal diameter over 6 years was 27.3 mm per annum (a). For the 7 ‘2008’ farms the average growth rate over 5 years was 21.9 mm per annum (b). For the 8 ‘2009’ farms the average growth rate over 4 years was 25.7 mm per annum (c).
Figure 1. Increase in basal diameter of the Nassella trichotoma plants in Experiment 1 averaged over fertiliser (none and some) on the 25 farms for which useful data were obtained (for varying numbers of years) following establishment of the experiment on (A) 10 farms in 2007, (B) 7 in 2008 and (C) 8 in 2009. The overall mean pattern ‘MeanAll’ is given in (D) along with the 2007, 2008 and 2009 means.
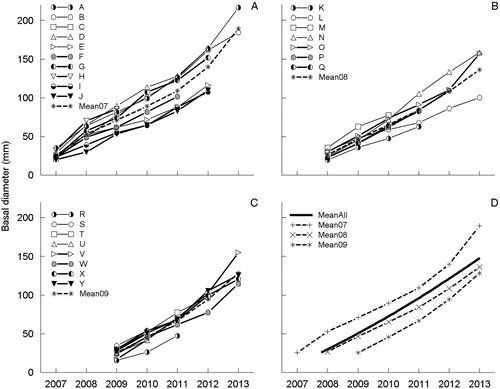
In d, the ‘mean curves’ show the average patterns of increase in basal diameter. In all three year-of-establishment groups, upwards curvature is apparent. This suggests that the rate of growth may be increasing with increasing age of plant. However, the curvature may also be a reflection of the last two seasons being very conducive to plant growth. The linear component of the fitted quadratic curve was strongly statistically significant (p < .001) (F1,116 = 1722.73). The orthogonal quadratic curvature component was 5% significant (F1,116 = 4.98). The equation of the ‘overall’ fitted curve in d iswhere y = plant diameter (mm), x = year and 2009.924 is the mean x value.
At ‘year = 2007.79’, the fitted diameter on this curve is 26.03 mm, which closely matches the mean of the initial diameters over the three groups of farms. Six years later, at ‘year = 2013.79’, the fitted diameter is 170.24 mm. Hence the average rate of increase in basal diameter over six years (the maximum period for which data were collected) was estimated as (170.24 – 26.03) /6 = 24.0 mm per annum ().
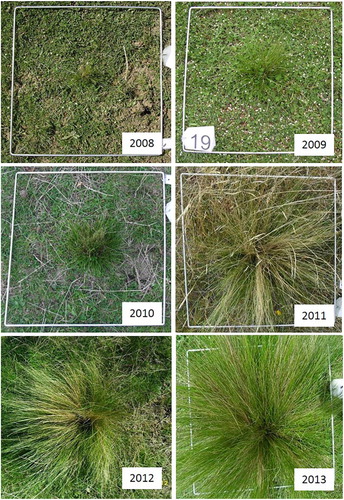
Figure 2. Images of a particular N. trichotoma plant (#19, Farm O) in Experiment 1 recorded in Sep/Oct 2008, 2009, 2010, 2011, 2012 and 2013 with basal diameters of 30, 51, 70, 91, 121 and 155 mm, respectively (average growth rate = 25.0 mm year−1). Quadrat shown in images is 0.5 m × 0.5 m.
The response to fertiliser was not statistically significant for 23 out of the 25 sites when the annual change in diameter was statistically analysed for each site separately; by comparison, if the responses were truly zero at all sites, we would expect false significances for 25 × 0.05 = 1.25 sites. Fertiliser responses were negative for 17 sites (with two of these responses being significant at p < .05) and positive for 8 sites, though the (binomial) proportion of negatives was not significantly different to 0.5.
For the combined analyses, the 95% confidence interval (CI) for the true annual response in diameter to fertiliser over 5 years on 7 farms for the 2007 group was −0.7 ± 1.5 mm p.a. The annual fertiliser response over 3 years on 6 farms for the 2008 group was −1.6 ± 1.8 mm p.a., and over 2 years on 6 farms for the 2009 group was −0.5 ± 2.3 mm p.a. Since all three CIs contain zero, there was no significant fertiliser effect for any of the three establishment-year groups.
The mean N. trichotoma growth rate on the unfertilised plots in the first year of the study at each site, after adjustment for its correlation with mean initial diameter, was positively correlated with the initial soil fertility variables Olsen-P and SO4-S in respective analyses of covariance (which adjusted for year effects). The common slopes of the relationships between the unfertilised plant growth rates and Olsen-P and SO4-S, respectively (after adjustment for initial plant size) were 0.24 (SE 0.103) and 0.96 (SE 0.380), with p < .05 in both cases.
Experiment 2 – autumn versus spring grubbing
Over the six-year period, grubbing reduced the population size of N. trichotoma by at least 49% on all 24 plots. On average, spring grubbing reduced population size by 83%, which was significantly higher than the 71% reduction achieved with autumn grubbing ().
Table 2. Average over the four sites of the number of N. trichotoma plants ha− 1 initially and after 1, 2 and 6 years of grubbing in the autumn or spring (based upon simultaneous assessments of all plots in the late spring), and the density after 6 complete years of experimental work expressed as a percentage of the initial N. trichotoma plant density (Experiment 2).
With some of the autumn-grubbed plots, additional grubbing was done in the spring if it became apparent that the plot would not pass an Environment Canterbury grubbing compliance inspection by the deadline of 31 October. Similarly, some of the spring-grubbed plots were grubbed a second time (before 31 October) if they had not been grubbed adequately the first time (though this was less frequent).
When the total time spent grubbing each plot was calculated and statistically analysed, slightly less time was spent on the autumn grubbing plots (6% fewer hours) than on the spring grubbing plots (), in spite of the fact that more of the autumn grubbed plots required an extra grubbing (in the spring) than did the spring grubbed plots.
Experiment 3 – time of spring/summer grubbing
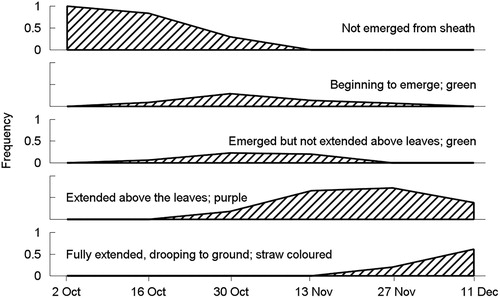
Diameters of the N. trichotoma plants that were selected for stapling to the experimental plots averaged 59.6 mm. Plants of this size have a nearly 100% chance of seeding (Lamoureaux et al. Citation2011). This was confirmed by the information on the amount of seed on the grubbed plants recorded on the sheets returned by 22 of the 27 participating farmers. This revealed that all 44 (=22 × 2) plants stapled at each of the 5th and 6th times of grubbing contained seeds. At the earlier times of grubbing (times 1 to 4), 0, 3, 28 and 42, respectively, of the 44 plants contained seeds. In addition, the phenology of panicle development, based on additional observations by the farmers, is presented in . Together, these observations confirm that the experimental period encompassed the reproductive phase of the N. trichotoma plants from before panicle emergence to senescence and seed maturation.
Figure 3. Phenology of panicle development in the Nassella trichotoma plants grubbed and secured to the plots in Experiment 3. Plotted are the proportions of 44 plants (2 from each of 22 farms) at each panicle development stage at each of the six times of grubbing.
The final, and most recent reliable number of N. trichotoma plants counted on each of the 24 plots on the 18 ‘reliable’ farms varied between the treatments (). From the consecutive May counts (data not presented), it was evident that plants occasionally disappeared on some cattle-grazed sites, but rarely on sheep-grazed sites (the majority of sites). On some plots, ‘death by merger’ occurred when several recruits coalesced. On average, these data represent the number of recruits 4.6 years after grubbing the N. trichotoma plant. Since they were obtained by close examination of the four quarters of each 1 m2 plot, they provide estimates of ‘all plants’ (except very small plants) in the population as compared to estimates of those that are visible to a walking observer as in Experiment 2.
Table 3. Nassella trichotoma plant recruits (final May counts on 18 farm sites) on 1 m− 2 plots (disturbed [ D ] or intact [ I ]) with [+] and without [−] an in situ grubbed N. trichotoma plant (N.t) following grubbing at the specified date during the springs of 2007, 2008 and 2009 in Experiment 3.
If the experiment had run for another 10 years, then presumably many more of the plants on each plot would have coalesced, which illustrates the time-dependent nature of these data. On the other hand, in real life, the seed from a grubbed N. trichotoma plant would probably be scattered rather than tightly bound to such a small area such as our plots, so recruits would be less likely to coalesce. This would suggest that the maximum number of recruits, rather than the final number, may also have been appropriate for our analysis.
The estimated effect of grubbing an N. trichotoma plant at various dates during its reproductive development on the number of recruits, averaged over the 18 sites, is shown in .
Figure 4. The net effect on recruitment of Nassella trichotoma (N.t) of grubbing a plant at various times during its reproductive development and leaving it in situ in either an intact (O) or disturbed (▴) pasture sward (Experiment 3). For each grubbing date, and for intact and disturbed pasture, this was estimated by subtracting the corresponding background ‘control’ level of recruitment (−N.t) from each +N.t value in the last column of . These net effects are given in the figure and referred to in the text of this paper as RI and RD for intact and disturbed pastures, respectively. These are plotted against the average of the dates of grubbing at the 2007, 2008 and 2009 sites (=2 days added to the 2007 and 2008 dates): 2, 16 and 30 October, 13 and 27 November and 11 December.
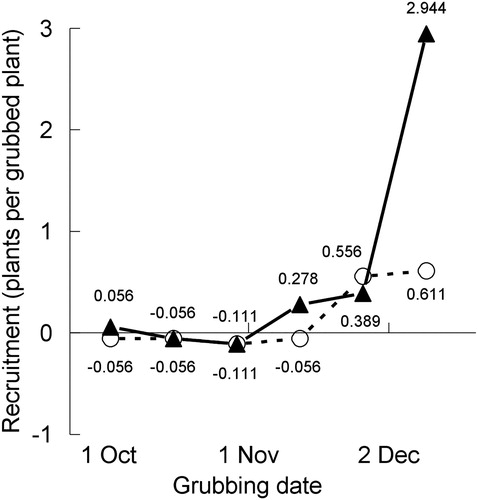
It is evident that recruitment did not occur from plants grubbed at the first three times (up until late October). By contrast, plants grubbed at the last two times (late November and, especially, early-mid December) gave rise to recruits. In early-mid December, significantly more recruits occurred when the recipient pasture had been disturbed prior to the deposition of the grubbed plant than when it was intact (p < .01) (). It is also evident that grubbed plants were never completely replaced by new recruits in intact pastures, regardless of grubbing date. By contrast, in the disturbed pasture, plants grubbed in early-mid December were each replaced by about three new recruits (), and this recruitment rate was higher than that for plants grubbed in late November, although the statistical evidence for this difference was weak (p < .10).
Population model
To enable the population growth consequences of different dates of spring/summer grubbing and different grubbing (kill) rates to be determined, it is necessary to account also for recruitment from seeds formed on non-grubbed escapees and from the soil seed bank. To that end, we develop a population model (below) which accounts also for variability among plant size classes in the probabilities of being grubbed (Verkaaik et al. Citation2006) and of forming seeds (Lamoureaux et al. Citation2011), as summarised in .
Table 4. Probabilities of Nassella trichotoma plants of different basal diameters being grubbed or not, and probabilities of non-grubbed escapees of different basal diameters forming seeds as used, along with data on seedling recruitment from the grubbed plants in Experiment 3, in the population growth model (Equations (1)–(9)).
The experimental data are the number of N. trichotoma plants that are likely, on average, to replace a grubbed plant in a pasture (). That is, our experimental data come from grubbing a plant on just one occasion. In the model described below, however, we are thinking of N. trichotoma plants being grubbed annually at the same specified date, with the same grubbing rate (g) and the same level of pasture disturbance (d). Hence we are modelling the long-term consequences of such a strategy and assume that cohorts of recruits are generated by such annual grubbings, with our experiment providing data for each annual grubbing and each disturbance event.
In the model, we used published size classes (Lamoureaux et al. Citation2015), except that we split the S (small) class into two (using their raw data) and combine the two largest classes (M and L, medium and large) to allow more accurate modelling. Thus our size classes are Imm for immature plants with basal diameter in the range [0, 10 mm), VS for very small [10, 20 mm), S1 for [20, 40 mm), S2 for [40, 60 mm) and M + L for plants with basal diameter ≥60 mm, using standard mathematical convention for intervals (‘[’means include the number in the interval and ‘)’ means exclude).
We assume an initial population size in early spring (e.g. 1 September) of nTotal, and multiply by the estimated proportions in each size class (pImm
, pVS, pS1, pS2 and pM + L) as given in the third column of , to estimate the numbers in each size class: nImm, nVS, nS1, nS2 and nM + L. Hence the initial population size is:For an overall proportion grubbed of 0.3375, the sixth column of gives us the estimated proportion grubbed in each size class: gImm, gVS, gS1, gS2 and gM + L. For example, gImm = 0.1635. More generally, if the overall grubbing rate is gTotal, we scale up each of these proportions by the ratio (gTotal/0.3375). Hence, for example, we estimate the number of immature plants grubbed as
which equals nTotal × 0.1408 × 0.1635 × (gTotal/0.3375). Hence if the initial N. trichotoma population size is nTotal = 1000 plants and the overall proportion grubbed is 0.17 (17%), the number of immature plants grubbed is estimated to be 1000 × 0.1408 × 0.1635 × (0.17/0.3375) = 11.6 plants.
To estimate the number of seeding plants (i.e. plants large enough to seed if not grubbed) grubbed in each size class, we multiply the number of grubbed plants in the size class by the appropriate proportion seeding in the last column of , denoted by fImm, fVS, fS1, fS2 and fM + L. For example, we estimate the number of immature seeding plants grubbed asTo estimate the number of seeding plants that are not grubbed in each size class, we multiply the number of not grubbed plants in the size class by the appropriate proportion seeding. For example, we estimate the number of immature seeding plants that are not grubbed as
By summing over the size classes, we obtain the total number of grubbed seeding N. trichotoma plants, n(grubbed, seeding)Total, and the total number of not-grubbed seeding N. trichotoma plants, n(notgrubbed, seeding)Total. The resulting sums (over the size classes, j) are
(1)
(1)
(2)
(2) At this point, we introduce the six times of grubbing (t), as listed in . First, we estimate the recruitment (plants ha−1) arising from grubbed plants large enough to seed whose seed (potentially) lands on intact pasture at time t as
(3)
(3) where the sum is over the size classes, j, and RIt is the rate of recruitment in plants/plant for grubbing time t as given in .
Similarly, we estimate the recruitment (plants ha−1) from grubbed plants large enough to seed whose seed (potentially) lands on disturbed pasture at time t as(4)
(4) where j = size class and RDt is the rate of recruitment in plants/plant for time t as given in .
For the not grubbed plants that are large enough to seed, we assume that their associated recruitment rates are those measured for the final time of grubbing, which are RI6 and RD6 (). Hence we estimate the recruitment (plants ha−1) arising from non-grubbed plants large enough to seed, whose seed lands on intact pasture as(5)
(5) where j = size class.
Similarly, we estimate the recruitment (plants ha−1) arising from non-grubbed plants large enough to seed, whose seed lands on disturbed pasture as(6)
(6) where j = size class.
Overall, the recruitment (plants ha−1) for intact pasture is the sum of Equations (3) and (5), and for disturbed pasture it is the sum of Equations (4) and (6).
The next step is to account for ‘background’ recruitment from the soil seed bank. In , the recruitment rates are the differences between the rate for a grubbed plant on intact or disturbed pasture and the rate on the corresponding control (the background level of recruitment from the soil seed bank). Hence for our model, we add in the background levels for intact and disturbed pastures.
From the intact pasture control plots (Treatment ‘–N.t, I’ in ), the average background level for intact pasture on the 18 farms used in the study is easy to estimate. The total area sampled was 6 (plots) × 18 (sites) = 108 m2, which was initially clear of N. trichotoma plants. Over the average study period of 4.6 years, 6 N. trichotoma plants (1 + 1 + 2 + 1 + 0 + 1) () were counted. Hence the annual number of new recruits of N. trichotoma plants, as a background level for intact pasture, can be estimated as 6 × (10,000/108)/4.6 = 121 N. trichotoma plants ha−1 year−1. With regard to the 4.6 divisor, there may have been plants too small to be detected (with just one or very few tillers, indistinguishable from another grass) on the plots at the start of the experiment, and conversely, there were plants too small to be detected at the end of the experiment, so these effects cancel and the appropriate period of time is 4.6 years. This background level of recruitment was derived from heavily infested sites, corresponding in our model to a particular initial population size (nTotal) which we need to estimate.
Ideally nTotal should be taken to be the average of the population sizes over the 18 experimental sites. Unfortunately, no such density measurements were taken. However, we know that the experimental sites were in the upper range of current N. trichotoma population densities since high-density sites were selected for Experiment 3. Also, we have initial population size estimates for the 24 plots in Experiment 2, although these were based upon transect counts, so may be expected to be lower than estimates based upon intensive searching of 1 m × 1 m plots. The three most heavily infested 5-ha plots in Experiment 2 were plots 1, 2 and 3, with estimated population sizes of 906, 1068 and 759 plants ha−1 respectively. We shall assume that these plots were similar in population density to our 18 experimental sites in Experiment 3. Their average estimated initial density was 911 N. trichotoma plants ha−1, and we round this up to a value of nTotal = 1000 plants ha−1 as a small adjustment for the fact that they were transect counts; this corresponds to one N. trichotoma plant per 10 m−2, which is not unreasonable for a densely infested north-facing slope.
We therefore assume that the estimated background level for intact pasture, of 121 N. trichotoma plants ha−1 year−1, applies to an initial population size (nTotal) of 1000 plants ha−1. And we shall further assume that for a more general initial population size, the background can be estimated proportionally, as 121 × nTotal/1000. Hence for intact pastures, we simply add this to our sum of Equations (3) and (5) and derive an estimated total recruitment of N. trichotoma plants ha−1 annum−1 for grubbing at time t of:(7)
(7) where j = size class.
For disturbed pastures, the concepts are more difficult. Presumably, any N. trichotoma plants on the experimental plots would have been killed by the total disturbance. Also, the time of disturbance (at the same time as each experimental grubbing) could reasonably be expected to affect the subsequent level of recruitment of N. trichotoma. However, there is little evidence of this in , so times of disturbance will be pooled for the purposes of our modelling. The question then arises: do we divide the recruitment level by 4.6 (years) or not? We decide not, on the grounds that the data in show the effect of only one disturbance event, as compared with annual disturbance events, each of which could be expected to give rise to another cohort of recruits. In our model, we assume a pasture with (e.g.) a 25% level of disturbance is the net result of many disturbance events, with pasture filling in gaps only to have fresh gaps taking their place (due to over-grazing, erosion due to heavy rain, and so on). That is, we view ‘disturbance’ as an ongoing, ‘active’ phenomenon, as compared with the ‘passive’ phenomenon of ‘intact pasture’. Now, for the disturbed pasture control plots, the total area sampled was 6 × 18 = 108 m2, and 24 N. trichotoma plants (3 + 4 + 6 + 3 + 4 + 4) () were counted on the 108 plots. Hence the annual number of new recruits of N. trichotoma plants, as a background level for disturbed pasture, can be estimated as 24 × (10,000/108) = 2222 N. trichotoma plants ha−1 per annum.
As above, this estimated background for disturbed pasture applies to an initial population size (nTotal) of 1000 plants ha−1. Hence for a more general initial population size, the background can be estimated proportionally, as 2222 × nTotal/1000. Hence for disturbed pastures, we simply add this to our sum of Equations (4) and (6) and derive an estimated total recruitment of N. trichotoma plants ha−1 year−1 for grubbing at time t of:(8)
(8) where j = size class.
Next, we estimate the total annual recruitment of N. trichotoma plants ha−1 year−1 for grubbing at time t by summing over the ‘intact’ and ‘disturbed’ parts of the pasture by calculating a weighted average of (7) and (8):(9)
(9)
In the above, d is the proportion of pasture disturbed at the time of spring grubbing, and we have estimated the resulting recruitment. Taking a longer-term view, we assume in our model that the pasture which is disturbed at this time will recover before the following spring, but that new areas will be freshly disturbed during the 12-month period following grubbing, again making up a proportion d of the pasture. Causes of this disturbance could be summer or autumn drought, winter grazing, an infestation of rabbits, over-grazing, erosion due to heavy rain, earthquakes, landslides or other causes.
In Experiment 3, disturbance means ‘complete destruction’ of the pasture sward, including any N. trichotoma plants, regardless of their size. Therefore in our model, we assume that any fresh disturbance, post grubbing, will kill a proportion d of the population, made up of initial plants, minus grubbed plants, plus new recruits as above. That is,(10)
(10) In summary,
(11)
(11)
In this model, we can set the parameters nTotal (initial population size), gTotal (proportion grubbed) and d (proportion of pasture disturbed), calculate total recruitment, subtract the number of plants killed by pasture disturbance and by grubbing, and divide by the initial population size to derive the rate of change of the number of N. trichotoma plants per plant.
Population model simulation
To explore the model, we set the initial total population of N. trichotoma plants to be nTotal = 1000 plants ha−1 as being representative of the density of the weed on our plots.
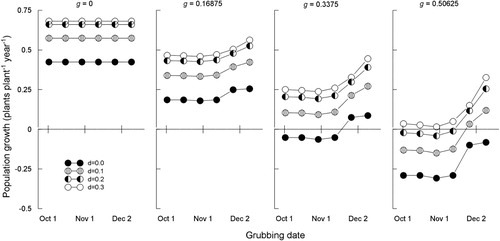
For each of the six times of grubbing, the grubbing rate was set at 0, 0.16875 (‘half normal’), 0.3375 (‘normal’ ()) and 0.50625 (1.5 times ‘normal’), and the proportion of disturbance in the pasture was set to 0, 0.1, 0.2 and 0.3.
At the nil (g = 0.0) and ‘half normal’ (g = 0.16875) rates of grubbing, the population of N. trichotoma plants increases even for undisturbed pasture (d = 0) (). For the ‘normal’ grubbing rate (g = 0.3375), population decrease occurs for undisturbed pasture (d = 0) for the first four times of grubbing only. Although not evident in , when g = 0.3375, a value of d = 0.03 results in a stable population for all grubbing times up to and including mid-November. For the ‘1.5 × normal’ grubbing rate (g = 0.50625), population decrease occurred for undisturbed pasture (d = 0) for all six times of grubbing, and for pastures with 10% or 20% disturbed ground (d = 0.1 or 0.2) for the first four times of grubbing only. In all other cases shown in , the population increased in size.
Figure 5. Relative growth rate of a Nassella trichotoma population in a pasture modelled as a function of: d, the proportion of the pasture area with disturbed soil; g, the proportion of plants in the population that are grubbed; t, date of grubbing in Experiment 3. See Equations (1)–(11).
Discussion
Experiment 1
The reason these growth rate experiments were conducted on such a large number of farms was to test the local farmer anecdote that N. trichotoma grows faster on their farms than on the experimental plots at four sites in the Weka Pass area of the Hurunui District, where the published growth rates for plant basal diameter averaged 12 mm per annum (Lamoureaux et al. Citation2011). The anecdote is supported by the experiment since the average growth rate (24 mm p.a.) over the 25 farms is double the previous estimate. Nevertheless, neither study established an unbiased average for all farms in the Hurunui District, since both were conducted on heavily infested sites. Since seed yield increases rapidly with plant diameter, the result indicates that the seed production of a population increases more rapidly than in the published population model (Lamoureaux et al. Citation2015). Presumably, this faster growth in plant size and resultant higher fecundity would increase population growth in the absence of grubbing. This would have the effect of increasing the estimated monetary benefit to the District of continuing with an annual grubbing programme that keeps the overall District meta-population at its current stable density (Bourdôt & Saville Citation2016). To confirm this hypothesis, the size class transition rates could be increased in the published model (Lamoureaux et al. Citation2015).
Overall, there was no effect of the fertiliser on the growth rate of the N. trichotoma. This lack of response could be a result of the soils generally being of medium fertility, apart from SO4-S which was at a low to medium level.
Experiment 2
In this experiment, spring grubbing was superior to autumn grubbing in terms of reducing N. trichotoma population density (83% reduction versus 71% reduction over the six years of the study). However, the 71% reduction achieved with autumn grubbing (with 6% less effort) was still a very satisfactory outcome. In years of summer or autumn drought, grubbing in the autumn is easier than in the spring since the N. trichotoma plants remain green throughout the drought and are highly visible; this increased visibility may be further enhanced by scheduling the grubbing of each field so that it follows the rotational grazing schedule.
The autumn grubbing (with a spring re-grubbing when required) and spring grubbing were both done prior to seeding in each of the six years of this experiment. The similar population density reduction from these two grubbing regimes suggests that seed production was reduced to a similar extent by both.
Spring, at the start of the annual season of growth, is a very busy time for farmers and grubbing contractors. Thus for farmers who prefer to do their own grubbing, autumn grubbing may fit in better with the annual farming cycle than spring grubbing. For grubbing contractors, spreading the workload over both autumn and spring would be advantageous compared to just in spring. With autumn grubbing, a follow-up grub may be needed in the spring, but if the bulk of the work has been done in the autumn, the workload will have been spread more evenly throughout the year.
Experiment 3
Despite the experiment’s complicated design, two-thirds (18/27) of farmers were successful in its implementation. Of the other nine farmers, two mistakenly set their plots up wrongly, two gave the job to a farm worker who set them up wrongly, one became busy with other work and did not complete the establishment, and four became disinterested. Nevertheless, the experiment was a success due to a high level of farmer interest overall and community involvement in obtaining funding. Its success is also a reflection of the goodwill built up between the parties (farmers with this special weed problem, regional council staff and scientists) through working together on N. trichotoma over the preceding 10–15 years.
In the model, we have accounted for the size structure of a typical N. trichotoma population and the effect of plant size on the probability of a plant being grubbed (for a given overall grubbing rate (efficacy)), as well as the probability of flowering and seed formation. These effects have been combined with those of pasture disturbance and time of spring grubbing as determined in the experiment to model the effect of the overall grubbing rate, time of grubbing (in the spring) and level of pasture disturbance on population growth.
The model is a simplification of a complex ecological system. There are four identifiable features of the real system that are not accounted for. First, plants in the model are simply divided into ‘seeding’ or not, with no account taken of the effect of their size on their seed output. As an aside, the N. trichotoma plants (of about 60 mm in basal diameter) grubbed at the last two spring grubbing dates and stapled down to the plots in Experiment 3 were all observed to produce seeds. Second, the effect of one year’s grubbing on the size structure in the following year is not accounted for. This means that the model is only applicable in the short term, i.e. in determining whether the population is increasing or decreasing under a particular combination of parameter settings. Third, to estimate the proportion of plants grubbed in each size class, we simply scale up the proportions according to the overall proportion grubbed. This means that the latter is restricted to be slightly less than 0.60, since otherwise the proportion grubbed exceeds 1.0 for the largest size class. Hence the model is restricted to the proportion of plants grubbed g = 0 to 0.5967. Fourth, with regard to disturbance, we use data from Experiment 3 where the pasture was ‘disturbed’ at the same time that the N. trichotoma plant was grubbed and stapled to the plot. But we are modelling a real-world scenario in which the disturbance may have occurred several months before the time of grubbing. This would not influence the direct effect of the disturbance of killing plants. But it may have led to over-estimation of the effect of disturbance on recruitment due to seed falling on ‘disturbed’ pasture, since if the disturbance had been months earlier, the bare ground may have partially filled in with new pasture, inhibiting recruitment. Conversely, disturbance at an earlier time would promote higher levels of background recruitment from seeds already in the soil seedbank, which would lead to the model under-estimating the effect of disturbance on recruitment.
Our experimental estimates of the background level of recruitment of 121 and 2222 plants ha−1 for intact and disturbed pastures, respectively, may seem high. However, they are derived from, and apply to north-facing slopes that are heavily infested with N. trichotoma, and therefore apply to the parts of farms where N. trichotoma is an ongoing problem. To put this in perspective, in Experiment 2 the most heavily infested 5-ha plots (1–3) had an average initial density of 911 N. trichotoma plants ha−1, and an estimated total of 1956 plants ha−1 were grubbed on these plots over the next six years (326 plants grubbed ha−1 per annum), which reduced the density down to an estimated 11.5% of its initial density. These values suggest a sizeable level of recruitment from background and other sources, since otherwise the density would have reduced more quickly.
In the model, we assume these background levels of recruitment apply when the initial population size is 1000 plants ha−1, and that lower or higher initial population sizes would correspond to proportionately lower or higher background levels of recruitment. Under these two assumptions, the relative growth rates of population size presented in are independent of initial population size. It is interesting to note, however, that if the experimental sites truly had a lower average population size such as 500 plants ha−1, or one plant per 20 m2 (meaning the constant of 1000 in Equations (7) and (8) is replaced by 500), then at a grubbing rate of 50.625% and no pasture disturbance, N. trichotoma populations decrease over time only if the grubbing is done by mid-November. At the normal grubbing rate of 33.75%, populations increase for all times of grubbing. This illustrates the dependence of the model on this assumption.
The modelled population growth rates () may be conservative because some recruits from the stapled plants may not have been counted; some seeds may have moved out of the 1.0 m2 sample area around the stapled plant and others may have been lost during the transfer of the plant to the sample area. Also, if establishment declines with seed density or there was early self-thinning or coalescence of seedlings, then that would also result in our recruitment counts being underestimates of the recruitment that would occur when the seeds are naturally more widely (we presume) scattered.
To summarise, the population model presented herein is primarily useful for determining whether a grassland population of N. trichotoma in North Canterbury would increase or decrease under hypothetical grubbing, disturbance and spring grubbing-time scenarios. It is not suitable for predicting future population sizes. With this in mind, the model reveals that population relative growth rates decline as pasture disturbance is reduced and as grubbing rate increases. For the scenarios ‘no grubbing’ or ‘16.875% of plants grubbed (half normal)’, the model suggests that N. trichotoma populations increase in size regardless of level of pasture disturbance and timing of spring grubbing (). At the current average grubbing rate achieved in practice, 33.75% of plants grubbed, N. trichotoma populations decrease slowly over time when the grubbing occurs in mid-November or earlier provided there is no pasture disturbance. When 10% or more of the pasture sward consists of bare ground at the time of grubbing, population increase occurs regardless of when the grubbing (of 33.75% of plants) occurs. Although not plotted, the model predicts a stable population when 33.75% of plants are grubbed and 3% pasture disturbance occurs so long as the grubbing is done by mid-November. This result aligns with the measured stability of the Hurunui district meta-population of N. trichotoma under the current annual grubbing programme (Bourdôt & Saville Citation2016) in which 33.75% of plants are grubbed annually (Verkaaik et al. Citation2006) before 31 October. At 1.5 times the current average grubbing rate (50.625% = 1.5 × 33.75% of plants grubbed), N. trichotoma populations decrease over time regardless of time of grubbing provided there is no pasture disturbance. However, if between 8% and 21% of the pasture is disturbed, populations decrease over time only if the grubbing occurs in mid-November or earlier.
It is evident that lower levels of pasture disturbance give the same result in terms of rate of change in N. trichotoma population size as higher levels of grubbing, and vice versa. For example, if a pasture is over-grazed, it will require a higher level of grubbing to give the same result as a pasture that is not over-grazed. Conversely, a well-managed pasture with little disturbed area during the reproductive phase of N. trichotoma can exhibit decline or stability in its N. trichotoma population regardless of time of grubbing in the spring if a grubbing rate of 50% is achieved.
Conclusions
Five overall conclusions may be drawn from this long-term study of the growth rates of N. trichotoma plants and the responses of N. trichotoma populations to grubbing at different timings in modified tussock grasslands. First, the estimated average increase in diameter of N. trichotoma plants, of 24 mm per plant per annum, is about double that previously reported. This has important implications for the modelling of the growth of this weed. Second, the lack of a growth response to 150 kg ha−1 of 15% Sulphur Super fertiliser, applied biennially, indicates that the application of this fertiliser will not promote the population growth of this weed. Third, correlations between measures of soil fertility and the weed’s growth rate explain some of the variation observed in growth rate within the Hurunui district. Fourth, while intense autumn grubbing was slightly less effective in reducing population size than intense spring grubbing, it may fit better into the farming calendar and thus be an equally good or superior strategy compared to spring grubbing. Fifth, our model reveals that under the current average grubbing rate of 33.75% in the Hurunui district, population growth will not occur so long as pasture disturbance is no greater than ca. 3% and the grubbing is completed by mid-November. At this time, the majority of panicles are extended above the leaves and the glumes are purple in colour. The model provides an ecological basis for setting a ‘cut-off’ date for the completion of spring-time grubbing of N. trichotoma in the Hurunui district of North Canterbury.
Acknowledgements
We thank the Project Team members for their input: Laurence Smith (Project Manager) and Leanne Lye (Financial Manager) of Environment Canterbury (ECan) at Amberley, David Hyde (Project Supervisor) for his many tireless hours of work, Stuart Gibb for suggesting an improvement to the design, Ross Little, John Ford and Kerry Prenter. We also thank Noel Crump of ECan Cheviot, and Lindsay Scott and latterly Matthew Smith of ECan Amberley, and the 28 farmers who gave their time to the experiment. We thank the two journal reviewers for helpful comments on the manuscript.
Disclosure statement
No potential conflict of interest was reported by the authors.
Additional information
Funding
References
- Bourdôt GW, Hurrell GA, Saville DJ. 1992. Eradication of nassella tussock (Nassella trichotoma), an unlikely outcome of grubbing. New Zeal J Agric Res. 35:245–252. doi: 10.1080/00288233.1992.10427501
- Bourdôt GW, Saville DJ. 2016. Nassella trichotoma in modified tussock grasslands in Canterbury, New Zealand; a case study in landscape-scale plant population monitoring. Weed Res. 56:395–406. doi: 10.1111/wre.12221
- Denne T. 1988. Economics of Nassella Tussock (Nassella trichotoma) control in New Zealand. Agric Ecosyst Environ. 20:259–278. doi: 10.1016/0167-8809(88)90163-6
- Dingwall AR. 1962. The weeds of Canterbury. 15th New Zealand Weed and Pest Control Conference; Caledonian Hall, Christchurch, New Zealand. p. 15–22.
- Healy AJ. 1945. Nassella tussock (Nassella trichotoma (Nees.) Hack.). Field studies and their agricultural significance. Wellington: Department of Scientific and Industrial Research.
- Lamoureaux SL, Basse B, Bourdôt GW, Saville DJ. 2015. Comparison of management strategies for controlling Nassella trichotoma in modified tussock grasslands in New Zealand; a spatial and economic analysis. Weed Res. 55:449–460. doi: 10.1111/wre.12158
- Lamoureaux S, Bourdôt GW. 2002. Fruit viability on grubbed Nassella trichotoma (Nees) tussocks. Aust J Exp Agric. 42:1057–1061. doi: 10.1071/EA02032
- Lamoureaux SL, Bourdôt GW, Saville DJ. 2011. Population growth of Nassella trichotoma in grasslands in New Zealand slower today than in the past. Acta Oecol. 37:484–494. doi: 10.1016/j.actao.2011.06.008
- Leonard WF. 1956. Nassella Tussock. 9th New Zealand Weed Control Conference; Caroline Bay Hall, Timaru, New Zealand. p. 29–35.
- Verkaaik ML, Lamoureaux SL, Bourdôt GW. 2006. Efficacy of grubbing is plant size dependent in Nassella tussock. 15 Australian Weed Conference – Managing Weeds in a Changing Climate; Adelaide Conference Centre, Adelaide, South Australia. p. 880–882.