
 ?Mathematical formulae have been encoded as MathML and are displayed in this HTML version using MathJax in order to improve their display. Uncheck the box to turn MathJax off. This feature requires Javascript. Click on a formula to zoom.
ABSTRACT
Changes in wool prices, labour costs and animal welfare have sparked interest in several new sheep traits. Shedding, the ability of moulting or seasonal wool loss in sheep, is one of them. Here, we aimed to develop breeding values for shedding using existing data from New Zealand flocks. We used breeder-collected shedding scores, 0 = ‘no shedding on any part of the body’ to 10 = ‘wool shed fully from all the body’, for Wiltshire and Wiltshire-composite lambs born between 2003 and 2022. After QC, 20,653 phenotypic records from 25,066 animals with pedigree information (393 sires and 7439 dams from 12 flocks) were included in the analyses. Genetic parameters and breeding values were obtained using a genetic additive model with pedigree data (BLUP model), assuming shedding scores were quantitative. The genetic model incorporated the following variables: date of birth, sex, birth and rearing rank, age of dam and contemporary group. We found a high heritability for lamb shedding, 0.54 (0.02), and estimated a low-to-moderate prediction accuracy of breeding values (ranging from 0.09 to 0.36) using forward-validation. Our results confirmed that shedding can be subject to selection and that pedigree-based breeding values for this trait can be a useful tool for breeders.
Introduction
Through domestication and breeding, sheep populations changed their morphology, behaviour, and reproduction, and acquired characteristics important to breeders. Shedding, the ability of moulting or seasonal wool loss in sheep, is one such trait. In contrast to most modern breeds, the sheep wild ancestor, the mouflon, was able to shed its coat every year (Matika et al. Citation2013). Some sheep breeds and wild relatives, such as wild Soay sheep, Wiltshire, Dorper and composites, still retain this shedding ability (Pollott Citation2011; Matika et al. Citation2013).
In the last decades, changes in wool prices, labour costs and animal welfare in the sheep industry have sparked the interest of breeders in several new traits, including shedding. In New Zealand, wool production has also experienced major changes, driven largely by declining wool prices for mid to high micron fleeces (Johnson et al. Citation2021). The sheep industry (https://beeflambnz.com) has moved from the 1980s where meat and wool income was approximately equal, to the current situation where wool contributes only about 10% of gross sheep farm income, and less after shearing costs are deducted. As sheep numbers have declined, so has the volume of wool produced, from 58 million sheep producing 305,000 tonnes of wool in 1990 to 27 million sheep producing 140,000 tonnes of wool in 2019 (Wool Industry Project Action Group Citation2020).
Shedding exhibits a high heritability (Pollott Citation2011; Matika et al. Citation2013; Guy et al. Citation2021), particularly in lambs (Vargas Jurado et al. Citation2020). Although some lambs do not fully express their genetic potential to shed, this is likely through mechanisms associated with age and weight (Johnson et al. Citation2007) and environmental conditions in a particular year, as shedding is an event whose speed and timing are controlled by photoperiod (Rufaut et al. Citation1999) and seasonal changes from winter to summer (Matika et al. Citation2013).
There are genotypes in New Zealand that do not require shearing, including the New Zealand Wiltshire (Merrick Citation2003), although these have not yet made significant inroads into the greater New Zealand sheep industry (Johnson et al. Citation2007; O’Connell et al. Citation2012; Johnson et al. Citation2021). We here aimed to develop breeding values for shedding using existing sheep data from New Zealand flocks.
Methods and materials
Animals and phenotypes
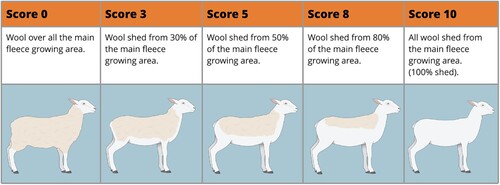
We used breeder-reported lamb shedding scores (shedding scores), 0 = ‘no shedding on any part of the body’ to 10 = ‘wool shed fully from all the body’, collected for Wiltshire and Wiltshire-composite animals born in stud farms between 2003 and 2022. shows the visual scoring guide developed by Beef + Lamb NZ Genetics which was available to all farmers (https://www.sil.co.nz/technical). Shedding scores were collected between December and March each year. Data quality control (QC) included removing flocks with less than 40 animals and removing shedding scores outside the plausible range.
Figure 1. Visual score guide for shedding (0 = ‘no shedding on any part of the body’ to 10 = ‘wool shed fully from all the body’) for stud farms in New Zealand. Source: Beef + Lamb New Zealand Genetics.
Genetic model
Genetic parameters and breeding values (BV) were obtained using a genetic model with pedigree data, also known as pedigree-based BLUP model (Henderson Citation1949; Mrode Citation2014). Assuming that shedding scores were a quantitative variable, we used the following linear mixed model:
where y is a vector of shedding scores; β is a vector of fixed effects with design matrix X; u is a vector of random effects (breeding values) with
and design matrix Z. A is the numerator relationship matrix constructed from the pedigree; e is a vector of residuals with
.
The model incorporated the following fixed effects: sex (‘Ram’, ‘Ewe’), birth and rearing ranking (‘11’ = single, ‘21’ = twins/triplets rear as single, ‘22’ = twins/triplets rear as twins, ‘33’ = triplets+), age of dam (‘1’, ‘2’, ‘3+’), date of birth (deviation from contemporary group mean in days), and contemporary group (flock, birth year, and mob). Notice that breeding values (u) are treated as random effects.
Across-flock genetic connectedness (linkage) was measured using the method of Visser et al. (Citation2013) as implemented by Sheep Improvement Ltd, NZ. For each trait, connectedness scores range from ‘0’ = weak to 3 = strong. The model parameters were estimated using the software MiX99 (Vuori et al. Citation2006). Data handling and plots were done in the software R 4.1.0 (R Core Team Citation2021).
Validation of breeding values
Breeding values were validated using a forward-validation scheme where phenotypes from animals born in 2022 (validation set) were removed from the analysis (training set). Breeding values were then estimated for the validation set and compared with their phenotypes adjusted by the variables included in the genetic model. The prediction accuracy of BVs was defined as the Pearson correlation of the adjusted phenotypes and BVs divided by the square of the trait heritability. Due to uneven measurement over time, the validation set only included animals from four flocks (2,723) with the most completed records and a connectedness score of at least 2 (Visser et al. Citation2013). These validation flocks were located in both the North and South Island of New Zealand.
Results
After quality control, 20,653 phenotypic records and 25,066 animals with pedigree from 12 flocks, 393 sires and 7439 dams, between 2003 and 2022 remained for the genetic analyses. The distribution of shedding scores is shown in (overall) and (by flock). Complete summary statistics for lamb shedding scores are shown in .
Figure 2. Overall distribution of lamb shedding scores (0 = ‘no shedding on any part of the body’ to 10 = ‘wool shed fully from all the body’).
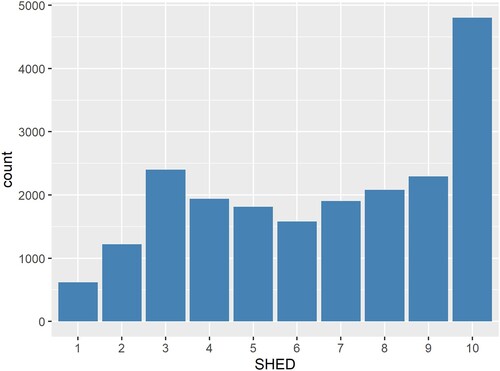
Figure 3. Distribution of lamb shedding (0 = ‘no shedding on any part of the body’ to 10 = ‘wool shed fully from all the body’) by flock.
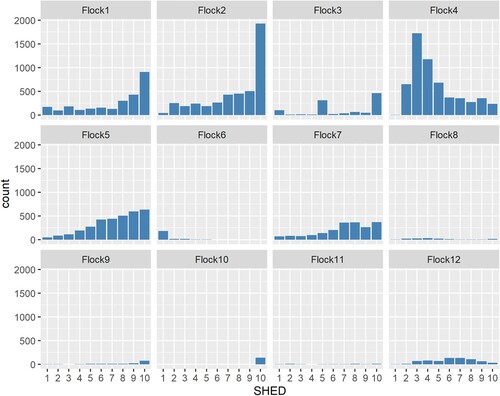
Table 1. Summary statistics for lamb shedding scores (shed) from stud farms in New Zealand.
Overall, there is great variability in the shedding scores, with a mean of 6.4 and a standard deviation of 3. In fact, the distribution of shedding scores is not symmetric, showing a bimodal shape, with modes at scores 3 and 10 (). Although the majority of lambs in the sample exhibit high levels of shedding, there are also a sizeable group of animals that show low levels or do not shed their wool in their first year of life. This result is even more pronounced when looking at the flock level (). Using the genetic model, we estimated a pedigree-based heritability equal to 0.54 (0.02) for lamb shedding. Estimated BVs ranged from −6.1 to 5.3.
Validation of breeding values
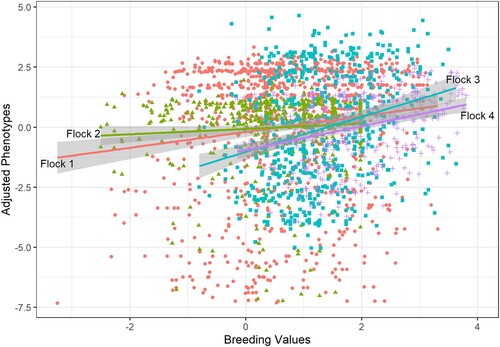
There were 2,723 lambs born in 2022 from the flocks used in the validation. The prediction accuracy of BVs varied between 0.09 and 0.36 across these four flocks (). Note that the least connected flock in this validation, flock 2 with a connectedness score = 2, had the lowest prediction accuracy (0.09). Flock 2 is also the only one located in a different island (Upper North Island) and thus experiences extremely different environmental conditions including variation in weather and photoperiod. The prediction accuracy for flocks 3 and 4 (0.36 and 0.27, respectively) was very close to the the theoretical (assuming a phenotyped dam) accuracy for these BVs (0.37).
Table 2. Number of lambs born in 2002, prediction accuracy, connectedness score, and geographical location (region) for flocks included in the validation.
shows the adjusted phenotypes and the BVs for shedding for the lambs in the validation flocks. These results indicate that BVs are somewhat uncertain, something expected given the number of phenotypic records by flock included in the model and the genetic linkage between them.
Figure 4. Forward-validation of shedding breeding values (BVs). Adjusted phenotypes versus BVs in the validation flocks. Regression lines, with 95% confidence bands, show best fit within flock.
Discussion and conclusions
Given an industry dataset, we analysed shedding scores for lambs and found great variability, especially among flocks, which suggests environmental and/or genetic heterogeneity across-flocks. The latter, different genetic background among stud farms, is likely due to the limited availability of pure breed Wiltshire sheep in New Zealand and the grading up from current maternal breeds conducted by the stud flocks. This crossbreeding is nothing new in the industry as the sheep analysed here, ‘New Zealand Wiltshire’ (Merrick Citation2003), were originally introduced via Australia and are themselves crosses of Wiltshire Horn, Poll Dorset and other breeds, making it a mixed genotype based on seasonal and a seasonal breeds (Merrick Citation2003; O’Connell et al. Citation2012).
Our estimate of high heritability of shedding in lambs, 0.54 (0.02), is very close to previous estimates for New Zealand, 0.52 (0.06) by Johnson et al. (Citation2007) and 0.52 (0.05) O’Connell et al. (Citation2012). This trait has also been shown to be highly heritable in sheep from Australia and other countries. For instance, Guy et al. (Citation2021) reported a heritability of 0.50 (0.05) for lamb shedding in Australia. Composite flocks in the UK and the US also reported comparable high heritabilities, 0.80 (0.06) in Easycare sheep in the UK (Matika et al. Citation2013) and 0.47 (0.03) to 0.59 (0.04) in Romanov, White Dorper and Katahdin composites in the US (Vargas Jurado et al. Citation2020).
Using forward cross-validation, we also estimated a low to moderate prediction accuracy of these breeding values, ranging from 0.09 to 0.36 for four selected flocks. These prediction accuracies are in general slightly lower than those expected by theory except for the least connected flock with also is located in a different island (Flock 2). Given the estimated heritability ( = 0.54), the theoretical accuracy for the BVs with a phenotyped parent is 0.37. Strong connectedness among flocks 1,3 and 4 indicates the potential presence of genotype by environment interactions for shedding, a hypothesis further supported by photoperiod effects for this trait (Rufaut et al. Citation1999), that is periods of increasing day length from late Spring to Summer in different geographical locations around New Zealand.
This study meets the growing interest of new physical and welfare traits for New Zealand sheep (Johnson et al. Citation2021; Johnson et al. Citation2023). Our results confirmed that shedding can be subject to selection and that, although of yet limited accuracy, pedigree-based breeding values for shedding scores derived from farmer-collected data can be a useful tool for sheep breeders interested in this trait in New Zealand.
Acknowledgements
We would like to acknowledge all New Zealand sheep breeders who contributed the shedding data and the pedigree used in this study.
Disclosure statement
No potential conflict of interest was reported by the author(s).
References
- Guy S, Kellier J, Brown D. 2021. Preliminary genetic analysis of wool-shedding ability in sheep. Animal Production Science. 61:lxxxii.
- Henderson CR. 1949. Estimation of changes in herd environment. J Dairy Sci. 32:706–706.
- Johnson P, O’Connell D, Dodds K, Sumner R, McEwan J, Pearson A. 2007. Wool shedding as a trait for genetic improvement using marker assisted selection. In: Proceedings of the Association for the Advancement of Animal Breeding and Genetics. p. 541–544.
- Johnson PL, Newman SA, McRae KM, Van Der Weerden T, Brown M, Scobie DR. 2021. Invited review: a review of the current sheep industry in New Zealand and opportunities for change to meet future challenges. New Zealand Journal of Animal Science and Production. 81:1–15.
- Johnson PL, Scobie DR, Dodds KG, Powdrell SH, Rowe SJ, McRae KM. 2023. Genetic parameter analysis of bareness and tail traits in New Zealand sheep. Journal of Animal Science. 101:1–10.
- Matika O, Bishop SC, Pong-Wong R, Riggio V, Headon DJ. 2013. Genetic factors controlling wool shedding in a composite Easycare sheep flock. Anim Genet. 44:742–749.
- Merrick NC. 2003. Assessment of fleece cover in crosses between Coopworth, Dorper, Damara, New Zealand Wiltshire, Poll Dorset and Suffolk sheep. In: Proceedings of the New Zealand Society of Animal Production; New Zealand Society of Animal Production. p. 160–163.
- Mrode RA. 2014. Linear models for the prediction of animal breeding values. 3rd ed. Wallingford, Oxfordshire, UK: CABI.
- O’Connell D, Scobie D, Hickey S, Sumner R, Pearson A. 2012. Selection for yearling fleece weight and its effect on fleece shedding in New Zealand Wiltshire sheep. Animal Production Science. 52:456–462.
- Pollott G. 2011. A suggested mode of inheritance for wool shedding in sheep. Journal of Animal Science. 89:2316–2325.
- R Core Team. 2021. R: a language and environment for statistical computing. R Foundation for Statistical Computing. Vienna.
- Rufaut NW, Pearson AJ, Nixon AJ, Wheeler TT, Wilkins RJ. 1999. Identification of differentially expressed genes during a wool follicle growth cycle induced by prolactin. J Investigative Dermatology. 113:865–872.
- Vargas Jurado N, Kuehn LA, Lewis RM. 2020. Lamb wool shedding is a good predictor of ewe wool shedding. J Anim Breed Genet. 137:365–373.
- Visser B, Byrne T, Young M, Amer P. 2013. Improved reporting method for genetic connectedness. In: Proceedings of the 20th Conference of the Association for the Advancement of Animal Breeding and Genetics. p. 531–533.
- Vuori K, Strandén I, Lidauer M, Mäntysaari E. 2006. MiX99-effective solver for large and complex linear mixed models. In: Proceedings of the 8th World Congress on Genetics Applied to Livestock Production, Belo Horizonte, Minas Gerais, Brazil, Aug 13–18; Instituto Prociência. p. 27–33.
- Wool Industry Project Action Group. 2020. Vision and action for New Zealand’s wool sector.