
ABSTRACT
The production of valuable metabolites from microalgae represents a potentially sustainable source of a range of products that can be difficult to synthesise directly. Microalgae respond to the dynamic and often subtly shifting growth environment in a complex way. The optimal conditions for growth can be quite different to those needed for optimal product generation, depending on the nature of the biosynthesis of that product. This is especially so for secondary metabolites. A combination of a multi-vessel photobioreactor array, where certain growth conditions can be monitored and controlled precisely together with an experimental design matrix has been used to determine the optimal combination of temperature, irradiance and pH for a group of xanthophylls including fucoxanthin in the algae Tisochrysis lutea in continuous culture. Continuous culture as a mode is more suited for industrial production than batch mode in which the media constituents and algal population change dramatically over time. The central composite design experiment matrix has a range of set values for each parameter being investigated that bracket the optimal conditions. The three parameters investigated in this work (temperature, irradiance and pH) are major factors influencing algal growth. The method can be applied to other parameters that might affect growth or might affect production of a metabolite of interest, such as a nutrient level. The combined approach has been used previously to indicate optimal growth conditions for biomass generation and this work is one of the first to apply it to the generation of an algal product of interest.
Introduction
Mass production of high-value products from microalgae is increasingly investigated, not only as a potentially sustainable and less environmentally impactful source (‘greenchem’), but also for supply of metabolites unavailable in other ways. The use of microalgae as feedstock is challenging for large scale production. An example of this is to find the optimal conditions for the desired behaviour, whether that be productivity or the generation of a product of interest. Rapid assessment to estimate any physiological ‘sweet spots’ to maximise production is a valuable tool to minimise setup time and costs, particularly when focusing effort onto production of high-value compounds rather than biomass. Investigating production response to multiple growth parameters simultaneously can reveal unexpected interactions between these parameters. Calculations based on culture production (e.g. volume/unit time), amount of product from the algal culture (e.g. mass/unit time) and cellular production (‘quota’ e.g. mass/cell in the culture) can help inform optimal growing conditions for desired output.
In this study we investigate the production-optimal combination of values of three important conditions for a group of xanthophylls including the potentially valuable carotenoid fucoxanthin by the golden-yellow haptophyte Tisochrysis lutea (Isochrysis sp., ‘Tahitian strain’, T-Iso) (Bendif et al. Citation2013). This study focuses on the interaction between these parameters using response surface methodology (RSM). The multi-variate experimental design method generates a statistically robust matrix of central composite designed (CCD) experiments to test nominated parameters, bracketing the expected optimum point (Spolaore et al. Citation2006; Myers et al. Citation2016).
The combined effects of temperature, irradiance and pH (TIP) on cell growth and xanthophyll production were assessed using photobioreactors run in continuous culturing mode (a chemostat) allowing sequential experiments to be run by making minor changes to culture condition values between experiments. This was made possible through the fabrication of a bank of six custom bioreactors driven by a programmable logic controller (PLC) to individually control and monitor TIP whilst maintaining a steady culture density (a turbidostat).
T-Iso is a widely used food algae for bivalve juveniles and is grown in hatcheries worldwide for this purpose. T-Iso produces a range of xanthophyll pigments which are increasingly attracting interest in the healthy and functional food industry sectors as bioactives with a wide range of potential benefits (Jaswir et al. Citation2012; Kim et al. Citation2012; Mikami & Hosokawa Citation2013). Fucoxanthin, and related xanthophylls and carotenoids, may have anti-oxidant, anti-inflammatory, anti-cancer and anti-viral activity and may also be beneficial for diabetes and obesity control (Nakazawa et al. Citation2009; Nishikawa et al. Citation2012; Xia et al. Citation2013; Zhang et al. Citation2014).
The xanthophyll biosynthetic pathway generating fucoxanthin and related pigments is still largely undetermined and the intermediates have been linked in different ways, perhaps depending on the genus of algae (Coesel et al. Citation2008; Roy et al. Citation2011; Kuczynska et al. Citation2015; G. Bougaran, IFREMER, Nantes France, pers. comm. 2015; M. Hosokawa, Hokkaido University, Hakodate Japan, pers. comm. 2015). In diatoms, diadinoxanthin is the primary biosynthetic committed step with violaxanthin de-epoxidase (VDE, VDL1, VDL2) enzymes converting between diadinoxanthin and diatoxanthin, where fucoxanthin is proposed to be produced as a side reaction from the diadinoxanthin (Lohr & Wilhelm Citation1999, Citation2001; Coesel et al. Citation2008; Roy et al. Citation2011; Kuczynska et al. Citation2015). However, it has also been reported that fucoxanthin can be produced directly from dinoxanthin (Lohr & Wilhelm Citation2001). In brown seaweeds and diatoms it was proposed that neoxanthin can be the direct precursor of both diadinoxanthin and fucoxanthin (Mikami & Hosokawa Citation2013), but later suggested that fucoxanthin formation from neoxanthin precedes diadinoxanthin where stress in the algae leads to breakage of the allenic bond of fucoxanthin (M. Hosokawa, Hokkaido University, Hakodate Japan, pers. comm. 2015). Stress mechanisms such as nitrogen starvation and high light are known to drive the synthesis of other high value carotenoids such as astaxanthin (Boussiba et al. Citation1999; Boussiba Citation2000). It has been assumed that this would follow for the structurally related fucoxanthin molecule also, but studies have shown differing responses from diatoms in various stressful culturing conditions (Xia et al. Citation2013; Kuczynska et al. Citation2015), depending on exactly how biosynthesis occurs in that species. The work in this article does not aim to specifically address the biosynthetic pathway for xanthophylls such as fucoxanthin in the haptophyte studied. However, the determined optimal conditions of temperature, irradiance and pH for its production are consistent with fucoxanthin being generated in T-Iso under non-stress conditions, especially with regard to light.
Materials and methods
The custom-made photobioreactors and control system were engineered to deliver tight control over light quality and intensity, temperature and pH in the 1.0 L experimental culture vessels (). Red (λ = 655 nm) and blue (λ = 447.5 nm) light-emitting diode (LED) arrays were adjusted to provide experimental light intensities at a ratio of 4:1 red:blue light, as guided by results from previous experimentation (data not shown). Irradiance was set using a handheld photosynthetically active radiation (PAR) meter (Li-Cor LI-250A with quantum sensor). Temperature was controlled using submerged bespoke thermistor coupled heating probes. Culture pH and density were controlled and measured values were recorded by an Omron PLC (CPU SYSMAC-CJ2). Culture pH was measured using SI Analytics GmBH Steamline probes (SL82-120pHT) and controlled by injection of compressed CO2 into the aeration line. Vessels were aerated with 0.2 µm filtered air at 50 mL/min and stirred gently (100 rpm) using magnetic stir-bars. Culture density was measured using the signal strength of a pulsed infrared LED beamed through the vessel. An Arduino Pro Mini chip monitored the signal and converted it to a 4–20 mA output signal which was calibrated against cell counts quantified by flow cytometry. Any increase in culture density was controlled via the PLC using pneumatic process pumps (SMC PB1011) to introduce fresh medium into the vessel until the measured density was diluted back to set point values. Excess culture medium was collected via an overflow pipe and the volume produced over a 24 h period was recorded.
The flagellate Tisochrysis lutea (Isochrysis sp., ‘Tahitian strain’, T-Iso) was chosen due to the level of fucoxanthin production achieved in continuous culture. Mother stocks were periodically (yearly) obtained from the Australian National Algal Culture Collection (culture code CS-177). All experiments were carried out in Walne’s ‘Cell Hi WP’ Medium (Varicon Aqua) at the recommended dilution rate of 1.5 kg solid:10,000 L using 34‰ seawater. All Walne’s nutrient stock medium was aseptically filtered (0.2 µm) prior to final dilution into the autoclaved sea water base.
Stock cultures were maintained at 20–23 °C under continuous cool-white fluorescent light at 100 µmol photons/m2/sec (µEinsteins/m2/sec:µE). Stock cultures were passaged by 100-fold dilution when cell densities exceeded 8 × 10⁹ cells/L.
Figure 1. Multiple vessel photobioreactor system. Six 1.0 L vessels housed individually, each fitted with an array of red and blue LED light, high quality gel-filled electrochemical process pH probe, a heating and temperature sensing probe, and a bespoke pulsed infrared LED and sensor system to monitor culture density. Experimental setpoints for continuous culture (turbidostat and pH-chemostat mode) were monitored and controlled using a PLC which drove media pumping and CO2 injection into the airstream. The vessels had inbuilt overflow arms to collect and measure culture production.
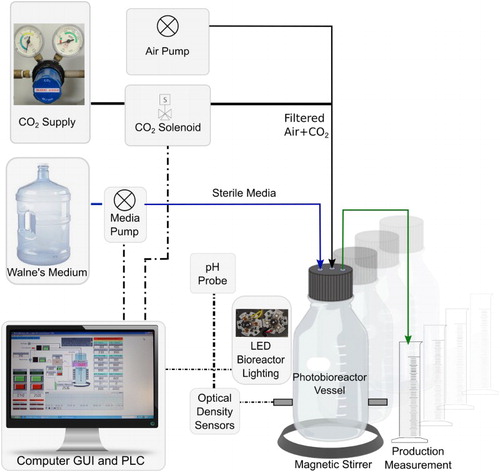
Figure 2. Central composite design face-centred cube. For any three parameters the three central points inform experimental variance, white points on the cube represent star points to detect curvature of parameter response, and the grey ‘axial’ points parameterise the effect. After Sechet et al. (Citation2007) with permission.
A set of 20 CCD experiments were designed to determine the optimum pH, light and temperature conditions for fucoxanthin production. A symmetrical and rotatable set of experimental conditions were defined by CCD (), bracketing an optimum combination estimated from previous experience in continuous culture of T-Iso. The initial set of experiments listed as 1.S1–11.C3 in were generated using factorial design. The central points (9.C1–11.C3 and 18.C4–20.C6) allowed estimation of experimental variance. Based on linear regression analysis of the first set of CCD results, further ‘star point’ experiments were required (12.A1–20.C6) to estimate curvature in response. This ensured that the production maximum had been bracketed. Response surface methodology describes an iterative optimisation of the response with many repeats of CCD experiments and regression analysis (Myers et al. Citation2016).
Table 1. Experimental design matrix for optimising three parameters for fucoxanthin production.
Experimental cultures were aseptically set up in photobioreactor vessels at approximately 5 × 10⁹ cells/L, and promptly connected to light, aeration, density, pH and temperature control systems. Experimental conditions were attained stepwise to minimise physiological shock to the culture. The photobioreactors were maintained in continuous culture aiming at consistent cell density between experiments. Some cultures under experimental conditions at the extremes of the parameter tested sometimes failed to achieve this cell density for the entire duration of the experiment. Samples were collected from the vessels for analysis once steady growth state had been reached as indicated by stable medium volumes delivered over time. Samples were analysed for cell density (by flow cytometry), the yield of photosystem PSII (Fv/Fm), a measure for the quantum yield of photosynthesis (pulse amplitude modulated [PAM] fluorometry) and xanthophyll pigment concentration (trans E-fucoxanthin, cis Z-fucoxanthin, diadinoxanthin and diatoxanthin). Volumes of medium consumption recorded under those experimental conditions allowed the calculation of the rate of xanthophyll production (mass per time) and quota (mass per cell).
Experimental cultures were discarded when sample PAM measurements indicated the cultures were no longer robust (using Fv/Fm < 0.5). Fresh bioreactors were then set up and inoculum was allowed to equilibrate as described above.
Bioreactor sample analyses were performed on unpreserved samples immediately after sampling to minimise changes in cell densities and pigment composition (Toepel et al. Citation2005). Cell densities were determined using flow cytometry (Sysmex-Partec CyFlow Cube 8) using true count electrodes methodology and processing forward scatter counts (FSC) gated for chlorophyll-a.
PAM fluorometry was performed using a Phyto-PAM-EDF (Walz) as an indication of photosynthetic health of the culture. Maximum quantum efficiency of the PSII yield (Fv/Fm) was measured on 10 min dark adapted samples using a saturating pulse (2600 µE, pulse length 200 msec) as previously described (Beuzenberg et al. Citation2014).
Xanthophylls were analysed using an in-house method developed and optimised for separation and detection of each pigment. Samples (10 mL) were centrifuged (2,000 × g, 10 min, 15 °C) and the supernatant was discarded. The pellet was stored at −20 °C (< 2 months) until extraction and analysis. On the day of xanthophyll analysis, cell pellets were re-suspended in methanol (5 mL) and sonicated for 30 min in an ice bath. Extracts were clarified by centrifugation (3,200 × g, 10 min) and transferred to amber septum-capped glass vials. Whenever possible, the samples and xanthophyll extracts were protected from light. Xanthophyll content was determined by ultra-performance liquid chromatography (UPLC) with ultra-violet/visible (UV/Vis) light absorption on a Waters Acquity I-Class UPLC system equipped with a photo diode array (PDA) detector acquiring data between 320–500 nm. Extract components were separated on a C30 UPLC column (Thermo Scientific Accucore C30; 150 × 2.1 mm, 2.6 µm) using a gradient of methanol (solvent A) to 60:40 methanol/isopropyl alcohol (solvent B). Extracts (5 µL) were injected in 0.1% B where the solvent composition was held stable for 2 min before increasing in a linear gradient to 5% B over 4 min. Following this, the gradient increased linearly to 80% B over a further 8 min before being washed with 80% B for 2 min and returning to 0.1% B to re-equilibrate for 0.5 min. The column temperature was maintained at 30 °C. Different xanthophylls, chlorophylls and carotenoids were identified based on their retention times, UV/Vis 400–500 absorption spectrum and mass spectrometric analysis in comparison to reference standards.
The concentrations of fucoxanthin, Z-fucoxanthin, diadinoxanthin and diatoxanthin were determined using a standard curve of (all-E)-fucoxanthin (2–20 µg/mL; Carotenature). The method detection limit was 0.1 µg/mL for each analyte. Response factors of dia- dinoxanthin and diatoxanthin were determined by comparison of individual standards against the (all-E)-fucoxanthin standard (DHI Lab Products). Chromatograms for xanthophyll standards (A–C) and a T-Iso methanolic extract (D), where fucoxanthin and its isomer Z-fucoxanthin elute earlier than the xanthophylls diadinoxanthin and diatoxanthin, allowing sufficient resolution for integration and to determine pigment concentrations. The presence of chlorophyll-a and its allomerization product (CH2O2-chlorophyll-a) were also detected in the extracts (D) (Brereton et al. Citation1994).
Figure 3. Chromatograms of xanthophyll analysis. Liquid chromatograms using a PDA detector are shown for A, fucoxanthin standard; B, diadinoxanthin standard; C, diatoxanthin standard; D, methanol extract of Tisochrysis sp. (Note: only the 0.5–4 min portion of the chromatograms are displayed).
Growth or production rates and cell quota values for each experimental combination of conditions were analysed using simple linear regression, with quadratic as well as linear terms for each of the three growth conditions. Both predictor and response values were log-transformed as necessary to improve normality. The model equations, with coefficient values determined by least squares, were optimised between constraints to find the combination of maximum response (Byrd et al. Citation1995).
Results
The dark adapted maximum photochemical yield of photosystem II (Fv/Fm), and pigment measurements for each of the experiments in the central composite design (), are presented. Fucoxanthin was the major xanthophyll present in the T-Iso used for this data. The stereo-isomer Z-fucoxanthin, diatoxanthin and diadinoxanthin were all present in minor quantities. Pigment data is presented as culture production (mg/24 h) of the particular pigment. The data expressed in terms of concentration (mg/L) and quota (pg/cell) are available in the supplementary material (Table S1). Some experiments were repeated; all data for that condition contributed to analysis (eg. rep1, rep2).
Table 2. PAM fluorometry and pigment production results.
The predicted optimal set point for PSII yield Fv/Fm was very close to that for fucoxanthin production (mg/24 h) suggesting T-Iso produces maximum fucoxanthin when the photochemistry is least stressed (). This is consistent with experimental observations where vigorously growing cultures with high demands on medium, replacing more than 100% by volume in a 24 h period, also had high Fv/Fm values (data not presented). When all four xanthophyll production and cell quota optimal set points were compared, the cell quota optima were furthest from the production optima with physiologically ‘harsher’ TIP conditions required to maximise cell quota. The fucoxanthin cell quota optimum was calculated to be 35 °C (temperature), 40 µE (irradiance) and pH 7.6, differing from fucoxanthin production conditions for these parameters of 25 °C, 74 µE and pH 7.4, predicting 0.72 mg fucoxanthin/24 h with 95% confidence interval ranging from 0.39 to 1.35 mg/24 h (Table S2). Cell quota was shown to reach elevated levels, but in this study it was to the detriment of production volume. By this measure, setting T-Iso growth conditions to favour maximising individual pigments by achieving a higher cell quota would not be viable on a commercial scale.
In order to compare the calculated optima for each pigment, the production rates (mg/24 h) for the four xanthophylls are graphically represented (–). The interaction of three variables simultaneously on a two dimensional plot is difficult to interpret. Two types of plots were used to aid visualisation. Fitted response plots () show the calculated response to each growth condition variable (TIP), when the other two are held at their optima. A further set of response surface plots (, panels A–C) demonstrate the interactions of two parameters using three axes, and , panel D illustrates the relationship of the three parameters.
Figure 4. Fitted response plots for quantum yield and production of xanthophylls to temperature, irradiance and pH. The responses to the variables are shown when the other two are held at their optima (number on each panel). The calculated optimal conditions are marked with vertical dashed lines. The curved dashed lines are a 2× SE (95%) confidence interval. A–C, Photosystem PSII yield (Fv/Fm); D–F, fucoxanthin production (mg/24 h); G–I, Z-fucoxanthin production (mg/24 h); J–L, diadinoxanthin production (mg/24 h); M–O, diatoxanthin production (mg/24 h).
Figure 5. Fucoxanthin production optimum illustrated with three bivariate response surfaces and a trivariate response volume. Panels A–C show the effects of temperature and irradiance (panel A), temperature and pH (panel B) and irradiance and pH (panel C) on fucoxanthin production (mg/24 h). Panel D displays experimental results in a 3D graph with contours for each parameter showing the optimal values (dotted square projections) with contours around each. The black points mark the locations of experiments, relating to the face-centred cube of the experimental design () and their size reflects the response magnitude. A white marker (also scaled in the same way for production response) and dashed lines at the axes indicate the estimated location of the optimum (25°C, 76 µE, pH 7.4).
The degree of variation in response across the experimental range of each parameter is illustrated in the response plots (). The value of each parameter in the estimated optimum combination is marked on the x axis with a vertical dashed line. The solid lines show a regression model fit across the range of each variable in turn, where the other two variables are held at their respective optima. Curvature is almost universally present in response plots, suggesting the range of conditions tested does span the optimum zone as desired. Broad peaks indicate tolerance of T-Iso to the conditions in this region; however, this tolerance, and the variability of the algal response, limits the precision with which the optimum can be estimated. Points show the values of each growth condition where experiments were conducted. Experimental points at each x-axis location may differ in the values of the two other parameters. The curved dashed lines are the confidence interval based on 2× SE (95%). The range of responses to any x-axis variable value is due to variance in the other variables, as well as experimental error.
The fucoxanthin production optimum (mg/24 h) calculated to be 25 °C, 76 µE and pH 7.4 () was slightly different to the optimum calculated for maximising photosynthetic efficiency (Fv/Fm [28 °C, 51 µE, pH 7.4]); and the high light optimum for production of diatoxanthin (22 °C, 390 µE, pH 7.2), illustrating the potential benefits of controlling T-Iso culture conditions when targeting production of specific compounds.
The fucoxanthin production optimum is shown with two variables per response surface plot in , panels A–C. The peaks in responses to all three variables were generally not sharp, as could be expected in a biological system. Trends from this study showed that increasing total irradiance led to a decrease in fucoxanthin production rates, and temperature had a broad peaked optimum with tolerance of approximately ±5 °C. Optimal pH also had a broad peak, and showed a greater tolerance to medium pH lower than the optimum value.
Table 3. Set point optima for maximising production of each pigment as calculated by response surface methodology.
To further illustrate the interdependent relationships of the three parameters, a three axis graph (, panel D) shows black dots at the experimental set point locations and the dot size reflects the magnitude of the response (fucoxanthin production [mg/24 h]). The white marker indicates the estimated location of the optimum conditions, with dashed lines forming frames in each plane of the calculated optimum (25 °C, 76 µE, pH 7.4). The confidence of the determination of these optimal values is displayed in , where a larger dot size indicates higher confidence in the result.
Figure 6. Confidence of the estimated optima for xanthophylls. Panels for temperature (top), irradiance (middle) and pH (bottom) for each measured response, where the dot size reflects the R2 fit of the model. Results for xanthophyll concentration (C, mg/L culture), production (P, mg/24 h) and quota (Q, ng/cell) are shown.
Discussion
When used in conjunction with a CCD experimental matrix, a suite of photobioreactors that automatically monitor and control algal culture growth parameters becomes a powerful tool to rapidly assess combinations of microalgal growth conditions and estimate the optimum combination (Sechet et al. Citation2007; Myers et al. Citation2016). Using this rigorous experimental design and hardware together, the present study shows T-Iso had significant variability in various xanthophyll production rates to the combination of temperature, irradiance and pH, and a fucoxanthin production optimum was estimated at 25 °C, 76 µE, pH 7.4.
This methodology allows investigation of optimal parameters to achieve different outputs. For example, the calculated optimum for photosynthetic health (Fv/Fm), which reflects the vigour of the culture, and the optimum for fucoxanthin production (mg/24 h), concentration (mg/L) and cell quota (pg/cell) are all different (Table S2). This is consistent with results on overall algal productivity as presented by Marchetti et al. (2012), where useful insights into commercial advantages are presented.
The importance on the outcome on results from synergies between various growth conditions is highlighted. Using bioreactor vessels with different geometries, Xia et al. (2013) studied impacts of high and low light on fucoxanthin production from the diatom Odontella aurita, showing detrimental effects of higher irradiance levels. The irradiance estimated as optimum in our study (76 µE) is lower than routinely used in molluscan spat hatchery facilities and other T-Iso studies (Sechet et al. Citation2007; Marchetti et al. Citation2012) where biomass is the primary focus.
The photoprotective pigment pair, diadinoxanthin and diatoxanthin, followed trends expected between light harvesting and energy dissipation under excess light conditions (Roy et al. Citation2011; Holleboom & Walla Citation2014; Kuczynska et al. Citation2015). Light-induced de-epoxidation resulted in measured concentration increases of the photoprotective species diatoxanthin at higher irradiance levels (390 µE) while lower irradiance levels (220 µE) resulted in higher diadinoxanthin concentrations. Putative biosynthetic pathways for this light harvesting branch of xanthophylls suggest that these may be possible precursor compounds to fucoxanthin (Coesel et al. Citation2008; Roy et al. Citation2011; Mikami & Hosokawa Citation2013). The low irradiance fucoxanthin optimum could suggest it is worth investigating holding cultures under high light to generate photo-protective pigments, followed by a period of low light to allow conversion to the fucoxanthin compounds.
During the UPLC method setup, extracts were also analysed by mass spectrometry. During this analysis, no evidence of the presence of dinoxanthin was observed in the sample analysed.
The effects of white light versus the red and blue light combination used in our study are also unquantified, although Marchetti and colleagues showed blue light influenced T-Iso metabolism without affecting productivity at given growth rates (Marchetti et al. Citation2013). This study also showed chlorophyll-a concentrations were increased by blue light (Marchetti et al. Citation2013). Further investigation with our experimental matrix using white light would be informative, but beyond the scope of this study.
Optimal pH is a broad peak with fucoxanthin production showing tolerance towards pH levels lower than the optimum and less tolerance to pH higher than the optimum. This observation could be affected by the CO2 used to control the pH of the growth medium. Correlation between photosynthetically available carbon species and H+ concentration measured by pH probes confound the interpretation of the optimum pH.
Chromatographic methods for separation of (all-E)-fucoxanthin and its -cis stereoisomer Z-fucoxanthin could present analytical challenges without sufficient peak separation and may be potentially reported in summation elsewhere in other studies. The analytical methods used in the work reported here allow their individual quantitation and also the identification of the optimal values for temperature, irradiance and pH and their determination is therefore a valuable contribution to the literature. The production of these stereoisomers is affected by the amount of light provided to the continuous cultures. In our study, Z-fucoxanthin optimum (31 °C, 40 µE, pH 7.1) was estimated at values quite different to the (all-E)-fucoxanthin optimum. The precursor carotenoid, neoxanthin, was described by Uragami et al. (Citation2014) to be accumulated in the (all-E)-neoxanthin form in the green alga Codium intricatum when cultured under high light conditions. This interesting question is beyond the scope of our current study but would be a possible future study.
The full body of results from our study, in conjunction with data of other published investigations, indicate very strongly that physico-biological parameters influence growth and production of valuable secondary metabolites in synergy. Care must be taken therefore not to extrapolate results for any one parameter in isolation.
Brown macroalgae seaweeds such as Undaria pinnatifida are the current commercial source of fucoxanthin. The value of fucoxanthin and related metabolites as potential healthy and functional food ingredients is becoming realised due to a range of increasingly demonstrated bioactivities (Nakazawa et al. Citation2009; Nishikawa et al. Citation2012; Xia et al. Citation2013; Zhang et al. Citation2014). T-Iso and other microalgae such as Pheodactylum spp. also produce fucoxanthin and the approach used in this work can help to identify growth conditions facilitating microalgal culture to become a viable alternative source.
Acknowledgements
Special thanks to Dave Baran (Discovery Engineering Ltd) and Andrew Mahon (Cawthron) for the construction of the photobioreactor and PLC control systems. We thank Dr Olivier Champeau for help with preparation of the schematic in . Associate Editor: Dr Tina Summerfield.
Disclosure statement
No potential conflict of interest was reported by the authors.
Additional information
Funding
Related Research Data
References
- Bendif EM, Probert I, Schroeder DC, de Vargas C. 2013. On the description of Tisochrysis lutea gen. nov. sp. nov. and Isochrysis nuda sp. nov. in the Isochrysidales, and the transfer of Dicrateria to the Prymnesiales (Haptophyta). J Appl Phycol. 25:1763–1776. doi: 10.1007/s10811-013-0037-0
- Beuzenberg V, Smith KF, Packer MA. 2014. Isolation and characterisation of halo-tolerant Dunaliella strains from Lake Grassmere/Kapara Te Hau, New Zealand. NZ J Bot. 52(1):136–152. doi: 10.1080/0028825X.2013.859627
- Boussiba S. 2000. Carotenogenesis in the green alga Haematococcus pluvialis: cellular physiology and stress response. Physiol Plant. 108(2):111–117. doi: 10.1034/j.1399-3054.2000.108002111.x
- Boussiba S, Bing W, Yuan J-P, Zarka A, Chen F. 1999. Changes in pigments profile in the green alga Haeamtococcus pluvialis exposed to environmental stresses. Biotechnol Lett. 21(7):601–604. doi: 10.1023/A:1005507514694
- Brereton RG, Rahmani A, Liang Y-z, Kvalheim OM. 1994. Investigation of the allomerization reaction of chlorophyll a: use of diode array HPLC, mass spectrometry and chemometric factor analysis for the detection of early products. Photochem Photobiol. 59(1):99–110. doi: 10.1111/j.1751-1097.1994.tb05007.x
- Byrd RH, Lu P, Nocedal J, Zhu C. 1995. A limited memory algorithm for bound constrained optimization. Siam J Optim. 16:1190–1208.
- Coesel S, Obornik M, Varela J, Falciatore A, Bowler C. 2008. Evolutionary origins and functions of the carotenoid biosynthetic pathway in marine diatoms. PLoS One. 3(8):e2896. doi: 10.1371/journal.pone.0002896
- Holleboom C-P, Walla PJ. 2014. The back and forth of energy transfer between carotenoids and chlorophylls and its role in the regulation of light harvesting. Photosynth Res. 119(1–2):215–221. doi: 10.1007/s11120-013-9815-4
- Jaswir I, Noviendri D, Salleh HM, Miyashita K. 2012. Fucoxanthin extractions of brown seaweeds and analysis of their lipid fraction in methanol. Food Sci Technol Res. 18(2):251–257. doi: 10.3136/fstr.18.251
- Kim SM, Kang S-W, Kwon O-N, Chung D, Pan C-H. 2012. Fucoxanthin as a major carotenoid in Isochrysis aff. galbana: characterization of extraction for commercial application. J Korean Soc Appl Biol Chem. 55(4):477–483. doi: 10.1007/s13765-012-2108-3
- Kuczynska P, Jemiola-Rzeminska M, Strzalka K. 2015. Photosynthetic pigments in diatoms. Mari Drugs. 13(9):5847–5881. doi: 10.3390/md13095847
- Lohr M, Wilhelm C. 1999. Algae displaying the diadinoxanthin cycle also possess the violaxanthin cycle. Proc Natl Acad Sci USAmerica. 96(15):8784–8789. doi: 10.1073/pnas.96.15.8784
- Lohr M, Wilhelm C. 2001. Xanthophyll synthesis in diatoms: quantification of putative intermediates and comparison of pigment conversion kinetics with rate constants derived from a model. Planta. 212(3):382–391. doi: 10.1007/s004250000403
- Marchetti J, Bougaran G, Jauffrais T, Lefebvre S, Rouxel C, Saint-Jean B, Lukomska E, Robert R, Cadoret JP. 2013. Effects of blue light on the biochemical composition and photosynthetic activity of Isochrysis sp (T-iso). J Appl Phycol. 25(1):109–119. doi: 10.1007/s10811-012-9844-y
- Marchetti J, Bougaran G, Le Dean L, Megrier C, Lukomska E, Kaas R, Olivo E, Baron R, Robert R, Cadoret JP. 2012. Optimizing conditions for the continuous culture of Isochrysis affinis galbana relevant to commercial hatcheries. Aquaculture. 326-329:106–115. doi: 10.1016/j.aquaculture.2011.11.020
- Mikami K, Hosokawa M. 2013. Biosynthetic pathway and health benefits of fucoxanthin, an algae-specific xanthophyll in brown seaweeds. Int J Mol Sci. 14(7):13763–13781. doi: 10.3390/ijms140713763
- Myers RH, Montgomery DC, Anderson-Cook CM. 2016. Response surface methodology: process and product optimization using designed experiments. 4th ed. Hoboken (NJ): John Wiley & Sons.
- Nakazawa Y, Sashima T, Hosokawa M, Miyashita K. 2009. Comparative evaluation of growth inhibitory effect of stereoisomers of fucoxanthin in human cancer cell lines. J Funct Foods. 1(1):88–97. doi: 10.1016/j.jff.2008.09.015
- Nishikawa S, Hosokawa M, Miyashita K. 2012. Fucoxanthin promotes translocation and induction of glucose transporter 4 in skeletal muscles of diabetic/obese KK-A(y) mice. Phytomedicine. 19(5):389–394. doi: 10.1016/j.phymed.2011.11.001
- Roy S, Llewellyn CA, Egeland ES, Johnsen G. 2011. Phytoplankton pigments: characterization, chemotaxonomy and applications in oceanography. Cambridge, UK: Cambridge University Press.
- Sechet V, Bougaran G, Bohec M, Truquet P, Sibat M, Savar V, Kaas R, Lukomska E, Megrier C, Zouher A. 2007. Photobioreactor as a tool for microalgae physiology and toxicity studies. In: Busby P, editor. Sixth international conference on Molluscan Shellfish Safety. Wellington: Royal Society of New Zealand; p. 101–108.
- Spolaore P, Joannis-Cassan C, Duran E, Isambert A. 2006. Optimization of Nannochloropsis oculata growth using the response surface method. J Chem Technol Biotechnol. 81(6):1049–1056. doi: 10.1002/jctb.1529
- Toepel J, Langner U, Wilhelm C. 2005. Combination of flow cytometry and single cell absorption spectroscopy to study the phytoplankton structure and to calculate the chl a specific absorption coefficients at the taxon level. J Phycol. 41(6):1099–1109. doi: 10.1111/j.1529-8817.2005.00137.x
- Uragami C, Galzerano D, Gall A, Shigematsu Y, Meisterhans M, Oka N, Iha M, Fujii R, Robert B, Hashimoto H. 2014. Light-dependent conformational change of neoxanthin in a siphonous green alga, Codium intricatum, revealed by Raman spectroscopy. Photosynth Res. 121(1):69–77. doi: 10.1007/s11120-014-0011-y
- Xia S, Wang K, Wan L, Li A, Hu Q, Zhang C. 2013. Production, characterization, and antioxidant activity of fucoxanthin from the marine diatom Odontella aurita. Mar Drugs. 11(7):2667–2681. doi: 10.3390/md11072667
- Zhang Y, Fang H, Xie Q, Sun J, Liu R, Hong Z, Yi R, Wu H. 2014. Comparative evaluation of the radical-scavenging activities of fucoxanthin and its stereoisomers. Molecules. 19(2):2100–2113. doi: 10.3390/molecules19022100