
Abstract
Groundwater plays an important role in New Zealand water supplies and hence monitoring activities are conducted regularly. Most monitoring programmes aim to evaluate groundwater chemistry and almost completely overlook the microbial component in this ecosystem. In our present study, the bacterial community structure of groundwater in the Wairarapa Valley was examined using the terminal restriction fragment length polymorphism (T-RFLP), and relationships between bacterial community structure and groundwater chemistry, aquifer confinement and groundwater usage were explored. In addition, the results from this study were compared with a previous T-RFLP survey of the same area in an attempt to detect changes in bacterial community structure over time. The data obtained suggested that bacterial community structure was related to groundwater chemistry, especially to redox conditions. Species composition showed minimal variation over time if groundwater chemistry remained unchanged. These findings reflect the potential of using bacterial communities as biological indicators to evaluate the health of groundwater ecosystems. We suggest that it is important to include this type of broad bacterial diversity assessment criteria into regular groundwater monitoring activities.
Introduction
Groundwater is one of the most valuable natural resources around the globe. A large proportion of the world's population directly depends on groundwater for its water requirements. It is the world's major drinking water source, providing about 60% of drinking water in Europe, with an even greater percentage in individual countries and more than 80% in North Africa and the Middle East (Struckmeier et al. Citation2005; Steube et al. Citation2009). Groundwater plays a crucial role in urban and rural water supplies in New Zealand too, where nearly one quarter of the population uses groundwater as its major drinking water source. Groundwater also supplies a significant fraction of the requirements for the agricultural and industrial sectors (Daughney & Reeves Citation2005).
Due to this high demand, groundwater monitoring activities are extensively conducted throughout the world to assess quality and availability. However, the majority of these monitoring programmes are restricted to the evaluation of physical and chemical parameters as measures of groundwater quality. In recent years, there has been an increasing trend to consider groundwater not only as a valuable resource for human use, but also as a dynamic ecosystem. Therefore, in addition to chemical monitoring, assessments of ecological status, in some cases including the microbial component, have also been included into national groundwater monitoring policies in some parts of Europe and Australia (Steube et al. Citation2009; Griebler et al. Citation2010; Stein et al. Citation2010; Korbel & Hose Citation2011; Zhou et al. Citation2012; Korbel et al. Citation2013). It is likely that the microbial component plays an important role in subsurface ecosystems, including groundwater, as it provides the driving force for biogeochemical processes taking place in these environments (Falkowski et al. Citation2008). Therefore, the species composition of groundwater microbiota should be considered in groundwater monitoring programmes. For example, it is crucial to understand the groundwater microbial diversity in the absence of human influence (i.e. under baseline conditions) to enable identification of its relationships to anthropogenic pressures and other environmental factors (Larned Citation2012).
In New Zealand, groundwater monitoring is undertaken by many organisations, of which the various regional authorities are the most active. They operate state-of-the-environment (SOE) groundwater quality monitoring programmes within their own areas of jurisdiction and also collaborate in the operation of the National Groundwater Monitoring Programme (NGMP), which comprises 110 monitoring sites around the country (Daughney et al. Citation2012; Sirisena et al. Citation2013). The NGMP is a long-term research and monitoring programme that aims to identify spatial patterns and temporal trends in groundwater quality at the national scale and relate them to specific causes (Rosen Citation2001; Daughney & Reeves Citation2005, Citation2006; Morgenstern & Daughney Citation2012). The regional SOE programmes typically only assess the presence of coliform bacteria (mainly Escherichia coli) as a biological factor, because it is an indicator species of faecal contamination that can cause serious human health problems (Ministry for the Environment Citation2010; Greater Wellington Regional Council Citation2013).
A preliminary evaluation of microbial biodiversity in New Zealand's groundwater was conducted by van Bekkum et al. (Citation2006). In this pilot study, bacterial community structure was determined using 20 groundwater samples collected from bores around the Hutt Valley and Wairarapa regions. This work provided initial indications of relationships between bacterial community structure and groundwater chemistry. At the national scale, a more recent study evaluated the relative abundance of bacterial species in groundwater at all NGMP sites (Sirisena et al. Citation2013). This study revealed considerable microbial biodiversity in New Zealand groundwater, finding strong relationships between community structure and groundwater chemistry, in particular with regard to the influence of redox potential and the degree of human impact.
In the present study, we evaluated microbial biodiversity of groundwater in the Wairarapa Valley using one standard, culture independent, DNA-based molecular profiling tool: terminal restriction fragment length polymorphism (T-RFLP). It is widely believed that culturing methods do not reveal the full array of bacterial diversity in natural environmental samples because the majority of species present in such environments cannot be easily grown in artificial culture media (Zhou et al. Citation1997; Janssen et al. Citation2002; Neufeld & Mohn Citation2005; Lozupone & Knight Citation2007). Hence, T-RFLP is an alternative culture-independent, rapid, cost-effective and sensitive technique for characterisation of microbial community structure in environmental samples (Liu et al. Citation1997; Edlund et al. Citation2006; van Bekkum et al. Citation2006; Sirisena et al. Citation2013). Further, recent studies have demonstrated that T-RFLP can be highly effective, even as efficient as modern high throughput sequencing techniques in revealing bacterial community structure (Camarinha-Silva et al. Citation2012; Pilloni et al. Citation2012).
The present study has four objectives. The first is to explore the bacterial community structure in groundwater in parts of the Wairarapa Valley that were not previously investigated by van Bekkum et al. (Citation2006) or by Sirisena et al. (Citation2013). The second objective is to determine the regional-scale relationships between bacterial community structure and groundwater chemistry, aquifer confinement and groundwater bore usage, for comparison with the general conclusions drawn in the national-scale study of Sirisena et al. (Citation2013). The third objective of this study is to compare the present bacterial structure in the Wairarapa Valley groundwater with the results of van Bekkum et al. (Citation2006) in an attempt to measure changes in community structure over time. The fourth and final objective is to compare different approaches for analysis of T-RFLP data. At present, there is no commonly accepted best practice approach for the analysis of T-RFLP data (Blackwood et al. Citation2003). Thus, we have applied and compared two common methods for standardising T-RFLP peaks: (1) standardisation to the highest peak in the profile; and (2) standardisation to the sum of all peaks in the profile. We also used two common approaches to determine the similarity between T-RFLP profiles: (1) Euclidean distance; and (2) Bray-Curtis similarity. In summary, this study has the overarching goal of providing a solid foundation for more detailed explorations of bacterial diversity in New Zealand groundwater, to move towards inclusion of microbial status assessment criteria into regional and national monitoring programmes and related policies.
Materials and methods
Study area and groundwater sampling
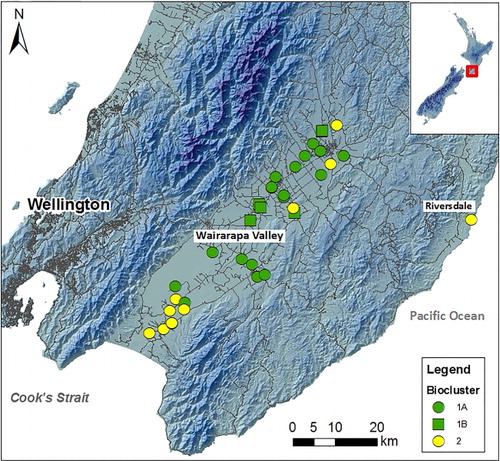
Groundwater samples were collected from 34 groundwater sampling sites across the Wairarapa Valley and one site from the Riversdale area which is located in the eastern coast of the Wellington region (see ), in conjunction with the routine quarterly groundwater quality monitoring conducted by the Greater Wellington Regional Council (GWRC). Of these 35 sites, five were previously studied by van Bekkum et al. (Citation2006). This provided an opportunity for a partial comparison of bacterial community structure over time.
Groundwater samples (single sample of 2 L from each site) were collected in September 2009 into individual sterilised plastic bottles according to the National Protocol for State of the Environment Groundwater Sampling (Daughney et al. Citation2006). All these containers were kept at 4 °C until they were used. Additional samples were collected by GWRC staff at the same time as a part of their routine groundwater monitoring operations. The samples were analysed by Hill Laboratories (Hamilton, New Zealand) for 28 chemical parameters (Na, K, Mg, Ca, Pb, Zn, B, HCO3, Cl, SO4, NO3-N, NO2-N, NH4-N, PO4-P, Fe, Mn, Br, F, SiO2, total dissolved solids [TDS], total organic carbon [TOC], alkalinity, total hardness, total cations, total anions, total oxidised nitrogen [TON], dissolved oxygen [DO] and free CO2) in accordance with standard analytical procedures (Daughney & Reeves Citation2005; Daughney et al. Citation2010; Tidswell et al. Citation2012). Electrical conductivity (EC) and pH were also measured in the field at the time of sampling. The hydrochemical data and site-specific data such as aquifer confinement and bore usage were obtained from GWRC and are summarised in SF Tables 1 and 2 respectively.
DNA extraction
Two litres of groundwater from each site were filtered through a sterile 0.22 µm nitrocellulose membrane filter (Millipore, Australia) using a vacuum system. The filters were stored at –20 °C in sterilised 50 mL plastic tubes until use. Extreme care was taken to avoid long storage periods and all groundwater filtrations and DNA extractions were carried out immediately as delays may alter the apparent microbial community composition in such samples (Gilpin et al. Citation2013). Bacterial genomic DNA extractions were performed using ZR Fungal/Bacterial DNA kits (Zymo Research, USA) as described in Sirisena et al. (Citation2013). Extracted DNA was resuspended in 100 µl of molecular biology grade water (MO BIO Laboratories, Inc., USA), quantified using Quant-iT™ High-Sensitivity DNA Assay kits (Invitrogen, USA) and stored at –20 °C until further use.
PCR amplification and T-RFLP analysis
The polymerase chain reaction (PCR) amplification and restriction enzyme digestion were performed as described in Sirisena et al. (Citation2013). A c. 1400 bp region of bacterial 16S rRNA gene was amplified using two fluorescently labelled bacterial specific oligonucleotide primers: F63 (5′-[6-FAM]CAG GCC TAA CAC ATG CAA GTC-3′) and R1389 (5′-[6-HEX]ACG GGC GGT GTG TAC AAG-3′). For T-RFLP analysis, 500 ng of purified PCR product was digested with 10 U of AluI restriction endonuclease (Roche, USA) in a total volume of 25 µL. Digested products were run on an ABI 3730XL DNA Analyzer (Applied Biosystems Inc., USA) along with a GeneScan™-400HD ROX™ internal size standard (Applied Biosystems Inc., USA) to separate and precisely determine the sizes of fluorescently labelled terminal restriction fragments (T-RFs) up to 400 bp in length. The resulting T-RFLP electropherograms were transformed to numerical barcodes using GeneMapper® v 3.1 software (Applied Biosystems Inc., USA). Binary presence (1) or absence (0), fragment sizes (bp) and heights corresponding to each peak were tabulated using a bin size of 1 bp.
Data analysis
The tabulated T-RFLP data output from GeneMapper® v 3.1 was prepared for quantitative analysis using the methods of Sirisena et al. (Citation2013). Briefly, decimal values associated with T-RF lengths (bp) were rounded to the nearest integer value using ± 0.5 bp as the binning threshold (i.e. to the nearest 1 bp). If two or more decimal fragment sizes were assigned to a single bin size after rounding, the heights of the peaks were summed as if they were a single peak. Further, FAM peaks below 21 bp, HEX peaks below 18 bp and both FAM and HEX peaks over 400 bp were eliminated from the analysis because these correspond to the lengths of the primers or are outside the calibration range of the internal size standard described above. A threshold of 200 relative fluorescence units (RFU) was used to separate true peaks from the background noise based on a negative control T-RFLP profile as described in Sirisena et al. (Citation2013).
In this study, we applied two of the most commonly used approaches to scale the peak heights of T-RFs in each profile: (1) peak heights were standardised relative to the highest peak in the profile (Parkinson Citation2004, Citation2009; van Bekkum et al. Citation2006); and (2) peak heights were standardised relative to the sum of all peaks in each profile (Culman et al. Citation2008).
The two separate sets of scaled peak heights were subjected to hierarchical cluster analysis (HCA), which is one of the most common approaches to evaluate the similarities between T-RFLP profiles. However, as there is no generally accepted distance measure used to perform HCA, we applied two of the most widely used metrics: (1) Euclidian distance (Dollhopf et al. Citation2001; Blackwood et al. Citation2003); and (2) Bray-Curtis similarity (Griebler et al. Citation2010; Stein et al. Citation2010). Based on the matrix of distance values obtained between each pair of samples, dendrograms were constructed using Ward's linkage method to display similarities between the samples (van Bekkum et al. Citation2006). The dendrogram showed those groups of samples having the most similar T-RFLP profiles; these clusters are hereafter referred to as ‘bioclusters’, as first described in Sirisena et al. (Citation2013). They demonstrated that a different number of bioclusters can be formed depending on the separation threshold applied, which should be selected to maximise distinction between the bioclusters while ensuring that each cluster contains enough samples to be representative of the population. They compared a range of thresholds that formed 3, 5, 7 or 11 clusters, as their study consisted of a relatively large number of samples (Sirisena et al. Citation2013). In the present study, we apply separation thresholds that resulted in formation of two or three bioclusters, as it appears to be the most appropriate according to the scale of the dataset. The robustness of the T-RFLP technique for this sort of environmental microbial study was demonstrated by using several combinations of the peak standardisation and distance measures.
The relationships between bioclusters and groundwater chemistry and categorical environmental parameters were evaluated as described in Sirisena et al. (Citation2013). The box-and-whisker plot representation was used to demonstrate the relationships between bioclusters and groundwater chemistry. Kruskal-Wallis tests were performed to reveal the statistical significance of these relationships. The cross-tabulation approach was used to reveal the links between bioclusters and categorical parameters such as aquifer confinement or groundwater bore usage. All statistical analyses were performed using the statistical programs R (v 2.15.0) and SPSS v 19 (SPSS IBM, New York, USA).
We applied four other statistical approaches for comparison to the above-listed data analysis methods employed by Sirisena et al. (Citation2013). First, non-metric multidimensional scaling (nMDS) (Kruskal Citation1964a,Citationb) was carried out with Bray-Curtis similarities, and we compared the nMDS clustering with the HCA pattern derived as described above. Second, permutational multivariate analysis of variance (PERMANOVA) test (Anderson et al. Citation2008) with 9999 permutations was used to verify whether the nMDS pattern is related to: (1) HCA clustering; (2) aquifer confinement categories; or (3) bore usage groups. Third, the RELATE analysis, a comparative Mantel-type test (Clark & Warwick Citation2001), was carried out to determine the relationship between bacterial diversity expressed by FAM T-RF structure and groundwater chemistry as a whole rather than individual parameters. Here, the hydrochemical data (x) were transformed to a natural log variable [ln (x+1)] in order to eliminate uneven values among different parameters. It is suggested that the Euclidian distance is more appropriate for grouping environmental data (hydrochemistry) (Ramette Citation2007). Therefore, two similarity matrices were computed: (1) the Euclidian distance matrix for the 30 hydrochemical parameters; and (2) Bray-Curtis similarity matrix based on FAM T-RFs. The RELATE analysis determined the correlation between the bacterial diversity and groundwater chemistry. Finally, canonical correspondence analysis (CCA) (ter Braak & Smilauer Citation2012) was also performed to evaluate the relative contribution of each hydrochemical parameter for shaping the microbial structure. These multivariate analyses were performed using the PRIMER v 6 statistical programme (Primer-E Ltd., Plymouth, UK) with the additional add-on package PERMANOVA+ (Anderson et al. Citation2008). The CCA was performed with CANOCO 5 for Windows package (ter Braak & Smilauer Citation2012).
For the quantitative representation of microbial diversity, Shannon diversity indices (H′) were calculated as H′ = −ΣPi ln(Pi), where Pi is the relative abundance of ith T-RF in a given profile (Griebler et al. Citation2010; Stein et al. Citation2010). These calculations were based on T-RF heights, standardised relative to the sum of all peaks in a given profile as this approach more appropriately describes the relative abundance. In this analysis, H′ values were determined separately for FAM and HEX T-RFs for all 35 samples individually and mean H′ scores were also calculated within each biocluster.
Results
Groundwater bacterial diversity
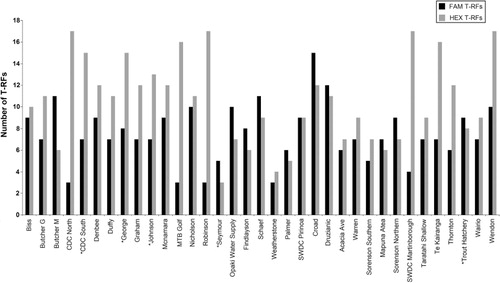
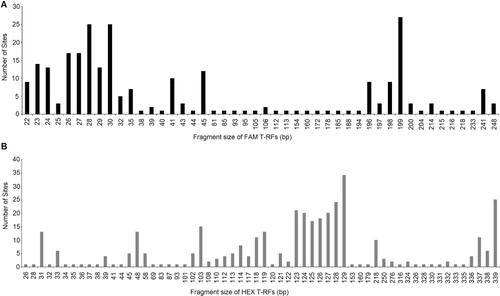
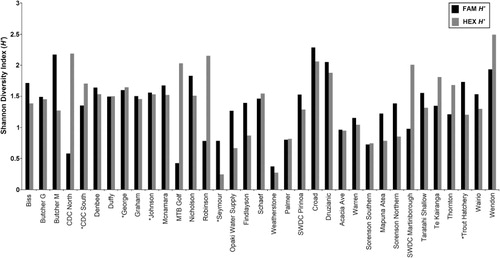
The T-RFLP analysis detected 46 and 60 total unique bacterial T-RFs for FAM and HEX respectively. The T-RFs ranged in size from 22 bp to 248 bp for FAM and from 26 bp to 339 bp for HEX. The total number of FAM T-RFs ranged from 3 to 15 in individual samples, and HEX T-RFs from 3 to 17 (). The frequency of each FAM and HEX T-RF (i.e. the number of sites at which a particular T-RF occurred) is shown in . The FAM peaks with fragment sizes of 28, 30 and 199 bp occurred with highest frequencies; 25, 25 and 27 profiles respectively. Similarly, HEX peaks corresponding to fragment sizes of 128, 129 and 339 bp were found in 24, 34 and 25 profiles respectively. However, because more than one taxon may be represented by any one peak, a single FAM or HEX T-RF may not precisely represent a single species. Nonetheless, they will still provide a valid comparative insight into species richness in combined analyses and can, therefore, be termed as operational taxonomic units (OTUs). The average Shannon diversity indices (H′) were 1.36 ± 0.47 for FAM OTUs (ranging from 0.37 to 2.29) and 1.39 ± 0.59 for HEX OTUs that varies from 0.24 to 2.49 ().
Validation of T-RFLP analysis
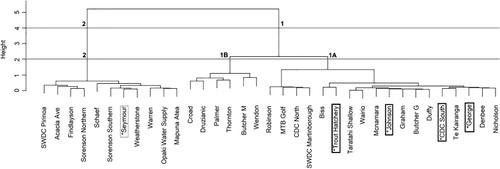
Hierarchical cluster analysis was performed with four different combinations of peak scaling method and distance measure as explained in ‘Materials and methods’: (1) T-RFs standardised to highest peak/Euclidean distance; (2) T-RFs standardised to highest peak/Bray-Curtis similarity; (3) T-RFs standardised to all peaks/Euclidean distance; and (4) T-RFs standardised to all peaks/Bray-Curtis similarity. The four resulting dendrograms showed only minimal differences in clustering patterns (SF Figure 1). At a distance threshold that results in the formation of three bioclusters (hereafter referred to as the 3-Cluster threshold), the composition of each biocluster (samples belonging to each cluster) was 100% identical for all four analysis methods described above. However, a slight difference in linkage pattern was revealed among the two peak standardisation approaches. If the three bioclusters are arbitrarily named as A, B and C, in methods 1 and 2, the cluster representation was A (B, C) at the 2-cluster threshold level (SF Figure 1A–B), whereas in methods 3 and 4, the pattern was (A, B) C at the 2-cluster threshold level (SF Figure 1C–D). However, the effect of the choice of similarity index was minimal on clustering for this dataset, as the two distance measures used in this study resulted in dendrograms with 100% similarity in linkage pattern and cluster composition. Given these minimal differences, a single cluster assignment obtained from analysis method 4 was chosen () for the presentation of results for the remainder of this report. The clusters formed at the 3-cluster threshold are henceforth referred to as bioclusters 1A, 1B and 2; these names are arbitrary but are selected to convey the relationship of the clusters to each other as depicted in .
Relationships between bacterial diversity and groundwater chemistry
The bioclusters at the 3-cluster threshold were compared with the 30 hydrochemical parameters (as listed in ‘Materials and methods’ and shown in SF Table 1). The Kruskal-Wallis test results showed that the bioclusters were significantly associated (P < 0.05) with Na, K, Mg, Ca, B, HCO3, Cl, SO4, NO3-N, NH4-N, Fe, F, TDS, total hardness, total cations, total anions, DO, TON, EC and alkalinity (SF Tables 3). Box-and-whisker plots ( and SF 2[a–d]) reflect qualitative aspects of these relationships. For example, bioclusters 1A and 1B were associated with low concentrations of NH4-N, Fe, Mn, NO2-N, PO4-P and Br and high concentrations of NO3-N and SO4 compared with biocluster 2. Biocluster 1A can be distinguished from 1B in that the latter is associated with lower concentrations of Na, K, Ca, Mg, HCO3, Cl and F. summarises each biocluster's association with different chemical parameters in terms of relative concentration ranges derived from the absolute values shown in and SF 2[a–d]. Overall, these results suggested that the groundwater bacterial community structure explained by the bioclusters has distinct relationships with groundwater chemistry.
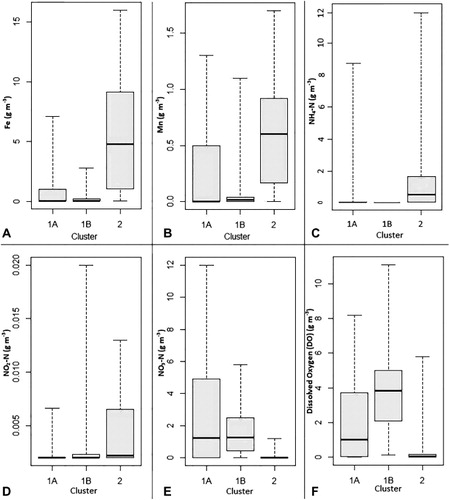
Table 1 Summary of the relative magnitudes of chemical parameters in each biocluster at 3-cluster threshold.
Relationships between bacterial diversity and environmental factors
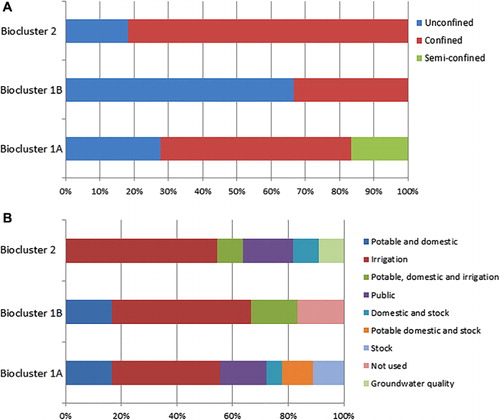
Cross-tabular representation demonstrated some interesting qualitative aspects of the relationships between bacterial community structure explained at 3-cluster threshold and aquifer confinement and groundwater bore usage (). The majority of sampling sites belonging to biocluster 1B were located in unconfined aquifers, whereas biocluster 2 contained the least number of sites in unconfined aquifers, and the highest number of sites in confined aquifers. The relationships between bioclusters and groundwater bore usage are not very distinct, as all three clusters contained groundwater bores used for potable, domestic, stock and irrigation purposes. However, it is interesting to note that the sites used for public purposes were not represented in biocluster 1B.
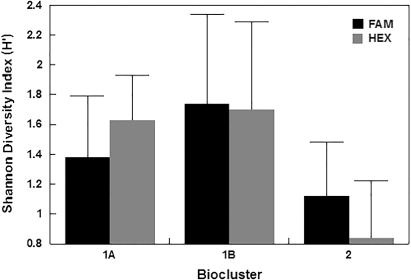
Mean Shannon diversity indices (H′) for each biocluster indicated the presence of a considerable difference of bacterial diversity among the three bioclusters. For both FAM and HEX OTUs, biocluster 1B represented the highest mean H′ while bioclusters 1A and 2 showed medium and the lowest mean diversity indices (). Overall, the additional statistical approaches applied in this study did not provide additional insights into the relationships between groundwater bacterial diversity and hydrochemistry, yet they strongly support the major findings inferred from HCA. The nMDS pattern was shown to be highly comparable to the HCA clustering. The PERMANOVA results also confirmed this observation (P = 0.0001). No significant relationships were found between nMDS clustering and aquifer confinement (P = 0.1407) or bore usage (P = 0.3278). The RELATE analysis confirmed that the groundwater chemistry is highly correlated with bacterial diversity explained by FAM T-RFs (P = 0.0184). The CCA results suggested that, among the 30 hydrochemical parameters, NO3-N, NO2-N and Fe were the main factors influencing the bacterial diversity represented by FAM T-RFs. Interestingly, NO3-N, NO2-N and Fe are three major factors contributing to the redox condition of the groundwater. This indicates that bacterial diversity is mainly influenced by the redox potential of groundwater, as previously determined on the basis of HCA and the Kruskal-Wallis test. The results of nMDS, PERMANOVA, RELATE and CCA are therefore not displayed.
Discussion
The results of this study indicate that considerable bacterial diversity was present in Wairarapa Valley groundwater. The biocluster representation provided a useful framework for evaluating the relationships between bacterial diversity and the chemistry of the groundwater. These were clearly identifiable, in particular, for the redox-sensitive substances such as Fe, Mn, NO3-N, NH4-N and SO4. Various species of bacteria can use different reduced forms of nitrogen (NH4+, NO2−), manganese (Mn2+), iron (Fe2+) and other redox-sensitive elements as reducing agents to reduce organic carbon, CO2 (carbon fixation), oxygen or any other more oxidised forms of nitrogen (NO3−), manganese (MnO4 −), iron (Fe3+) and sulphur (SO42−), through which they obtain energy (Chapelle Citation2000). The presence of high concentrations of NH4-N, NO2-N, Fe and Mn (reduced forms) and low concentrations of NO3-N, SO4, TON and DO (oxidized forms) in samples grouped into biocluster 2 indicated that the groundwaters in this cluster were more reduced than groundwater found at sites assigned to bioclusters 1A and 1B. The three bioclusters can also be differentiated by the amounts of TDS; where biocluster 2 showed the highest TDS in contrast with bioclusters 1A and 1B which have medium and low TDS respectively. In addition, biocluster 1B reflected relatively low NO3-N and TON concentrations compared with biocluster 1A, possibly indicating that sites assigned to biocluster 1B are less impacted by human activities in the aquifer recharge zone.
provides a summary of groundwater chemistry and aquifer features represented in each biocluster. Interestingly, the biocluster representation based on bacterial diversity was comparable to hydrochemical categories previously defined using groundwater chemistry, human impact and aquifer properties (Daughney & Reeves Citation2005). Our results suggest that the three bioclusters might provide bacterial community fingerprints for the relevant hydrochemical categories. In other words, oxidised vs. reduced and impacted vs. non-impacted groundwaters have characteristic bacterial populations, at least for the sites in the Wairarapa Valley that were sampled in this study. This is in agreement with the conclusions of the national survey of groundwater bacterial diversity by Sirisena et al. (Citation2013). The bacterial diversity in each biocluster represented by mean (H′) reveals that bioclusters 1A and 1B, with oxidised groundwater, have relatively high diversity compared with biocluster 2, which has a more reduced hydrochemical profile. This observation implies that the sites in bioclusters 1A and 1B may contain diverse bacterial groups such as sulphur oxidisers, nitrifying bacterial groups, iron oxidisers and hydrogen oxidisers which help to oxidise the reduced forms of the redox chemical components as described above. A majority of sites located in unconfined aquifers were assigned to bioclusters 1A and 1B, which contained oxidised groundwater. This is consistent with the relationship between groundwater chemistry and aquifer confinement previously noted by Daughney & Reeves (Citation2005). The bioclusters were not strongly related to groundwater bore usage; although none of the sites belonging biocluster 1B were used for public purposes, this should not be taken to indicate a causal relationship between bacterial diversity and bore usage.
Table 2 Summary of groundwater characteristics in each biocluster.
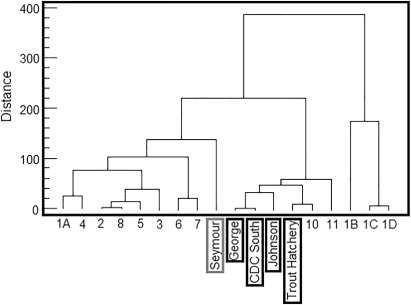
We were not able to collect samples from all the monitoring sites that were tested by van Bekkum et al. (Citation2006). However, we were able to re-test five of their previously sampled sites: Seymour; Trout Hatchery; Johnson; CDC South; and George. This provided an opportunity for partial comparison of the bacterial community structure in Wairarapa groundwater in 2006 and 2009. In the previous study by van Bekkum et al. (Citation2006), Seymour was clustered separately from the other four samples (). This pattern for these five samples remains similar in the present study, for all four T-RFLP data analysis combinations employed ( and SF 1). The study by van Bekkum et al. (Citation2006) differs from ours in several technical aspects. For example, T-RFLP was performed using tetrachloro-6-carboxy-fluorescine (TET) as the fluorescence label for reverse primer R1389 at the 5′ end, in contrast to 6-carboxyhexafluorescein (HEX) used in our study. In addition, they evaluated similarity between samples using the common area index (CAI), whereas Euclidean distance and Bray-Curtis similarity were used in the present study. Again, we interpret the similarities of the two sets of result as providing further evidence to demonstrate that the T-RFLP technique is a robust and reliable molecular profiling tool (i.e. that it produces results that are largely independent of the data analysis methods and experimental conditions employed), at least for a study of the scale undertaken in this work. We note that all the chemical parameters remained very similar at each site in 2009 compared with 2006 (SF Table 4). This implies that the bacterial diversity of the groundwater may have remained constant over time in part because the groundwater chemistry also remained constant over time, although we acknowledge that more data are required to robustly determine the direction of causality of such relationships.
The T-RFLP methodology used in this work provides a reliable and rapid molecular profiling tool that can be used in future studies to investigate the bacterial community structure in groundwater. The comparison between HCAs performed using four different combinations of data analysis approaches suggests that HCA appeared to be relatively insensitive to T-RF scaling method and distance measure used, at least for the data considered in this study. Therefore, HCA can be effectively used as a robust technique to compare similarities between T-RFLP profiles. However, it remains to be seen whether other T-RF datasets would also show the same properties with respect to the methods used for peak scaling and distance (similarity) measurement, and we recommend that a similar comparison of data analysis methods should be undertaken for future studies of this type. Similarity of dendrograms shows our data are robust regardless of data analysis method. Indeed, this may be a general feature of the T-RFLP approach which may go some way towards explaining why no single standardised method/distance metric has so far been adapted for widespread use.
We note that several different methods are available for statistical analysis of datasets such as that collected in this study. Following Sirisena et al. (Citation2013), we employed HCA, box-whisker plots, the Kruskal-Wallis test and crosstabulation. For comparison, we also applied several independent techniques (nMDS, PERMANOVA, RELATE and CCA). The fact that the results were highly comparable gives credibility to the conclusions drawn. Given that this similarity of results from different techniques may not extend to other studies, we recommend that independent techniques should be applied for validation of inferences made in future investigations of this type.
We also note that different molecular profiling tools could be applied in such studies. It is hard to argue that one molecular profiling tool is better than the others as each technique has its own advantages and drawbacks. For example, the automated ribosomal intergenic spacer analysis (ARISA) approach is another popular molecular tool that can be effectively used in microbial community analyses (Lear et al. Citation2013; Washington et al. Citation2013). But one of the issues in the ARISA methodology is that it is possible to produce PCR products with same length for different species. The T-RFLP technique is susceptible to the same drawback as different species may generate T-RFs with same length. However, in T-RFLP, two fluorescently labelled primers can be used to minimise this problem by generating one or two signals for any one species. As this is a part of an integrated project investigating the bacterial diversity in New Zealand groundwater, we have used T-RFLP as our choice of method to be consistent with the past study by Sirisena et al. (Citation2013). However, we suggest that it would be a good future prospect to compare T-RFLP and ARISA in terms of cost-effectiveness and information obtained.
As the primary objective of this study was strictly to understand the microbial state of groundwater itself, we did not attempt to analyse the microbial diversity of the aquifer materials. However, it is evident that bacterial diversities in groundwater and the aquifer, from which they are derived, may differ from each other and that the two communities may have mutual interactions (Alfreider et al. Citation1997; Lehman & O'Connell Citation2002; Flynn et al. Citation2008; Griebler & Lueders Citation2009). Therefore, a future extension of this study could be to evaluate bacterial communities of the aquifers themselves and attempt to gain a better understanding of their interactions with bacterial communities in the groundwater, taking these as being two distinct components of the groundwater ecosystem. We note, however, that it is much more cost-effective to collect samples of groundwater than to collect aquifer materials directly, and characterisation of microbial community structure in the groundwater itself is likely most promising for routine SOE monitoring.
Although T-RFLP is a suitable technique for this sort of rapid explorative study, it does not provide taxonomic information about those bacterial species that are present in these groundwater ecosystems (Wood et al. Citation2013). In addition, the resolution of the technique may not be powerful enough to recognise the least abundant species in the environment (Pilloni et al. Citation2012). Thus, another future extension of this study could be to apply modern metagenomics approaches based on high-throughput DNA sequencing in an attempt to obtain taxonomic information and capture the microbial biodiversity that is not revealed by T-RFLP.
In summary, the findings of this study indicate that the bacterial diversity of groundwater is mainly related to groundwater chemistry. Further, the diversity is stable over timescales of a few years, at least when the groundwater chemistry also remains stable over the same period. These findings reflect the potential of using bacterial communities as biological indicators to evaluate the health of groundwater ecosystems, beyond what may be inferred from chemical or geological information alone. Therefore, we suggest that it would be worthwhile to include broad bacterial diversity assessment criteria into regular groundwater monitoring activities, as opposed to the current practice whereby bacterial monitoring of groundwater is restricted to indicator species for faecal contamination.
Supplementary files
Supplementary files 1-6: Supporting information and details of statistical analyses.
Supplementary file 1: Figure 1. Dendrograms of the hierarchical cluster analyses performed with different combinations of peak scaling methods and distance measures.
Supplementary file 2: Figure 2. (a) Box-and-whisker plot comparisons of concentrations of SO4, total dissolved solids, total oxidised nitrogen, Na, K and Mg across bioclusters defined at the 3-cluster threshold. (b) Box-and-whisker plot comparisons of concentrations of Ca, B, HCO3, Cl, Br and F across bioclusters defined at the 3-cluster threshold. (c) Box-and-whisker plot comparisons of concentrations of PO4-P, SiO2, alkalinity, total hardness, total cations and total anions across bioclusters defined at the 3-cluster threshold. (d) Box-and-whisker plot comparisons of electrical conductivity, acidity, free CO2, total organic carbon, concentrations of Pb and Zn across bioclusters defined at the 3-cluster threshold.
Supplementary file 3: Table 1. Concentration values of 30 hydrochemical parameters at each groundwater monitoring site in the September 2009 sampling round.
Supplementary file 4: Table 2. Summary of geographical location (in northing and easting), aquifer confinement and usage of groundwater of the GWRC sampling sites.
Supplementary file 5: Table 3. Summary of P values (95.0% confidence level, n = 35, d.f. = 34) of Kruskal–Wallis tests for each chemical parameter at the 3- and 2-cluster thresholds.
Supplementary file 6: Table 4. Summary of groundwater chemistry at GWRC sampling sites included in both van Bekkum et al. (Citation2006) study and present study.
Supporting information and details of statistical analyses.
Download MS Word (859.6 KB)Acknowledgements
The authors would like to thank Sheree Tidswell and all the groundwater research staff members of the Greater Wellington Regional Council for their valuable support in sample collection and for providing hydrochemical data and site-specific environmental information. The authors would also like to thank Craig Cary (University of Waikato, Hamilton, New Zealand) and Els Mass (National Institute of Water and Atmospheric Research, Wellington, New Zealand) for their useful advice regarding T-RFLP data analyses; Dalice Sim (Victoria University of Wellington, Wellington, New Zealand) for advice on statistical analyses; and the two anonymous reviewers for their constructive suggestions to improve the quality of the manuscript. This project was financially supported by public research funding provided to GNS Science by the Government of New Zealand.
References
- Alfreider A, Krossbacher M, Psenner R 1997. Groundwater samples do not reflect bacterial densities and activity in subsurface systems. Water Research 31: 832–840. 10.1016/S0043-1354(96)00311-9
- Anderson MJ, Gorley RN, Clarke KR 2008. PERMANOVA+ for PRIMER: guide to software and statistical methods. Plymouth, PRIMER-E Ltd.
- Blackwood CB, Marsh T, Kim SH, Paul EA 2003. Terminal restriction fragment length polymorphism data analysis for quantitative comparison of microbial communities. Applied and Environmental Microbiology 69: 926–932. 10.1128/AEM.69.2.926-932.2003
- Camarinha-Silva A, Wos-Oxley ML, Jáuregui R, Becker K, Pieper DH 2012. Validating T-RFLP as a sensitive and high-throughput approach to assess bacterial diversity patterns in human anterior nares. FEMS Microbiology Ecology 79: 98–108. 10.1111/j.1574-6941.2011.01197.x
- Chapelle FH 2000. The significance of microbial processes in hydrogeology and geochemistry. Hydrogeology Journal 8: 41–46. 10.1007/PL00010973
- Clarke KR, Warwick RM 2001. Change in marine communities: an approach to statistical analysis and interpretation. Plymouth, PRIMER-E Ltd.
- Culman SW, Gauch HG, Blackwood CB, Thies JE 2008. Analysis of T-RFLP data using analysis of variance and ordination methods: a comparative study. Journal of Microbiological Methods 75: 55–63. 10.1016/j.mimet.2008.04.011
- Daughney CJ, Jones A, Baker T, Hanson C, Davidson P, Zemansky GM et al. 2006. A national protocol for state of the environment groundwater sampling in New Zealand: ME 781. Wellington, Ministry for the Environment.
- Daughney CJ, Morgenstern U, van der Raaij R, Reeves RR 2010. Discriminant analysis for estimation of groundwater age from hydrochemistry and well construction: application to New Zealand aquifers. Hydrogeology Journal 18: 417–428. 10.1016/j.mimet.2008.04.011
- Daughney CJ, Raiber M, Moreau-Fournier M, Morgenstern U, van der Raaij R 2012. Use of hierarchical cluster analysis to assess the representativeness of a baseline groundwater quality monitoring network: comparison of New Zealand's national and regional groundwater monitoring programs. Hydrogeology Journal 20: 185–200. 10.1007/s10040-011-0786-2
- Daughney CJ, Reeves RR 2005. Definition of hydrochemical facies in the New Zealand groundwater monitoring programme. Journal of Hydrology (New Zealand) 44: 105–130.
- Daughney CJ, Reeves RR 2006. Analysis of temporal trends in New Zealand's groundwater quality based on data from the National Groundwater Monitoring Programme. Journal of Hydrology (New Zealand) 45: 41–62.
- Dollhopf SL, Hashsham SA, Tiedje TM 2001. Interpreting 16S rDNA T-RFLP data: application of self-organizing maps and principal component analysis to describe community dynamics and convergence. Microbial Ecology 42: 495–505. 10.1007/s00248-001-0027-7
- Edlund A, Soule T, Sjöling S, Jansson JK 2006. Microbial community structure in polluted Baltic Sea sediments. Environmental Microbiology 8: 223–232. 10.1111/j.1462-2920.2005.00887.x
- Falkowski PG, Fenchel T, Delong EF 2008. Microbial engines that derived earth's biogeochemical cycles. Science 320: 1034–1038. 10.1126/science.1153213
- Flynn TM, Sanford RA, Bethke CM 2008. Attached and suspended microbial communities in a pristine confined aquifer. Water Resources Research 44: W07425. 10.1029/2007WR006633
- Gilpin B, Devane M, Nourozi F, Robson B, Scholes P, Lin S 2013. Recommendations for the processing and storage of water samples before polymerase chain reaction (PCR) analysis. New Zealand Journal of Marine and Freshwater Research 47: 582–586. 10.1080/00288330.2013.797915
- Greater Wellington Regional Council 2013. Groundwater quality. Wellington, Greater Wellington Regional Council. www.gw.govt.nz/groundwater-2/ (accessed 7 October 2013).
- Griebler C, Lueders T 2009. Microbial biodiversity in groundwater ecosystems. Freshwater Biology 54: 649–677. 10.1111/j.1365-2427.2008.02013.x
- Griebler C, Stein H, Kellermann C, Berkhoff S, Brielmann H, Schmidt S et al. 2010. Ecological assessment of groundwater ecosystems – vision or illusion? Ecological Engineering 36: 1174–1190. 10.1016/j.ecoleng.2010.01.010
- Janssen PH, Yates PS, Grinton BE, Taylor PM, Sait M 2002. Improved culturability of soil bacteria and isolation in pure culture of novel members of the divisions Acidobacteria, Actinobacteria, Proteobacteria, and Verrucomicrobia. Applied and Environmental Microbiology 68: 2391–2396. 10.1128/AEM.68.5.2391-2396.2002
- Korbel KL, Hancock PJ, Serov P, Lim RP, Hose GC 2013. Groundwater ecosystems vary with land use across a mixed agricultural landscape. Journal of Environmental Quality 42: 380–390. 10.2134/jeq2012.0018
- Korbel KL, Hose GC 2011. A tiered framework for assessing groundwater ecosystem health. Hydrobiologia 661:329–349. 10.1007/s10750-010-0541-z
- Kruskal JB 1964a. Multidimensional-scaling by optimizing goodness of fit to a nonmetric hypothesis. Psychometrika 29: 1–27. 10.1007/BF02289565
- Kruskal JB 1964b. Nonmetric multidimensional scaling – a numerical method. Psychometrika 29: 115–129. 10.1007/BF02289694
- Larned ST 2012. Phreatic groundwater ecosystems: research frontiers for freshwater ecology. Freshwater Biology 57: 885–906. 10.1111/j.1365-2427.2012.02769.x
- Lear G, Washington V, Neale M, Case B, Buckley H, Lewis G 2013. The biogeography of stream bacteria. Global Ecology and Biogeography 22: 544–554. 10.1111/geb.12046
- Lehman RM, O'Connell SP 2002. Comparison of extracellular enzyme activities and community composition of attached and free-living bacteria in porous medium columns comparison of extracellular enzyme activities and community composition of attached and free-living bacteria in porous medium columns. Applied and Environmental Microbiology 68: 1569–1575. 10.1128/AEM.68.4.1569-1575.2002
- Liu W, Marsh TL, Cheng H, Forney LJ 1997. Characterization of microbial diversity by determining terminal restriction fragment length polymorphisms of genes encoding 16S rRNA. Applied and Environmental Microbiology 63: 4516–4522.
- Lozupone CA, Knight R 2007. Global patterns in bacterial diversity. Proceedings of the National Academy of Sciences USA 104: 11436–11440. 10.1073/pnas.0611525104
- Ministry for the Environment 2010. Faecal pollution (bacteria) in groundwater. Wellington, Ministry for the Environment. www.mfe.govt.nz/environmental-reporting/fresh-water/groundwater-quality-indicator/faecal-pollution.html (accessed 7 October 2013).
- Morgenstern U, Daughney CJ 2012. Groundwater age for identification of baseline groundwater quality and the impacts of land-use intensification – the national groundwater monitoring programme of New Zealand. Journal of Hydrology 456/457: 79–93. 10.1016/j.jhydrol.2012.06.010
- Neufeld JD, Mohn WW 2005. Unexpectedly high bacterial diversity in arctic tundra relative to boreal forest soils, revealed by serial analysis of ribosomal sequence tags. Applied and Environmental Microbiology 71: 5710–5718. 10.1128/AEM.71.10.5710-5718.2005
- Parkinson R 2004. Forensic DNA profiling of bacterial communities in soil. Unpublished MSc thesis. Wellington, Victoria University of Wellington.
- Parkinson R 2009. Bacterial communities associated with human decomposition. Unpublished PhD thesis. Wellington, Victoria University of Wellington.
- Pilloni G, Granitsiotis MS, Engel M, Lueders T 2012. Testing the limits of 454 pyrotag sequencing: reproducibility, quantitative assessment and comparison to T-RFLP fingerprinting of aquifer microbes. PLoS ONE 7: e40467. 10.1371/journal.pone.0040467
- Ramette A 2007. Multivariate analyses in microbial ecology. FEMS Microbiology Ecology 62: 142–160. 10.1111/j.1574-6941.2007.00375.x
- Rosen MR 2001. Hydrochemistry of New Zealand's aquifers. In: Rosen MR, White PA eds. Groundwaters of New Zealand. Wellington, The New Zealand Hydrological Society. Pp. 77–110.
- Sirisena KA, Daughney CJ, Moreau-Fournier M, Ryan KG, Chambers GK 2013. National survey of molecular bacterial diversity of New Zealand groundwater: relationships between biodiversity, groundwater chemistry and aquifer characteristics. FEMS Microbiology Ecology 86: 490–504. 10.1111/1574-6941.12176
- Stein H, Kellermann C, Schmidt SI, Brielmann H, Steube C, Berkhoff SE et al. 2010. The potential use of fauna and bacteria as ecological indicators for the assessment of groundwater quality. Journal of Environmental Monitoring 12: 242–254. 10.1039/b913484k
- Steube C, Richter S, Griebler C 2009. First attempts towards an integrative concept for the ecological assessment of groundwater ecosystems. Hydrogeology Journal 17: 23–35. 10.1007/s10040-008-0346-6
- Struckmeier W, Rubin Y, Jones JAA 2005. Groundwater - reservoir for a thirsty planet? Earth sciences for society; a prospectus for a key theme of the international year of planet earth. Trondheim, IUGS International Union of Geological Sciences Secretariat, Geological Survey of Norway.
- ter Braak CJF, Smilauer P 2012. Canoco reference manual and user's guide: software for ordination, version 5.0. Ithaca, Microcomputer Power. 496 p.
- Tidswell S, Conwell C, Milne JR 2012. Groundwater quality in the Wellington region: state and trends. Publication No. GW/EMI-T-12/140. Wellington, Greater Wellington Regional Council.
- van Bekkum M, Sainsbury JP, Daughney CJ, Chambers GK 2006. Molecular analysis of bacterial communities in groundwaters from selected wells in the Hutt Valley and the Wairarapa, New Zealand. New Zealand Journal of Marine and Freshwater Research 40: 91–106. 10.1080/00288330.2006.9517405
- Washington VJ, Lear G, Neale MW, Lewis GD 2013. Environmental effects on biofilm bacterial communities: a comparison of natural and anthropogenic factors in New Zealand streams. Freshwater Biology 58:2277–2286.
- Wood S, Smith K, Banks J, Tremblay LA, Rhodes L, Mountfort D et al. 2013. Molecular genetic tools for environmental monitoring of New Zealand's aquatic habitats, past, present and the future. New Zealand Journal of Marine and Freshwater Research 47: 90–119. 10.1080/00288330.2012.745885
- Zhou J, Davey ME, Figueras JB, Rivkina E, Gilichinsky D, Tiedje JM 1997. Phylogenetic diversity of a bacterial community determined from Siberian tundra soil DNA. Microbiology 143: 3913–3919. 10.1099/00221287-143-12-3913
- Zhou Y, Kellermann C, Griebler C 2012. Spatio-temporal patterns of microbial communities in a hydrologically dynamic pristine aquifer. FEMS Microbiology Ecology 81: 230–242. 10.1111/j.1574-6941.2012.01371.x