
ABSTRACT
Understanding species distributions, and how they change in space and time, is vital when prioritising conservation or management initiatives. We assessed the distribution and density patterns of common dolphins (Delphinus sp.), bottlenose dolphins (Tursiops truncatus) and Bryde’s whales (Balaenoptera edeni) in the Hauraki Gulf, New Zealand. Dedicated boat-based surveys were conducted in the inner Hauraki Gulf (IHG) and off Great Barrier Island (GBI) during 2010–2012. Generalised linear models were used to investigate temporal changes in relative densities and kernel density estimation was implemented to examine spatial trends. Common dolphins were widely distributed during all seasons, with higher densities observed during winter and spring in the IHG but during autumn off GBI. There was inter-annual variation in Bryde’s whale distribution, with high densities recorded off GBI in 2011. Bottlenose dolphins were infrequently sighted in the IHG but regularly encountered off GBI, with the highest densities during spring and summer.
Introduction
Understanding the distribution or geographical range of a species is a key factor when attempting to prioritise conservation or management initiatives (Ando et al. Citation1998; Brooks et al. Citation2001; Fortin et al. Citation2005). In the Hauraki Gulf, New Zealand, current management strategies include the Hauraki Gulf marine spatial plan (Sea Change—Tai Timu Tai Pari, www.seachange.org.nz), the first marine spatial plan for New Zealand that aims to provide a strong framework to guide the management of the Hauraki Gulf and its resources. The identification of hotspots or key habitats for species is an integral part of the planning process.
The three most frequently sighted cetacean species in the Hauraki Gulf are common dolphins (Delphinus sp.), Bryde’s whales (Balaenoptera edeni) and bottlenose dolphins (Tursiops truncatus). Under the New Zealand Threat Classification System, Bryde’s whales are listed as ‘Nationally Critical’ due to their small population size and limited distribution in New Zealand waters (Baker et al. Citation2010). One of the most significant threats to Bryde’s whales using the Hauraki Gulf is the high level of mortality due to ship strike (Stockin et al. Citation2008a; Behrens Citation2009; Constantine et al. Citation2015). Bottlenose dolphins are classified as ‘Nationally Endangered’ based on total abundance and apparent local declines in two of the three coastal populations (Baker et al. Citation2010), with high calf mortality also reported (Currey et al. Citation2009; Tezanos-Pinto et al. Citation2013). Common dolphins are not considered to be threatened, although have been qualified as ‘data poor’ (Baker et al. Citation2010). However, the species still requires management given the anthropogenic influences such as tourism, fisheries by-catch and pollution that have been reported for the population (Stockin & Orams Citation2009). Our preliminary understanding of the distribution of these three species originates from previous studies conducted primarily within inner Hauraki Gulf (IHG) waters (see for the inner and outer Hauraki Gulf boundary). The occurrence of common dolphins in the IHG has been described in relation to environmental parameters (Stockin et al. Citation2008b); however, spatial distribution and density have not been previously assessed. The same parameters remain unexamined for bottlenose dolphins using Hauraki Gulf waters, with only one species-specific study published for the IHG region that focused on photo-identification (Berghan et al. Citation2008). The distribution of Bryde’s whales in the Hauraki Gulf has been assessed in a number of studies; however, these were mainly based on data collected from platforms of opportunity that had limited operating ranges that excluded Firth of Thames or Great Barrier Island (GBI) waters (Behrens Citation2009; Wiseman et al. Citation2011; Riekkola Citation2013).
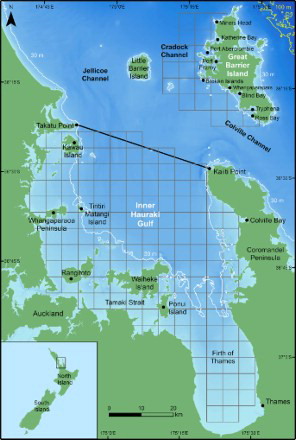
Figure 1. Map of the Hauraki Gulf, New Zealand. The solid black line (from Takatu Point to Kaiiti Point) indicates the boundary between the inner and outer Hauraki Gulf, the white lines show the 30 m isobath and the yellow lines the 100 m isobath. Bathymetry is depicted with darker shades of blue representing deeper waters (data courtesy of NIWA; Mackay et al. Citation2012). 5 × 5 km grid cells are shown in grey. Inset: location of the Hauraki Gulf, North Island, relative to New Zealand.
Great Barrier Island, the largest of New Zealand’s northern offshore islands (285 km2), is located in the outer Hauraki Gulf (). Until recently (see Dwyer Citation2014; Dwyer et al. Citation2014), dedicated marine mammal research conducted in the GBI region has been limited to baleen whale acoustics (Kibblewhite et al. Citation1967; Helweg Citation1998; McDonald Citation2006). Aerial surveys for Bryde’s whales were conducted in northeastern New Zealand waters between 1999 and 2003 (Baker & Madon Citation2007), with a small portion of the Hauraki Gulf transects covering waters off the west coast of GBI. No delphinid studies had been conducted in the area, possibly due to the logistical constraints of fieldwork in this comparatively remote location.
Here, we describe the geographic distribution and density patterns of common and bottlenose dolphins and Bryde’s whales occurring in both inner and outer Hauraki Gulf waters, the latter off the west coast of GBI. The overall aim was to define areas that may be of particular importance for each species (spatially or temporally) and provide new information about previously unstudied regions such as the Firth of Thames and GBI. Changes in temporal relative densities were investigated for both the number of groups and number of individuals of each species. Spatial distribution and density patterns were assessed based on numbers of individuals. By conducting dedicated boat-based surveys during a concurrent time period in the IHG and off GBI, resulting patterns could be compared between regions.
Materials and methods
Study area
The Hauraki Gulf is a relatively shallow, semi-enclosed body of water on the northeast coast of the North Island, New Zealand (; Manighetti & Carter Citation1999; Black et al. Citation2000). Circulation in the Hauraki Gulf is strongly influenced by surface winds and their interaction with tidal currents, in addition to physical barriers such as headlands and islands that enhance local upwellings (Black et al. Citation2000). Warm waters from the East Auckland Current (EAUC) flow into the northerly entrance of the Hauraki Gulf during summer and autumn, when easterly winds and downwellings are more prevalent (Zeldis et al. Citation2004). Westerly winds that are favourable for upwellings prevail in late winter and spring (e.g. Chang et al. Citation2003; Zeldis et al. Citation2004). In this study, the dividing line between inner and outer Hauraki Gulf waters was between Takatu Point on the mainland and Kaiiti Point on the Coromandel Peninsula (). The IHG sampling area included all waters south of the delineating line and covered 3480 km2. The 542 km2 GBI study site1 in the outer Gulf mainly incorporated the coastal waters off the western side of the island (i.e. all waters between Miners Head in the north and Ross Bay in the south, up to a distance of 10 km offshore; ).
Data collection
Cetacean sighting data were collected during dedicated year-round boat surveys conducted between January 2010 and November 2012 from Te Epiwhania, a 5.5 m Stabicraft boat powered by a 100 hp four-stroke engine. A non-systematic survey design was employed to maximise survey effort, since the geography of the Hauraki Gulf would allow some areas but not others to be surveyed in certain weather conditions. Survey tracks and the direction of travel were based on prevailing weather and sea conditions, and on the extent to which any particular area had been previously surveyed within each month. The aim was for equal coverage across the study area each month. It was not possible to account for all types of sampling bias resulting from survey design (e.g. variance in encounter rates because of density gradients; Dawson et al. Citation2008); however, protocols were followed to minimise sampling bias where possible. Surveys were conducted in conditions of Beaufort sea state 3 or less and vessel speed was maintained at c. 10 knots when actively searching for marine mammals. Search time along survey tracks was classified as ‘on effort’.
Starting in January 2011, monthly research trips averaging 4 days in duration were made to GBI when possible (i.e. when weather and sea conditions permitted). Where feasible, routes were selected to achieve equal survey coverage of the west coast and to include both nearshore and offshore waters up to 10 km from land within any given month. Effort was also made to survey the latitudinal extent of the GBI west coast in order to cover both northern and southern regions during any given day.
While ‘on effort’, two experienced observers continuously scanned to the horizon in a 270° arc in front of and to the sides of the vessel. Marine mammals were detected by the naked eye and/or binoculars (10 × 50 magnification), the latter used for scanning for bottlenose dolphins very close to shore. Visual clues indicating cetacean presence included splashing, water disturbance and sighting of blows or dorsal fins (e.g. Stockin et al. Citation2008b; Wiseman et al. Citation2011). When the vessel left the survey track to approach cetaceans, the survey mode was ‘off effort’ until returning to the track to resume searching. ‘Off effort’ mode also included all other occasions when the vessel was away from the survey track (e.g. returning to harbour due to deteriorating sea conditions).
When a cetacean group/individual was detected, the vessel stopped on the transect line to record the sighting cue and estimated distance to the sighting from the vessel. The vessel subsequently left the track (i.e. ‘off effort’), approached to within 50 m of the group/individual, and commenced data collection. After observational data were logged, the vessel returned to the survey route and resumed ‘on effort’ in order to continue searching for independent groups or individuals (i.e. spatially and/or temporally separated to prevent the same individuals becoming resampled; Stockin et al. Citation2009).
All observational and environmental data were collected using an XDA Orbit II Windows Mobile device. CyberTracker version 3 software (Steventon et al. Citation2002) was programmed for logging observational data (e.g. group size) and to record the GPS position of the vessel every 60 s throughout the survey. Beaufort sea state was recorded every 15 min.
Group size was visually assessed and recorded for each encounter. A group of dolphins was defined as any number of individuals observed in apparent association, moving in the same general direction and often, but not always, engaged in the same activity (Shane Citation1990). By taking into account the distance travelled and time elapsed between encounters, groups were considered independent if the same individuals could not be resampled on the same day. Where feasible, this was additionally confirmed via photo-identification. A group of whales was defined as the maximum number of individuals within 100 m of each other (Wiseman Citation2008). Group size was recorded at sea using minimum, maximum and best estimate counts (following Kiszka et al. Citation2007) and was later confirmed or amended using photo-identification (Würsig & Jefferson Citation1990) where applicable.
Data analysis
Austral seasons were defined as summer (December to February), autumn (March to May), winter (June to August) and spring (September to November) to facilitate comparisons with previous studies of common dolphins (Stockin et al. Citation2008b), bottlenose dolphins (Berghan et al. Citation2008) and Bryde’s whales (Wiseman et al. Citation2011) in the Hauraki Gulf. Only ‘on effort’ sighting data were included in analyses and ‘best estimate’ group sizes were used. Analyses were carried out in R version 3.1.2 (R Core Team Citation2014) unless otherwise stated. The significance level was set at 0.05.
Effort
Grids of 5 × 5 km cells were created for the IHG and GBI. Search effort was quantified by calculating the number of kilometres of effort per grid cell per survey day using ArcGIS version 10.0 (ESRI) and Geospatial Modelling Environment (GME) version 0.7.2.0 (Beyer Citation2012). The New Zealand Transverse Mercator (NZTM2000) projection was used for all GIS analyses. Any grid cell that contained less than 10 km of effort, or was sampled on fewer than five occasions during the study period, was removed from the analysis and any sightings associated with those tracks were reclassified as ‘off effort’. Consequently, waters between the northern limit of the IHG and southerly boundary of the GBI study area did not receive sufficient survey effort to be included in analyses. This was mainly due to less favourable sea conditions in the area because of increased exposure to oceanic swells and strong tidal currents.
Group size
‘On effort’ group sizes of common and bottlenose dolphins and Bryde’s whales were analysed at a seasonal level to help investigate differences in any resulting temporal or spatial density patterns. Linear models were used to examine changes in group size according to season. When the assumptions of linear models were violated, generalised linear models (GLMs) were fitted using a Poisson distribution or a negative binomial distribution if there was evidence of overdispersion.
Temporal relative density
The relative densities of dolphins and whales were assessed using sighting rate (SR) and encounter rate (ER) indices. These types of relative abundance indices have been used in a number of cetacean studies to make comparisons among different areas or to monitor changes in populations over time (e.g. Bearzi et al. Citation2005; De Boer Citation2010; Filby et al. Citation2010; Blasi & Boitani Citation2012). Densities were relative and not absolute because detection parameters were not included. SR (number of groups encountered per kilometre travelled) and ER (number of individuals encountered per kilometre travelled) were calculated using the ratio n/L, where n is the number of groups or individuals and L is the number of kilometres spent ‘on effort’ (Forcada & Hammond Citation1998; Bearzi et al. Citation2005; Cañadas et al. Citation2005) within the study area. Both SR and ER were calculated for common and bottlenose dolphins in this study to facilitate comparisons with other studies that only used one or the other of these indices. SR and ER were not expected to vary greatly for Bryde’s whales due to primarily sighting singletons, therefore only ER was reported here for whales.
Seasonal SR and ER were calculated by combining the total number of sightings/individuals and the total number of kilometres for each austral season. The sampling variance of the seasonal SRs and ERs was calculated using the formula (Buckland et al. Citation1993, Bearzi et al. Citation2005):where n is the total number of groups or individuals in a season, L is the total number of kilometres spent ‘on effort’ in a season, ni is the number of groups or individuals in a survey day, li is the number of kilometres spent ‘on effort’ in a survey day and k is the number of days surveyed in a season. Histograms were plotted to visually assess intra- and inter-annual patterns. Mean SR and ER values for each species and region were also calculated using each seasonal SR or ER to enable comparisons with other studies.
GLMs with a log-link function and Poisson error distribution were used to examine the seasonal or annual differences in the number of groups and individuals sighted in the IHG and off GBI. The response variable was the number of groups or individuals per survey day. The effects of season and year and any interaction between these two explanatory variables were investigated. As survey effort differed across seasons and years, effort was fit as an offset variable in the models. A negative binomial GLM was fit if there was evidence of overdispersion, which was determined using a deviance goodness-of-fit test and examining the dispersion parameter of a quasi-Poisson model.
Spatial relative density
Kernel density estimates are often used to estimate the home ranges of animals (Moland et al. Citation2011; Monsarrat et al. Citation2013). Here, they were applied as a measure of the relative use of space as per Hauser (Citation2006). Kernel density estimates were calculated in ArcMAP using the Spatial Analyst tool Kernel Density to examine trends in relative densities across the study area. As no annual differences were detected in common and bottlenose dolphin sighting data, these were pooled across years and seasonal trends were examined. Given the effect of year on Bryde’s whale sightings, spatial analyses were conducted by year. Seasonal/annual weighted values were obtained by standardising sightings based on the total number of individuals and kilometres of survey effort per 5 × 5 km grid cell for each season/year. Cell size for the kernel density estimation was set at 1 × 1 km and the search radius was set to 10 km (Euclidean distance) to limit searching to adjacent 5 × 5 km grid cells only. The smaller cell size selected for the kernel density estimation was to avoid creating an output raster that was a poor approximation to a continuous surface but realistic for the scale of the sampling resolution. Since the aim of this study was to investigate temporal and spatial trends for each species rather than making inter-species comparisons, different scaling factors were used to present the most readable relative density values for each species. As such, scaling factors were constant within species and across study sites but not among species. The resulting kernel density maps were visually assessed in order to identify any high density regions (i.e. hotspots; Clement Citation2005).
Finally, distance to shore was used to further describe the geographic distribution of cetaceans within the study areas. Distance to shore (km) was calculated using the ArcMap Near tool to measure the distance to the nearest point of land. Linear models were used to assess seasonal/annual differences in distances from shore.
Results
Effort
Between January 2010 and November 2012, 279 days of survey effort were conducted in the Hauraki Gulf. A total of 887.6 h and 243.9 h were spent ‘on effort’ searching for marine mammals in the IHG and off GBI, with 16,786 km and 4017 km of ‘on effort’ tracks within the IHG and GBI grid cells, respectively (; ). Surveys were conducted in the IHG during every month of the study period. Effort was greatest in the first year of data collection and was approximately double that of the final two years () when surveys were also being conducted at GBI. Surveys were conducted at GBI during 9 months of the year for both 2011 and 2012. Surveys were not conducted in February, June or September of 2011 or in July, November or December of 2012.
Figure 2. Distribution of search effort according to 5 × 5 km grid cells in the inner Hauraki Gulf (IHG) and off the west coast of Great Barrier Island (GBI), New Zealand in 2010–2012. Red lines represent ‘on effort’ boat survey tracks. Bathymetry is depicted with darker shades of blue representing deeper waters (data courtesy of NIWA; Mackay et al. Citation2012).
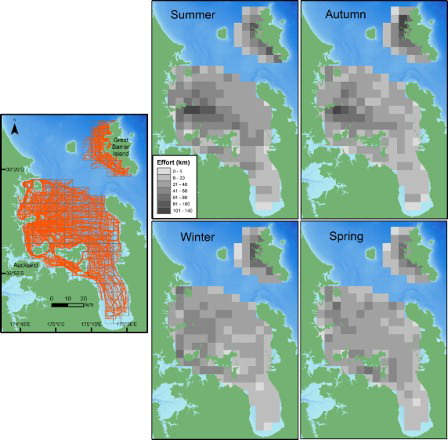
Table 1. Seasonal survey effort in the inner Hauraki Gulf (IHG) and off Great Barrier Island (GBI), New Zealand in 2010–2012.
Group size
Common dolphin
The common dolphin was the most frequently sighted cetacean in the IHG. Lower mean and median group sizes were recorded during winter (mean = 17.8, median = 7.0; ), and the largest average group sizes were recorded during summer (mean = 26.8, median = 19.0; ). However, the negative binomial GLM suggested there was no evidence for seasonal differences in group size (P = 0.160). At GBI, common dolphins were also the most frequently sighted cetacean. There was evidence of a seasonal difference in group size at GBI (negative binomial GLM; P < 0.001), with significantly lower group sizes in winter than summer (P = 0.009) and spring (P = 0.002).
Table 2. Group sizes of common and bottlenose dolphins and Bryde’s whales sighted ‘on effort’ in the inner Hauraki Gulf (IHG) and off Great Barrier Island (GBI), New Zealand, in 2010–2012 and 2011–2012, respectively.
Bryde’s whale
Bryde’s whale group sizes in the IHG demonstrated little seasonal variation (Poisson GLM, P = 0.845), ranging from only one to two individuals () with the majority of groups (89%) consisting of singletons. Similarly, GBI group sizes also showed little seasonal variation (Poisson GLM, P = 0.378), ranging from one to three individuals. The majority of GBI groups (82%) also consisted of just one whale, with a group of three whales recorded only once.
Bottlenose dolphin
Bottlenose dolphins were encountered only rarely in the IHG (n = 7) and groups typically consisted of fewer than 10 individuals (71%). Seasonal trends in group size could not be precisely estimated due to the small sample size (). At GBI, bottlenose dolphins were frequently encountered year-round. The linear model provided evidence of a seasonal difference in group size (P = 0.019), with lower group sizes in autumn compared with summer (P = 0.027). Group sizes were larger during all seasons at GBI compared with the IHG ().
Temporal relative density
Poisson GLMs were fitted for SR of both Bryde’s whales and bottlenose dolphins at GBI. All other temporal relative density models used a negative binomial GLM framework.
Common dolphin
In the IHG, a greater number of common dolphin groups were detected during winter of all survey years, the majority of which were small (fewer than 10 dolphins; ; A,C). There were fewer but generally larger groups of dolphins during summer and autumn (; A). The GLMs found strong evidence of a seasonal effect in SR (P < 0.0001) and in ER (P = 0.010). Overall, the temporal relative density (i.e. SR and ER) of common dolphins was greatest during winter and spring and gradually declined over summer, decreasing to the lowest values in autumn (A,C). The mean SR for common dolphins in the IHG was 0.024 groups/km (SD = 0.012, n = 12), and mean ER was 0.515 individuals/km (SD = 0.240, n = 12).
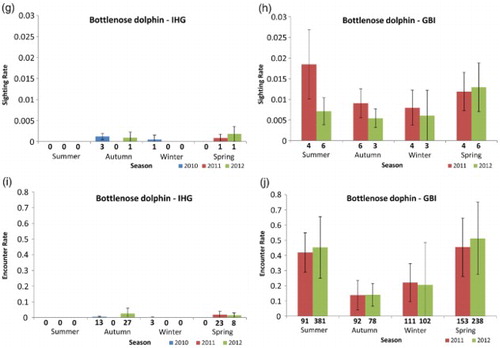
Figure 3. SR (sighting rate) and ER (encounter rate) by season (± SE) of common dolphins (A–D), Bryde’s whales (E–F) and bottlenose dolphins (G–J) using inner Hauraki Gulf (IHG) waters in 2010–2012 and Great Barrier Island (GBI) waters in 2011–2012. Sample sizes (number of groups and number of individuals, respectively) are shown for each season and year.
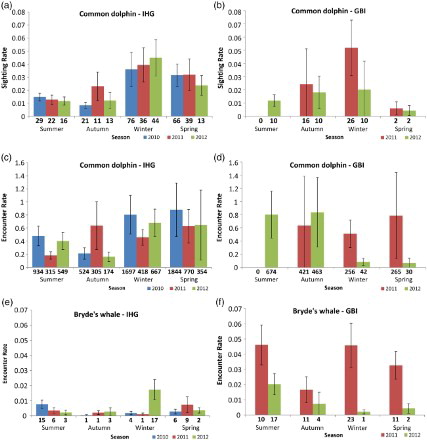
Figure 3. Continued
At GBI, common dolphin groups were sighted more frequently in winter and autumn during both 2011 and 2012 (B). The absence of sightings during summer 2011 (B,D) was likely an artefact of only one monthly trip to GBI and should be treated with caution. SR was low during spring of both years (B). ER was consistently high in autumn of both years, but values for other seasons were variable across years (D). A significant seasonal effect was evident for SR at GBI (P = 0.004), but for ER the effect of season depended on year (P = 0.0001). Mean SR and ER for common dolphins at GBI was 0.017 groups/km (SD = 0.016, n = 8) and 0.465 individuals/km (SD = 0.360, n = 8), respectively.
Bryde’s whale
Bryde’s whales were encountered year-round in the IHG () with more whales detected in 2010 and 2012 than during 2011 (E). Interannual variation was much larger than seasonal variation. The seasonal effects varied depending on the year (P = 0.018), although sightings were consistently low during autumn of all years (E).
Bryde’s whales were encountered in the GBI study area year-round; however, given the variation between survey years (F), no overall trends in seasonal ER could be detected. There was strong evidence of an inter-annual difference in the number of whales detected per km search effort (P < 0.0001), with a higher ER in 2011. Additionally, the low ER at GBI during winter 2012 coincided with a peak in ER in the IHG at that time. Mean ER was greater at GBI than in the IHG (ER = 0.022 individuals/km, SD = 0.018, n = 8).
Bottlenose dolphin
Bottlenose dolphins were not frequently sighted during IHG surveys. Detections were made during ‘on effort’ surveys only in autumn and winter 2010, spring 2011, and autumn and spring 2012 (G). No sightings (‘on’ or ‘off effort’) were made during the summer of any survey year. Mean SR and ER were 0.0004 groups/km (SD = 0.0006, n = 12) and 0.0054 individuals/km (SD = 0.0089, n = 12). Due to the small sample size, no statistical tests were applied to the bottlenose dolphin data for the IHG.
At GBI, bottlenose dolphins were recorded during all seasons and years (H,J). The low ERs for autumn reflect the typically smaller group sizes recorded during that season (). All seasonal ER patterns were consistent between survey years (J). There was no evidence of a year (P = 0.822) or season (P = 0.350) effect in SR, and only weak evidence of a seasonal effect in ER between autumn and spring (P = 0.064). Mean SR and ER were 0.010 groups/km (SD = 0.004, n = 8) and 0.318 individuals/km (SD = 0.156, n = 8), respectively.
Spatial relative density
Common dolphin
The distribution and density of common dolphins in the IHG varied with season, with the highest density cells recorded during winter and spring (). Dolphins were most widely distributed throughout the IHG during winter and were the least widespread during autumn, when densities were also the lowest. Common dolphins were found in central regions of the IHG during all seasons. In the northwestern IHG, they were sighted close to and inshore of Kawau Island during winter and spring. Sightings close to Auckland city in the southwestern IHG were rare, with only one group recorded in the Tamaki Strait (during winter) over the 3 year study period. Common dolphins were infrequently encountered in the Firth of Thames and only during summer and winter. Their distribution spanned into the most eastern regions of the IHG (i.e. off the west coast of the Coromandel Peninsula) mainly during winter. There was evidence that distance from shore depended on season (P = 0.002), with winter distances (mean = 3.64 km, SD = 4.08) significantly lower than summer (mean = 8.60, SD = 4.08, P = 0.007) and autumn (mean = 8.63, SD = 4.53, P = 0.024).
Figure 4. Seasonal relative densities of common dolphins in the inner Hauraki Gulf (IHG) in 2010–2012 and off Great Barrier Island (GBI) in 2011–2012. Darker shading represents higher density cells. The sighting position of each common dolphin group is indicated by a shaded grey dot according to year. Year 1: Jan–Nov 2010; Year 2: Dec 2010–Nov 2011; Year 3: Dec 2011–Nov 2012. Bathymetry is depicted with darker shades of blue representing deeper waters (data courtesy of NIWA; Mackay et al. Citation2012). The 5 × 5 km grid is also shown.
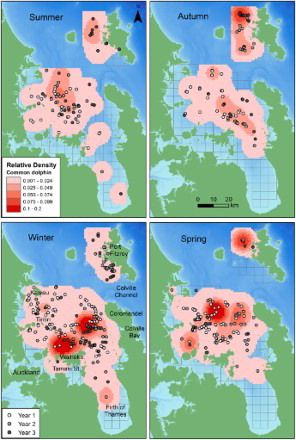
The distribution and density of common dolphins off GBI also varied with season. The consistent factor across all seasons was the presence of common dolphins off the northwestern coast of GBI (associated over or near the Cradock Channel region) rather than more southeastern regions, and in more offshore waters rather than within the bays and ports of GBI. Common dolphins were widely distributed across the study area during most seasons with the exception of spring (). Distribution spread furthest into southeastern regions during winter. Overall, the relative density maps () show GBI waters were used by a much greater density of common dolphins in autumn relative to the other seasons. Despite a large number of winter sightings, the relatively low winter density was due to small groups (mean = 8.3, SD = 11.5; ) of dolphins dispersed across most of the survey area. Summer densities, while similar to winter, were due to a few large groups of dolphins distributed across similar regions. Groups were sighted at different distances from shore according to season (P < 0.001), with dolphins found closer to shore in winter (mean = 2.71 km, SD = 2.12) compared with autumn (mean = 5.99, SD = 2.26, P < 0.001) and summer (mean = 3.80, SD = 2.54, P = 0.046). Winter was the only season when common dolphins were found in the sheltered inshore bays of Port Fitzroy ().
Bryde’s whale
Bryde’s whale distribution in the IHG was generally similar across years, with the exception of 2011 when whales were more spatially concentrated in eastern areas (). Overall, whales were distributed north of Waiheke Island, in central and more northerly regions (). Distance from shore differed according to year (P = 0.040), with whales found closer to land in 2012 (mean = 6.79 km, SD = 3.74) compared with 2011 (mean = 13.38 km, SD = 5.83, P < 0.001) and 2010 (mean = 10.06, SD = 5.01, P = 0.020). Densities were similar across years, although high density regions were less apparent in 2010.
Figure 5. Annual relative densities of Bryde’s whales in the inner Hauraki Gulf (IHG) in 2010–2012 and off Great Barrier Island (GBI) in 2011–2012. Darker shading represents higher density cells. The sighting position of each Bryde’s whale group is indicated according to season. Bathymetry is depicted with darker shades of blue representing deeper waters (data courtesy of NIWA; Mackay et al. Citation2012). The 5 × 5 km grid is also shown.
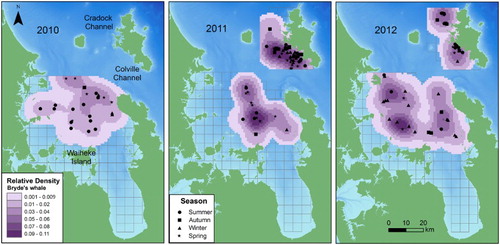
Bryde’s whale density off GBI differed according to year (). Sightings were unevenly distributed across the study area in 2011 and concentrated off the southwest coast of the island closer to the Colville Channel and over the 40 m shelf region. In 2012, Bryde’s whale sightings were distributed more evenly across northern and southern regions. There was no difference in distance to shore between years (P = 0.812).
Bottlenose dolphin
Bottlenose dolphins were sighted infrequently in the IHG, yet they were recorded in all seasons except for summer (). Due to the small seasonal sample sizes, kernel density analyses were not conducted for the IHG.
Figure 6. Seasonal relative densities of bottlenose dolphins off the west coast of Great Barrier Island (GBI), New Zealand in 2011–2012. Darker shading represents higher density cells. Sighting positions of each bottlenose dolphin group detected in the inner Hauraki Gulf (IHG; 2010–2012) and off GBI are indicated by a shaded grey dot according to year. Year 1: Jan–Nov 2010; Year 2: Dec 2010–Nov 2011; Year 3: Dec 2011–Nov 2012. Bathymetry is depicted with darker shades of blue representing deeper waters (data courtesy of NIWA; Mackay et al. Citation2012). The 5 × 5 km grid is also shown.
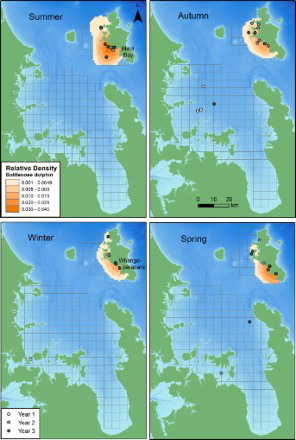
At GBI, bottlenose dolphins were generally found within 2 km of the coast and within bays and harbours during all seasons (). While a similar number of groups were detected year round, the highest seasonal densities of bottlenose dolphins were recorded during summer and spring (). The southwestern region was generally used by more dolphins than the northwestern area as the highest density cells were all located around the Whangaparapara to Blind Bay region of coastline (). The distance bottlenose dolphins were found from shore depended upon season (P = 0.013). They were found very close inshore during winter (median = 0.13 km, IQR = 0.08–0.21) and were distributed furthest from the coast during summer (median = 0.94 km, IQR = 0.37–1.25), with summer distances significantly greater than both winter (P = 0.026) and spring (P = 0.021).
Discussion
The spatial distribution and density of cetaceans using IHG and GBI waters have been described for the first time to provide important data to support the management of cetaceans in the Hauraki Gulf. This includes the identification of GBI as a hotspot for the North Island bottlenose dolphin population, which has experienced a local decline in abundance in the Bay of Islands (Tezanos-Pinto et al. Citation2013). Further spatial and temporal information about how Bryde’s whales use the region will be invaluable for current ship strike mitigation (see Constantine et al. Citation2015). Additionally, understanding the spatial ecology of common dolphins is essential for proactive management given their high use of Hauraki Gulf waters where they are the focus of a commercial tourism operation and are known to be affected by anthropogenic influences (Stockin et al. Citation2008c).
Hypothesising about the similarities or differences among SR and ER indices of different populations is problematic because the size of a study area or the survey design may account for a considerable amount of the variation among indices. For example, if this study had not included Tamaki Strait and Firth of Thames waters where common dolphins are only sighted infrequently, the relative abundance indices reported herein would have been considerably higher. Additionally, such indices do not account for the imperfect detection of species during sampling (MacKenzie et al. Citation2002); therefore, we acknowledge that our results represent an underestimation of the true distribution of the species. Nevertheless, some comparisons with other regions are made to put the results of this study into a global context.
Common dolphin
Relative densities of common dolphins were similar to those of other warm temperate regions, such as the Alboràn Sea, Mediterranean (0.023 groups/km; Bearzi et al. Citation2003) and the Gulf St. Vincent, Australia (0.03 groups/km; Filby et al. Citation2010), which generally support relatively abundant populations of common dolphins. Seasonal relative densities were not available for other regions outside of New Zealand for comparison with the Hauraki Gulf.
From a New Zealand perspective, the Hauraki Gulf region as a whole appears to be a generally important area for common dolphins as they are widely distributed across IHG and GBI waters in relatively large densities year-round. In the Hauraki Gulf, the increases in SRs and ERs during winter were consistent across IHG and GBI waters. Similar to this study, Stockin et al. (Citation2008b) also reported the highest SRs (based on sightings per unit effort [SPUE], defined as the number of common dolphin sightings per 60 min of search effort) in the IHG during winter. As previously hypothesised, this may be related to increased foraging opportunities given that feeding groups are most prevalent during winter and spring (Stockin et al. Citation2009; Dwyer Citation2014). While the Hauraki Gulf has been shown to be important during the colder months, no clear hotspots could be identified during any season. Only the Firth of Thames and Tamaki Strait regions do not appear to be regularly frequented by this species.
The inshore movement of common dolphins in Hauraki Gulf waters during winter may represent an overall seasonal offshore to inshore shift in distribution for the species as a whole across northeastern waters since the same pattern was reported for the Bay of Islands (Constantine & Baker Citation1997). This may also be combined with an influx of dolphins from surrounding areas, given that high winter densities in the IHG coincide with decreased winter sightings to the south in the Bay of Plenty (Neumann Citation2001; Meissner et al. Citation2014). While these changes in distribution are associated with changes in water temperature, it is unlikely that cooler temperatures alone would push dolphins northwards. Other studies have noted similar increases in common dolphin occurrences within inshore waters in winter when temperatures are at their coolest, for example Admiralty Bay in the Marlborough Sounds, South Island (Halliday Citation2013). Additionally, large aggregations of common dolphins have been reported in Cook Strait during the winter months (Stockin & Orams Citation2009). Such movements during winter are more likely to be related to prey distribution, given that common dolphin prey such as pilchard (Sardinops neopilchardus) are known to be more abundant in bays and harbours in New Zealand when water temperatures are cooler (Ministry for Primary Industries Citation2013).
In the Hauraki Gulf, neonates are most frequently recorded during summer months (Stockin et al. Citation2008b; Dwyer Citation2014). Schaffar (Citation2004) reported groups with neonates were larger than groups containing all other age classes (from neonate through to adult only). Coinciding with the peak period for birthing may explain the larger groups encountered during summer (mean 26.8 for IHG and 67.4 for GBI) and spring (mean 25.2 for IHG and 73.8 for GBI) in the present study. However, summer densities were lower than other seasons in the IHG and off GBI, suggesting individuals may also be moving to other regions or at least beyond the IHG and GBI study areas. This corresponds with increased sightings of common dolphins to the south of the Hauraki Gulf in the East Coast Bay of Plenty during summer (Meissner et al. Citation2014).
The results of this study will be most beneficial when used to monitor the Hauraki Gulf population over time. This was demonstrated by Bearzi et al. (Citation2005) who recorded a local decline of short-beaked common dolphins in the eastern Ionian Sea, Mediterranean, as a likely consequence of prey depletion. As a result of the marked decrease in common dolphin ERs from 2.18 to 0.40 encounters per 100 km, combined with reported declines in the other neighbouring regions, the Mediterranean subpopulation was classified as ‘Endangered’ by the International Union for Conservation of Nature in 2003 (Bearzi Citation2003). As such, the relative density of common dolphins using the Hauraki Gulf should be re-evaluated over the long-term to monitor any changes in the population. This is important given the unknown status of common dolphin prey stocks off northeastern New Zealand (Ministry for Primary Industries Citation2013).
Bryde’s whale
When examining temporal variation in Bryde’s whale ERs in the IHG, it is important to consider the use of the wider Hauraki Gulf region. The results of the winter 2012 season clearly show that decreased sightings at GBI corresponded with a peak in occurrence in the IHG. Therefore, apparent decreased ERs in either the IHG or outer Hauraki Gulf alone may not be representative of the overall use of the Hauraki Gulf.
Finding a presence (Penry et al. Citation2011; Wiseman et al. Citation2011) or absence (Behrens Citation2009; this study) of a seasonal pattern in the occurrence of Bryde’s whales could be related to factors including differences in methodologies or annual climate fluctuations. Since seasonal upwellings in the Hauraki Gulf are responsive to the wind, hydrodynamics are largely affected by broad-scale variability in climate conditions, namely the influence of the El Niño Southern Oscillation. During the period of this study, from 2010 to 2012, conditions were primarily La Niña or neutral. El Niño conditions were only fully developed during the first 3 months of the study that commenced in January 2010 (National Climate Centre Citation2013). From spring 2010 to the end of autumn 2011, a strong La Niña was underway (National Climate Centre Citation2013).
In an earlier study in the Hauraki Gulf, Wiseman et al. (Citation2011) reported a significant difference in the seasonal (but not annual) occurrence of Bryde’s whales during 2003 to 2006, with increased trip ERs during winter compared with spring and summer. However, Behrens (Citation2009) concluded that there were no significant seasonal differences for either the number or distribution of whales in the Hauraki Gulf using data collected between 2000 and 2009. Wiseman et al. (Citation2011) used only presence/absence data to calculate their trip encounter rate. In the present study, relative density indices were calculated based on the number of whale sightings per survey, rather than the presence/absence of a sighting. Behrens (Citation2009) noted that the highest number of annual sightings between 2000 and 2009 occurred in the years 2003–2005, coinciding with the Wiseman et al. (Citation2011) study period when conditions were predominantly El Niño. This is contrary to data presented herein that were collected during mainly La Niña conditions. A study in the Gulf of California, USA, which examined inter-annual changes in Bryde’s whale occurrence over a 20-year period, found that whales did not have a well-defined pattern of seasonal occurrence, and suggested changes could be driven by variation in food availability that was related to climate fluctuations (Salvadeo et al. Citation2011).
The differing results of the Hauraki Gulf studies and the inter-annual variability in SRs in this study could well be explained by such a climate driven system, as was reported by Salvadeo et al. (Citation2011). For instance, the change from La Niña to neutral conditions in 2012 may have had some effect on the distribution of whales off GBI between 2011 and 2012, possibly linked to changes in prey distribution. Indeed, evidence for the significant top-down effects of inter-decadal climate variability on oceanic ecosystems were described for the Gulf of Alaska, where climate was linked to an increase in predatory fishes, with subsequent declines in forage fish that in turn affected bird and mammal populations (Francis et al. Citation1998).
Overall, Bryde’s whale distribution was relatively consistent across years in the IHG, with central northerly regions commonly used, as reported in previous studies (O’Callaghan & Baker Citation2002; Baker & Madon Citation2007; Behrens Citation2009; Wiseman et al. Citation2011). However, the high density regions were variable among years, highlighting the need for long-term datasets preferably collected from independent research vessels that are not restricted by set schedules or in their spatial coverage of the Hauraki Gulf in the same manner as platforms of opportunity (Riekkola Citation2013; Hupman et al. Citation2015).
While whales generally used similar regions of the IHG across all survey years, the data were more variable for GBI. Densities were high off the southwest coast of GBI in 2011 but fewer encounters were made in 2012, and these were not restricted to the southern region of the study area. There were also significant differences between whale and common dolphin distributions off GBI, with whales found almost exclusively off the southwest coast of GBI in 2011 and common dolphin densities highest in northern waters associated with the Cradock Channel. When southeasterly winds reach moderate velocities, the strongest upwellings in the Hauraki Gulf occur on the leeward side of GBI (Black et al. Citation2000). This corresponds with the Bryde’s whale hotspot that was particularly evident in 2011 when La Niña conditions were strong and therefore more easterly winds were prevalent (Renwick et al. Citation2010).
Bottlenose dolphin
Bottlenose dolphins were infrequently encountered in the IHG, but were regularly encountered at GBI across all seasons. Unfortunately, sample sizes for the IHG were too small to conduct any meaningful statistical analyses or discuss further. SR for GBI (0.010 groups/km) was similar to the values reported for bottlenose dolphins in other warm temperate waters like the eastern Ionian Sea, Greece (0.011 groups/km; Bearzi et al. Citation2005), Northern Evoikos Sea, Greece (0.010 groups/km; Bonizzoni et al. Citation2014) and off southern Spain (0.004–0.012 groups/km; Cañadas & Hammond Citation2006). ERs (individuals/km) for GBI were high during spring and summer when group sizes were largest and calves were most prevalent (Dwyer et al. Citation2014). The lowest densities at GBI were consistently recorded during autumn when group sizes were smallest, which also coincided with the highest number of encounters in IHG waters in this study, and the most observations in an opportunistic photo-identification study conducted in the IHG between 2000 and 2003 (Berghan et al. Citation2008).
Distribution at GBI varied according to season in the same manner as common dolphins, with groups found closest to shore in winter and spring and furthest from the coast in summer. This pattern was consistent across years and concurs with research conducted in the Bay of Islands, Northland, where bottlenose dolphins were distributed in shallower waters during winter and deepest waters during summer (Constantine & Baker Citation1997; Constantine Citation2002). Additionally, while both northern and southern regions of the coast were used in all seasons, the Whangaparapara to Blind Bay area was a hotspot for bottlenose dolphins in all seasons except for autumn, when distribution and density were more uniform along the coast. That southwestern region of the coast appears to be important for groups with calves, as discussed in Dwyer et al. (Citation2014).
Based on the differences in distribution and relative densities in the IHG and GBI, it appears that GBI is a hotspot for bottlenose dolphins in the Hauraki Gulf, as hypothesised earlier by Dwyer et al. (Citation2014). Possible reasons for the frequent occurrence and prevalence of large groups at GBI were discussed by Dwyer et al. (Citation2014). They include the high productivity of the GBI region, which is influenced by the strong currents of the Colville Channel, and the importance of the GBI coastline for nursery groups that were large and frequently recorded. However, it is not clear why the IHG was used to such a lesser degree than GBI. It seems unlikely to be related to competition given that bottlenose dolphins do not select the same prey species as common dolphins and Bryde’s whales (e.g. Constantine Citation2002; Lusseau Citation2003; Neumann & Orams Citation2003; Meynier et al. Citation2008; Wiseman Citation2008). Another hypothesis is the possible displacement of dolphins due to boat traffic (e.g. Lusseau Citation2005) given that the IHG, particularly areas close to the ports of Auckland, typically experiences higher levels of vessel activity than GBI.
Conclusion
Overall, GBI was a hotspot for bottlenose dolphins during all seasons and years, and for Bryde’s whales in 2011. Predictable high density areas for Bryde’s whales could not be identified given the annual variation in their occurrence. Although specific key spatial regions could not be determined for common dolphins, it is evident that the IHG is particularly important for the species during the colder months. The shallow regions of the Firth of Thames and southwestern IHG were not highly used by any of these three species. It is essential to remember that the results of this study occurred under predominantly La Niña conditions. Given the strong effects of winds on ocean circulation in the Hauraki Gulf, variations in patterns described here may vary under more neutral and El Niño conditions, particularly for Bryde’s whales. The relative abundance indices presented here enable global comparisons with other populations of these species and, more importantly, provide baseline values for the Hauraki Gulf that can be used for future monitoring purposes. Moreover, the spatial maps provide useful seasonal distribution and relative density information to support management initiatives such as marine spatial planning.
Acknowledgements
SLD thanks the Great Barrier Island local community, in particular the Motu Kaikoura Trust and Great Barrier Island Marine Radio for support in the field. Special thanks go to all volunteers who assisted with boat surveys. The manuscript was improved by comments from two anonymous referees.
Associate Editor: Bruce Robertson.
Disclosure statement
No potential conflict of interest was reported by the authors.
Additional information
Funding
Notes
1 The study site was limited to the research vessel operating area, which was permitted in accordance with the Maritime New Zealand Safe Ship Management system for commercial vessels. For GBI, the operating area for the research vessel was restricted to waters off the western side of the island only.
References
- Ando A, Camm J, Polasky S, Solow A. 1998. Species distributions, land values, and efficient conservation. Science. 279:2126–2128. doi: 10.1126/science.279.5359.2126
- Baker AN, Madon B. 2007 . Bryde’s whales (Balaenoptera cf. brydei Olsen 1913) in the Hauraki Gulf and northeastern New Zealand waters. Science for conservation 272. New Zealand Department of Conservation, Wellington, New Zealand, 23 p.
- Baker CS, Chilvers BL, Constantine R, DuFresne S, Mattlin RH, van Helden A, Hitchmough R. 2010. Conservation status of New Zealand marine mammals (suborders Cetacea and Pinnipedia), 2009. New Zeal J Mar Fresh. 44:101–115. doi: 10.1080/00288330.2010.482970
- Bearzi G. 2003. Delphinus delphis (Mediterranean subpopulation). The IUCN Red List of Threatened Species. Version 2014.2. [cited 2014 August 17]. Available from: www.iucnredlist.org/details/41762/0.
- Bearzi G, Politi E, Agazzi S, Bruno S, Costa M, Bonizzoni S. 2005. Occurrence and present status of coastal dolphins (Delphinus delphis and Tursiops truncatus) in the eastern Ionian Sea. Aquat Conserv Mar Freshw Ecosys. 15:243–257. doi: 10.1002/aqc.667
- Bearzi G, Reeves RR, Notarbartolo di Sciara G, Politi E, Canadas A, Frantzis A, Mussi B. 2003. Ecology, status and conservation of short-beaked common dolphins Delphinus delphis in the Mediterranean Sea. Mammal Rev. 33:224–252. doi: 10.1046/j.1365-2907.2003.00032.x
- Behrens S. 2009. Bryde’s whales (Balaenoptera brydei) in the Hauraki Gulf and the effects of vessel traffic. Unpublished MSc thesis. University of Auckland, Auckland, New Zealand. 97 p.
- Berghan J, Algie KD, Stockin KA, Wiseman N, Constantine R, Tezanos-Pinto G, Mourão F. 2008. A preliminary photo-identification study of bottlenose dolphin (Tursiops truncatus) in Hauraki Gulf, New Zealand. New Zeal J Mar Fresh. 42:465–472. doi: 10.1080/00288330809509974
- Beyer HL. 2012. Geospatial modelling environment. Available from: http://spatialecology.com/gme
- Black KP, Hume M, Bell RG, Oldman JW, Carter GS, Hume TM. 2000. Features of 3-dimensional barotropic and baroclinic circulation in the Hauraki Gulf, New Zealand. New Zeal J Mar Fresh. 34:1–28. doi: 10.1080/00288330.2000.9516912
- Blasi MF, Boitani L. 2012. Modelling fine-scale distribution of the bottlenose dolphin Tursiops truncatus using physiographic features on Filicudi (southern Thyrrenian Sea, Italy). Endanger Species Res. 17:269–288. doi: 10.3354/esr00422
- Bonizzoni S, Furey NB, Pirotta E, Valavanis VD, Würsig B, Bearzi G. 2014. Fish farming and its appeal to common bottlenose dolphins: modelling habitat use in a Mediterranean embayment. Aquat Conserv Mar Freshw Ecosys. 24:696–711. doi: 10.1002/aqc.2401
- Brooks T, Balmford A, Burgess N, Fjeldså J, Hansen LA, Moore J, Rahbek C, Williams P. 2001. Toward a blueprint for conservation in Africa. BioScience. 51:613–624. doi: 10.1641/0006-3568(2001)051[0613:TABFCI]2.0.CO;2
- Buckland ST, Anderson DR, Burnham KP, Laake JL. 1993. Distance sampling: estimating abundance of biological populations. London, UK: Chapman & Hall.
- Cañadas A, Hammond PS. 2006. Model-based abundance estimates for bottlenose dolphins off southern Spain: implications for conservation and management. J Cetac Res Manage. 8:13–27.
- Cañadas A, Sagarminaga R, De Stephanis R, Urquiola E, Hammond PS. 2005. Habitat preference modelling as a conservation tool: proposals for marine protected areas for cetaceans in southern Spanish waters. Aquat Conserv Mar Freshw Ecosys. 15:495–521. doi: 10.1002/aqc.689
- Chang FH, Zeldis J, Gall M, Hall J. 2003. Seasonal and spatial variation of phytoplankton assemblages, biomass and cell size from spring to summer across the north-eastern New Zealand continental shelf. J Plankton Res. 25:737–758. doi: 10.1093/plankt/25.7.737
- Clement DM. 2005. Distribution of Hector’s dolphin (Cephalorhynchus hectori) in relation to oceanographic features. Unpublished PhD thesis. University of Otago, Dunedin, New Zealand. 253 p.
- Constantine R. 2002. The behavioural ecology of the bottlenose dolphins (Tursiops truncatus) of northeastern New Zealand: a population exposed to tourism. Unpublished PhD thesis. University of Auckland, Auckland, New Zealand. 195 p.
- Constantine R, Baker CS. 1997. Monitoring the commercial swim-with-dolphin operations in the Bay of Islands. Science for Conservation 56. Department of Conservation, Wellington, New Zealand. 59 p.
- Constantine R, Johnson M, Riekkola L, Jervis S, Kozmian-Ledward L, Dennis T, Torres LG, Aguilar de Soto N. 2015. Mitigation of vessel-strike mortality of endangered Bryde’s whales in the Hauraki Gulf, New Zealand. Biol Conserv. 186:149–157. doi: 10.1016/j.biocon.2015.03.008
- Currey RJC, Dawson SM, Slooten E, Schneider K, Lusseau D, Boisseau OJ, Haase P, Williams JA. 2009. Survival rates for a declining population of bottlenose dolphins in Doubtful Sound, New Zealand: an information theoretic approach to assessing the role of human impacts. Aquatic Conservation: Marine and Freshwater Ecosystems. 19:658–670. doi: 10.1002/aqc.1015
- Dawson S, Wade P, Slooten E, Barlow J. 2008. Design and field methods for sighting surveys of cetaceans in coastal and riverine habitats. Mammal Rev. 38:19–49. doi: 10.1111/j.1365-2907.2008.00119.x
- De Boer MN. 2010. Cetacean distribution and relative abundance in offshore Gabonese waters. J Mar Biol Assoc UK. 90:1613–1621. doi: 10.1017/S0025315410001165
- Dwyer SL. 2014. Spatial ecology and conservation of cetaceans using the Hauraki Gulf, New Zealand. Unpublished PhD thesis. Massey University, Auckland, New Zealand. 232 p.
- Dwyer SL, Tezanos-Pinto G, Visser IN, Pawley MDM, Meissner AM, Berghan J, Stockin KA. 2014. Overlooking a potential hotspot at Great Barrier Island for the nationally endangered bottlenose dolphin of New Zealand. Endanger Species Res. 25:97–114. doi: 10.3354/esr00613
- Filby NE, Bossley M, Sanderson KJ, Martinez E, Stockin KA. 2010. Distribution and population demographics of common dolphins (Delphinus delphis) in the Gulf St. Vincent, South Australia. Aquat Mamm. 36:33–45. doi: 10.1578/AM.36.1.2010.33
- Forcada J, Hammond PS. 1998. Geographical variation in abundance of striped and common dolphins of the western Mediterranean. J Sea Res. 39:313–325. doi: 10.1016/S1385-1101(97)00063-4
- Fortin M, Keitt TH, Maurer BA, Taper ML, Kaufman DM, Blackburn TM. 2005. Species’ geographic ranges and distributional limits: pattern analysis and statistical issues. Oikos. 108:7–17. doi: 10.1111/j.0030-1299.2005.13146.x
- Francis RC, Hare SR, Hollowed AB, Wooster WS. 1998. Effects of interdecadal climate variability on the oceanic ecosystems of the NE Pacific. Fish Oceanogr. 7:1–21. doi: 10.1046/j.1365-2419.1998.00052.x
- Halliday KR. 2013. Use of Admiralty Bay, New Zealand by sympatric marine mammal species. Unpublished MSc thesis. University of Auckland, Auckland, New Zealand. 95 p.
- Hauser DDW. 2006. Summer space use of Southern Resident killer whales (Orcinus orca) within Washington and British Columbia inshore waters. Unpublished MSc thesis. University of Washington, Seattle, USA. 74 p.
- Helweg DA. 1998. Automating the acoustic monitoring of New Zealand waters for migrating humpback whales (Megaptera novaeangliae). Technical Report 1765. Space and Naval Warfare Systems Center, San Diego, USA. 10 p.
- Hupman K, Visser IN, Martinez E, Stockin KA. 2015. Using platforms of opportunity to determine the occurrence and group characteristics of orca (Orcinus orca) in the Hauraki Gulf, New Zealand. New Zeal J Mar Fresh, 49:132–149.
- Kibblewhite AC, Denham RN, Barnes DJ. 1967. Unusual low-frequency signals observed in New Zealand waters. J Acoust Soc Am. 41:644–655. doi: 10.1121/1.1910392
- Kiszka J, Macleod K, Van Canneyt O, Walker D, Ridoux V. 2007. Distribution, encounter rates, and habitat characteristics of toothed cetaceans in the Bay of Biscay and adjacent waters from platform-of-opportunity data. Ices J Mar Sci. 64:1033–1043. doi: 10.1093/icesjms/fsm067
- Lusseau D. 2005. Residency pattern of bottlenose dolphins Tursiops spp. in Milford Sound, New Zealand, is related to boat traffic. Mar Ecol-Prog Ser. 295:265–272. doi: 10.3354/meps295265
- Lusseau SM. 2003. Diet of bottlenose dolphins in Doubtful Sound, New Zealand; evidence from stable carbon and nitrogen isotope analysis. Unpublished MSc thesis. University of Otago, Dunedin, New Zealand. 118 p.
- Mackay K, Mackay E, Neil H, Mitchell J, Bardsley S. 2012. Hauraki Gulf. NIWA Chart, Miscellaneous Series 91. Available from http://www.niwa.co.nz/our-science/oceans/bathymetry
- MacKenzie DI, Nichols JD, Lachman GB, Droege S, Royle JA, Langtimm CA. 2002. Estimating site occupancy rates when detection probabilities are less than one. Ecology. 83:2248–2255. doi: 10.1890/0012-9658(2002)083[2248:ESORWD]2.0.CO;2
- Manighetti B, Carter L. 1999. Across-shelf sediment dispersal, Hauraki Gulf, New Zealand. Mar Geol. 160:271–300. doi: 10.1016/S0025-3227(99)00024-9
- McDonald MA. 2006. An acoustic survey of baleen whales off Great Barrier Island, New Zealand. New Zeal J Mar Fresh. 40:519–529. doi: 10.1080/00288330.2006.9517442
- Meissner AM, Martinez E, Orams MB, Stockin KA. 2014. Effects of commercial tourism activities on bottlenose and common dolphin populations in East Coast Bay of Plenty waters. Final internal report to the Department of Conservation, East Coast Bay of Plenty Conservancy, New Zealand. 117 p.
- Meynier L, Stockin KA, Bando MKH, Duignan PJ. 2008. Stomach contents of common dolphin (Delphinus sp.) from New Zealand waters. New Zeal J Mar Fresh. 42:257–268. doi: 10.1080/00288330809509952
- Ministry for Primary Industries. 2013. Fisheries assessment plenary May 2013: stock assessments and yield estimates. Compiled by the Fisheries Science Group, Ministry for Primary Industries, Wellington, New Zealand. 1357 p.
- Moland E, Olsen EM, Andvord K, Knutsen JA, Stenseth NC, Sainte-Marie B. 2011. Home range of European lobster (Homarus gammarus) in a marine reserve: implications for future reserve design. Can J Fish Aquat Sci. 68:1197–1210. doi: 10.1139/f2011-053
- Monsarrat S, Benhamou S, Sarrazin F, Bessa-Gomes C, Bouten W, Duriez O. 2013. How predictability of feeding patches affects home range and foraging habitat selection in avian social scavengers? PLoS ONE. 8:e53077–00. doi: 10.1371/journal.pone.0053077
- National Climate Centre. 2013. State of the climate 2013: a snapshot of recent climate in New Zealand (2010–2012). NIWA Science and Technology Series No. 57. National Institute of Water and Atmospheric Research Ltd., Wellington, New Zealand. 109 p.
- Neumann DR. 2001. Seasonal movements of short-beaked common dolphins (Delphinus delphis) in the north-western Bay of Plenty, New Zealand: influence of sea surface temperature and El Niño/La Niña. New Zeal J Mar Fresh. 35:371–374. doi: 10.1080/00288330.2001.9517007
- Neumann DR, Orams MB. 2003. Feeding behaviours of short-beaked common dolphins, Delphinus delphis, in New Zealand. Aquat Mamm. 29:137–149. doi: 10.1578/016754203101023997
- O’Callaghan MT, Baker CS. 2002. Summer cetacean community, with particular reference to Bryde’s whales, in the Hauraki Gulf, New Zealand. DOC Science Internal Series 55. Department of Conservation, Wellington, New Zealand. 18 p.
- Penry GS, Cockcroft V, Hammond PS. 2011. Seasonal fluctuations in occurrence of inshore Bryde’s whales in Plettenberg Bay, South Africa, with notes on feeding and multispecies associations. Afr J Mar Sci. 33:403–414. doi: 10.2989/1814232X.2011.637617
- R Core Team. 2014. R: a language and environment for statistical computing. R Foundation for Statistical Computing, Vienna, Austria. Available from: www.r-project.org
- Renwick J, Clark A, Griffiths G., Hendrikx J, Liley B, Porteous A, Tait A, Wood S. 2010. State of the climate 2010: a snapshot of recent climate in New Zealand. NIWA Science & Technology Series No. 56. National Institute of Water and Atmospheric Research Ltd., Wellington, New Zealand. 63 p.
- Riekkola L. 2013. Mitigating collisions between large vessels and Bryde’s whales in the Hauraki Gulf, New Zealand. Unpublished BSc thesis. University of Auckland, Auckland, New Zealand. 59 p.
- Salvadeo CJ, Flores-Ramierez S, Gómez-Gallardo A., MacLeod C, Lluch-Belda D, Jaume-Schinkel S, Urbán R, J. 2011. Bryde’s whale (Balaenoptera edeni) in the southwestern Gulf of California: relationship with ENSO variability and prey availability. Cienc Mar. 37:215–225. doi: 10.7773/cm.v37i2.1840
- Schaffar A. 2004. Female reproductive strategies and mother-calf relationships of common dolphins (Delphinus delphis) in the Hauraki Gulf, New Zealand. Unpublished MSc thesis. Massey University, Auckland, New Zealand. 218 p.
- Sea Change—Tai Timu Tai Pari. [cited 2015 October 26]. Available from: http://www.seachange.org.nz/
- Shane SH. 1990. Behavior and ecology of the bottlenose dolphin at Sanibel Island, Florida. In: Leatherwood S, Reeves RR editors. The bottlenose dolphin. San Diego, USA: Academic Press; p. 245–265.
- Steventon J, Liebenberg L, Derbecker M, Bapat V. 2002. CyberTracker Conservation. Available from: http://cybertracker.org
- Stockin KA, Binedell V, Wiseman N, Brunton DH, Orams MB. 2009. Behavior of free-ranging common dolphins (Delphinus sp.) in the Hauraki Gulf, New Zealand. Mar Mammal Sci. 25:283–301.
- Stockin KA, Lusseau D, Binedell V, Wiseman N, Orams MB. 2008c. Tourism affects the behavioural budget of the common dolphin Delphinus sp. in the Hauraki Gulf, New Zealand. Mar Ecol-Prog Ser. 355:287–295. doi: 10.3354/meps07386
- Stockin KA, Orams MB. 2009. The status of common dolphins (Delphinus delphis) within New Zealand waters. Report of the 61st Scientific Committee of the International Whaling Commission, Madeira, Portugal. SC/61/SM20.
- Stockin KA, Pierce GJ, Binedell V,Wiseman N, Orams MB. 2008b. Factors affecting the occurrence and demographics of common dolphins (Delphinus sp.) in the Hauraki Gulf, New Zealand. Aquat Mamm. 34:200–211
- Stockin KA, Wiseman N, Hartman A, Moffat N, Roe WD. 2008a. Use of radiography to determine age class and assist with the post-mortem diagnostics of a Bryde's whale (Balaenoptera brydei). New Zeal J Mar Fresh. 42:307–313.
- Tezanos-Pinto G, Constantine R, Brooks L. et al. 2013. Decline in local abundance of bottlenose dolphins (Tursiops truncatus) in the Bay of Islands, New Zealand. Mar Mammal Sci. 29:E390–E410.
- Wiseman N. 2008. Genetic identity and ecology of Bryde’s whales in the Hauraki Gulf, New Zealand. Unpublished PhD thesis, University of Auckland, Auckland, New Zealand. 234 p.
- Wiseman N, Parsons S, Stockin KA, Baker CS. 2011. Seasonal occurrence and distribution of Bryde’s whales in the Hauraki Gulf, New Zealand. Mar Mammal Sci. 27:E253–E267. doi: 10.1111/j.1748-7692.2010.00454.x
- Würsig B, Jefferson TA. 1990. Methods of photo-identification for small cetaceans. Reports of the International Whaling Commission (Special Issue) 12:43–52.
- Zeldis JR, Walters RA, Greig MJN, Image K. 2004. Circulation over the northeastern New Zealand continental slope, shelf and adjacent Hauraki Gulf, during spring and summer. Cont Shelf Res. 24:543–561. doi: 10.1016/j.csr.2003.11.007