
ABSTRACT
Genypterus blacodes, in terms of its fishing history and local economic importance, is an emblematic species harvested in Chilean Patagonia (41°00’–57°00’S). Most of the current fisheries and biological knowledge of this species come from the open ocean, whereas information about the species in fjords and inner channels is fragmentary. In 2018, two research surveys targeting G. blacodes were conducted in the fjords and inner channels of Chilean Patagonia. A total of 253 pairs of sagittal otoliths were sampled at three different localities, and their contours were modelled using wavelet analysis as a tool for stock discrimination. Contours were compared using canonical analysis, and classification was performed using linear discriminant and Random Forest analyses. The results indicated that the wavelet method is efficient in modelling otolith contours, and the discriminant analyses showed differences among fishing grounds across the latitudinal gradient, thus confirming the hypothesis that G. blacodes conform to at least two separate stock units in Chilean Patagonia. Fishing grounds that were closer in space showed higher levels of misclassification. The discussion focuses on how environmental variables and the geography of fjords shape stock differences and how this information can be used for the sustainable management of G. blacodes.
Introduction
Otoliths are routinely used to determine age and growth in teleost fishes, but the otolith shape is also an important tool for stock management purposes (Hüssy Citation2008; Stransky Citation2013). The major focus of otolith shape studies has been stock discrimination (Bolles and Begg Citation2000; Libungan et al. Citation2015a; Renán et al. Citation2016) and, to a lesser extent, species differentiation (Salimi et al. Citation2016). It has been shown that otolith shape is affected by an interplay of environmental, ontogenetic, and genetic influences (Cardinale et al. Citation2004; Hüssy et al. Citation2016). Therefore, otoliths combine both phenotypic and genotypic influences, which strengthens their use as a tool in stock discrimination analyses (Ladroit et al. Citation2017). Otolith shape can be based on identifiable points or landmarks used to describe morphometric measurements such as perimeter, length and width. However, otoliths usually show complex shapes, and a single set of landmarks is often not sufficient to accurately describe their outlines. The widespread use of otolith morphometry in the last decade has been associated with advances in image processing technology and computing power. Accordingly, quantitative analyses of otolith measurements have also added to the complexity of otolith information. During the 1980s, digital images replaced hand-drawn images, and a method based on harmonic expansion using a Fourier transform was applied to image analyses (Kuhl and Giardina Citation1982; Campana and Casselman Citation1993). The Fourier transform method consists of a representation decomposing each irregular curve into a linear combination of sine and cosine functions. This representation of contours allows for a mathematical representation of the otolith shape. Fourier-based techniques have been widely used to discriminate populations and many fish stocks worldwide (Ladroit et al. Citation2017). Despite this popularity, the Fourier transform method is not able to capture small irregularities in otoliths because high resolution in modelling is attained at the cost of a large number of high-order harmonics representing morphological features (Parisi-Baradad et al. Citation2005). The wavelet transform, which is another signal processing technique, has been proposed to address such drawbacks. Wavelets not only allow the detection of singularities of the otolith contour but also establish the position in which these singularities occur (Parisi-Baradad et al. Citation2005). Therefore, the contours of otoliths can be compared on a point-by-point basis to detect where differences are produced. This advantage allows us to restrict the analysis to a particular area of interest (Parisi-Baradad et al. Citation2005, Citation2010; Sadighzadeh et al. Citation2014). The results of the Fourier or wavelet transform are then used in a third step to classify organisms using principal component or discriminant analysis over the descriptor of the otolith contours. The increase in computing power and the development of open source and free statistical software (R base core team Citation2018) enables the use of more efficient multiclass classification algorithms (Bourel and Segura Citation2018). These methods do not rely on classical assumptions (linearity, homoscedasticity) and can handle highly correlated covariates and a low number of cases (low N, high p problem), which are typical in fishery data. Otoliths with contour descriptors that can be grouped as similar are then assumed to come from the same population; thus, the stock discrimination analysis is straightforward.
Ling (Genypterus blacodes) is a species inhabiting the southern hemisphere that supports important fisheries in Chile, Argentina, Australia and New Zealand. The first official ling landings in Chile were recorded four decades ago, in 1978, and were harvested by industrial trawlers operating in the open sea of Chilean Patagonia (41°00’ – 57°00’S). Currently, fishing operations are conducted for a multi-species and multi-fleet fishery, which mainly targets southern hake (Merluccius australis). There are two fleet components, industrial and artisanal. The industrial fleet is comprised of trawl and longline vessels operating exclusively in the open sea, whereas the artisanal fishery is comprised of longline vessels that operate exclusively in the fjords and inner channels (see ). This fishery is managed on a total allowable catch (TAC) basis and an individual transferable quota (ITQ) share-based scheme. The TAC is estimated using catch-at-age population models calibrated using age and length structures and standardised capture per unit of effort (CPUE) time series from industrial and artisanal commercial vessels. Until 2004, conceptual population modelling considered a single stock unit for the entire Chilean Patagonia. Nevertheless, several differences in demographic characteristics (Wiff et al. Citation2006) and life history attributes, such as growth (Wiff et al. Citation2007), mortality (Wiff et al. Citation2011) and maturation (Baker et al. Citation2014), suggest the presence of two independent stocks. Thus, since 2005, stock assessment has been conducted assuming two independent stocks, one in the northern area (41°28,6’S-47°00’S) and the other in the southern area (47°00’-57°00’S), with independent recruitment and no migration between them. That two-stock hypothesis was entirely based on data collected from the open sea; therefore, information regarding basic fisheries and biological information of ling in the fjords and inner channels of Patagonia is fragmentary, at best. Ling may be relatively sedentary and possibly exhibit parental care (Cordo Citation1998), leading us to hypothesise that individuals inhabiting the fjords and inner channels comprise isolated stock units, given the vast area and complex interconnectivity among the fjords and inner channels in Patagonia (see ). However, investigations to test such hypotheses have not yet been conducted. Consequently, the main aim of this article was to evaluate population differences in the shape of the sagittal otolith in ling fished in the fjords and inner channels of three administrative regions in Chilean Patagonia using samples collected from small-scale longline surveys. Images of otolith contours were modelled using wavelet transformation, and discriminant analysis was used to classify the resulting contour (outline) descriptors.
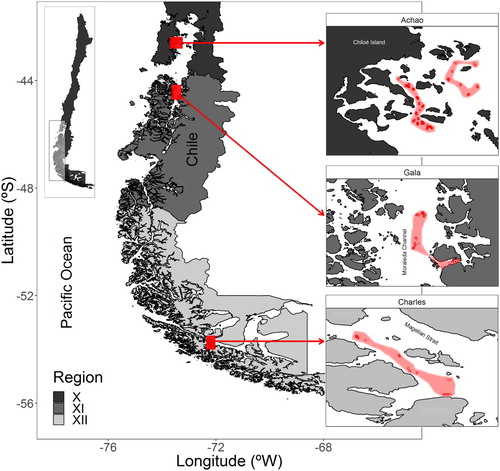
Figure 1. Map showing the sampling locations on each administrative region of Chilean Patagonia. Shaded area indicates the sampled polygons and red dots the sampled hauls on each locality (Achao, Gala and Charles).
Materials and Methods
Data
Longline artisanal fishery data were collected by on-board sampling. Three historical fishing grounds (determined from the results of fisher surveys) in fjords and channels were sampled twice (autumn and spring 2018) in each administrative region in Chile (regions X, XI and XII, ). In region X, we chose the locality of ‘Isla Achao’ (hereafter ‘Achao’). Likewise, in region XI, we chose the locality of ‘Isla Gala’ (hereafter ‘Gala’). Finally, in Region XII, ‘Islas Charles’ (hereafter ‘Charles’, ) was chosen. In each survey and region, fish were randomly selected, and both sagittal otoliths were extracted. The length (L, cm), sex, total weight (W, g) and gutted weight (GW, g) were recorded according to a sampling protocol (further sampling details can be found in Wiff et al. Citation2019).
A total of 253 pairs of otoliths were sampled in the two research surveys. Ninety-four samples were obtained from Achao (37%), 125 samples were obtained from Gala (49%), and 34 samples were obtained from Charles (13%). A summary of the sizes sampled per locality is shown in .
Table 1. Summary of the samples collected by locality and surveys.
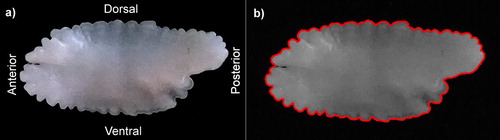
The recommended procedure for otolith image processing includes the use of a stereomicroscope (refer to guidelines in Libungan and Pálsson (Citation2015)). However, the otoliths of ling are relatively large, and we tested a simpler alternative, namely, the use of photographic cameras with different resolutions. The optimal images, in terms of resolution and file size, were obtained with a 2.4 megapixel camera. The camera was fitted with specially designed support to maintain a fixed distance, and special attention was paid to illumination to avoid altering the image brightness and contrast. Thus, all otoliths were uploaded and scanned under the same threshold level (0.2) by the shapeR package (Libungan and Pálsson Citation2015). In addition, an image of a scale bar was taken to calibrate otolith size. All 253 left otoliths were imaged over a dark background, with the external face towards the observer and the rostrum to the left (see (a)). The images were stored in JPEG format with file sizes ranging from 330 to 634 kb. To determine whether recorded images were suitable for modelling, trials testing images of increasing size were conducted until the shapeR package was able to recognise and model the otolith, as shown in (b).
Figure 2. Distal face of a left sagittal otolith of ling. (a) original image (b) image processed by ShapeR with the modelled contour as a red line.
Statistical method
Wavelet transforms were used to model the otolith contour using the shapeR package (Libungan and Pálsson Citation2015) for R-project (R Core Team Citation2018). From a mathematical viewpoint, wavelet transforms are a method of propagating a signal into a family of functions that represent the expansions and translations of a unique function known as a root wavelet, located in both space and wave number. The number of wavelet coefficients needed for the analysis was determined by assessing the deviation of the reconstructed wavelet otolith outline from the original outline (Libungan and Pálsson Citation2015). In addition, each wavelet coefficient was standardised according to the total length of fish (L) to remove the size effect on the comparison of otolith outlines (Lleonart et al. Citation2000). Shape differences were visually assessed using the outline means of reconstructed wavelets coefficients in each locality. The mean shape coefficient and standard deviation were plotted against the angle of the outline (contour) from which coefficients were extracted.
Standardisation of the wavelet coefficient using the total length of the fish removes the allometric effect of growth on the otolith but is unable to correct any ontogenetic changes an otolith may experience across sizes/ages (Hüssy Citation2008). The number of lobules or crenulations found in an otolith may change with age and size (Modin et al. Citation1996; Hüssy Citation2008). To account for these possible ontogenetic changes in otolith shape, we conducted a sensitivity analysis; during this analysis, increasingly narrow length ranges of fish, in which no significant differences were found in the mean fish size across fishing localities, were selected. Given that the size structure was not normality distributed, we compared the mean sizes using the Kruskal–Wallis non-parametric test. Several length ranges were tested, and we selected a range in which the mean length was not significantly different among fishing localities that also maximised the amount of data retained for further analysis.
Wavelet coefficients were then compared among localities using canonical analysis of principal coordinates (CAP, Anderson and Willis Citation2003). This is a method for ordination based on distance or dissimilarity measurements that provides a flexible and meaningful constrained ordination of data derived from ecological studies (Anderson and Willis Citation2003). The ordination of the averages in each locality was graphically examined along the first two canonical axes. A variance analysis (ANOVA-like) permutation test for constrained correspondence analysis was assessed using the R-package ‘vegan’ (Oksanen et al. Citation2013), and the significance of constraints was evaluated over 1000 permutations. This ANOVA-like permutation test does not require normality and is a robust test for significance in canonical axes (Legendre et al. Citation2011). In addition, linear discriminant analysis (LDA) was used to assess the classifier success for otolith outlines between different fishing localities. The assumption of homogeneity of variance in the LDA was assessed using Levene’s test. LDA is a useful statistical technique for dimensionality reduction for pattern recognition using linear combinations of features that linearly separate: in this case, the otolith outlines among fishing localities.
To evaluate the discriminatory power of the stock using morphometric measurements, we ran a multiclass Random Forest classification algorithm using the ‘randomForest’ package in R (Liaw and Wiener Citation2002). Random Forest is an ensemble method that constructs a large set of ‘weak’ classifiers (i.e. classification and regression trees) generated using the same data set and then combines them to stabilise unstable classifiers. This process generates a more stable and better-performing predictor (Hastie et al. Citation2009; James et al. Citation2014). Morphometric variables such as size, weight, length, and otolith outline descriptors were used as covariates to predict the locality where organisms were sampled (Achao, Gala and Charles). Random Forest is able to deal with highly colinear covariates (e.g. size/weight) and a high number of predictor variables and low sample sizes (high p, low n problems); thus, it is ideal to explore fishery data. We used the data from the first survey to teach the model and tested the classification ability using data from the second survey. This allowed us to test the real classification error and avoid bias from overfitted models (James et al. Citation2014). We constructed a confusion matrix and assessed overall and intra-class accuracy following Segura et al. (Citation2017).
Results
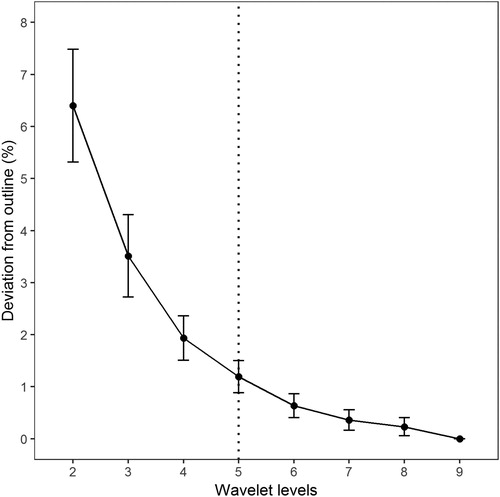
Sagittal otoliths in ling are oblong elliptic in shape, with a moderate thickness and moderately convex distal surface. The dorsal margin is slightly rounded with crenulations, whereas the ventral margin is generally smoother with lobulated extremes (). All these characteristics of the otolith outline were modelled using the wavelet transform and proved to be useful in the context of stock differentiation in ling. In terms of modelling, deviations from the outline were assessed according to the wavelet level (number of coefficients used, ). The deviation decreases quickly according to the wavelet levels, and 98.5% of the precision is found with only five coefficients, indicating good contour modelling performance.
Figure 3. Wavelet levels, dotted line shows the number of levels to achieved 98.5% of precision in the otolith contour modelling.
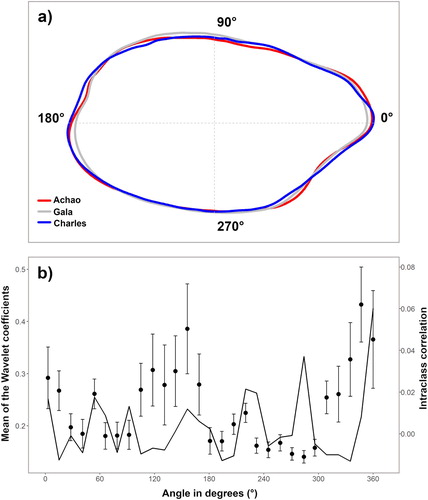
Wavelet analysis is a powerful tool that allowed the mean contour of the G. blacodes otoliths to be modelled in each locality ((a)). General features can be distinguished in the average otolith shape across localities. Otoliths from Gala tend to be shorter on the anterior-posterior axis and wider on the ventral-dorsal axis than those from Charles and Achao. Likewise, otoliths from Charles show a more acute posterior area and narrower ventral-dorsal axis than those from Gala and Achao. Characteristically, the posterior-ventral quadrant of otoliths from Achao exhibits a larger indentation than that of otoliths from Gala and Charles. The differences apparent in (a) were analysed quantitatively using the wavelet coefficient mean and interclass correlation, which indicated where (in terms of polar angles) the main differences in the average otolith occurred among the localities, as shown in (b). The main differences occur at approximately 300–360 degrees towards the posterior area and 120–180 degrees around the rostrum. Interclass correlations peak at 290–300 degrees, which is the ventral margin.
Figure 4. (a) Average shape of the otoliths using wavelet transform for the three sampled areas. Numbers show polar coordinates in angle degree, and doted lines represent the otolith centroid. (b) Mean and standard deviation (dots and whiskers) of the Wavelet coefficient and correlation interclass (solid line).
The ANOVA-like permutation test indicated significant differences in the otolith shape among the localities (p < 0.05). Sensitivity analysis found the minimum length range in which the mean length of fish across the three localities does not differ (p > 0.05) is 75–95 cm (comprising a total of 115 fish). An ANOVA permutation test conducted for this range also showed differences in otolith shape among the three localities (p < 0.05), indicating that the main hypothesis that otolith shape differs among localities is not affected by the length range.
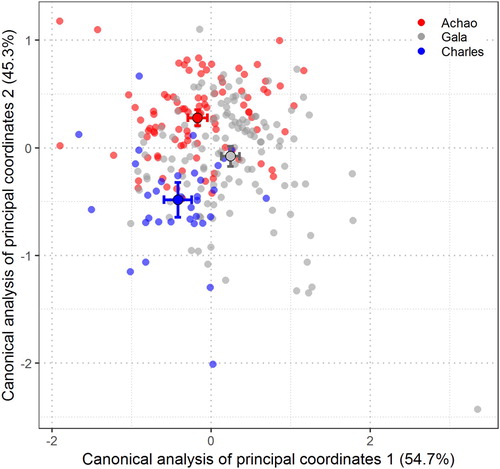
The variation in shape is shown in the canonical analysis of the principal coordinates (CAP, Anderson and Willis Citation2003) of the length-standardised wavelet coefficients. This analysis shows differences in the otolith outlines from the three sampled locations by plotting the first and second discriminant axes, CAP1 and CAP2, respectively. A total of 54.7% of otolith shape differences were found in the first discriminating axis (CAP1; ), where otoliths from Charles mainly deviate from those from Gala and Achao. On the other hand, otoliths obtained from Gala deviate slightly from those obtained from Achao mainly on the second discriminant axis (45.3%). Otoliths from Charles and Achao exhibit a generally tight distribution in , while Gala displays a widespread cloud of datapoints. This means that, among the three assessed localities, Gala has the most variable otolith contour shapes.
Figure 5. Canonical analysis of principal coordinates of the Wavelet for the three sampled areas. CAP1 and CAP2 are the first and second discriminant axis, respectively. Large circles represent the mean canonical value for each fishing locality. The interval surrounding the mean canonical values is one standard error (mean ± SE).
Levene’s test confirmed the assumption of homogeneity of variance of the wavelet coefficient (p > 0.05). The results of the LDA showed the overall score rate of the classifier error between localities, where Achao and Gala show a 32% similarity, while Achao and Charles (most extreme localities) show an 18% similarity. The classifier assigned Gala and Charles an intermediate similarity score (23%). Thus, a spatial pattern was revealed, with Achao and Gala, which are geographically connected by inner channels, showing the greatest similarity (higher classifier error) in comparison with the southernmost locality of Charles.
The random forest model was able to correctly classify 78% of the 79 fish from the test sample (i.e. those not used for model construction) based on the otolith shape. Classification accuracy varied among localities and was 72, 80 and 81% for fish from Achao, Gala and Charles, respectively. This model improved the classification accuracy by ∼10% with respect to LDA. The confusion matrix showed that the misclassification rate was asymmetric among classes ().
Table 2. Confusion matrix on test set from the Random forest classification of fish according to the otolith morphometry.
Discussion
This work provides information on the structure of ling populations along the southern coast of Chile. The results indicate that wavelet analysis is efficient in modelling ling otolith contours, and discriminant analyses showed differences among fishing grounds across the latitudinal gradient. The ling distribution extends across 20 latitudinal degrees along both sides of the South American continent. On the Chilean side of Patagonia, reproductively active female ling are found across their entire spatial distribution, both in the open sea (Baker et al. Citation2014) and inside fjords and inner channels (Aguayo et al. Citation2001; Wiff et al. Citation2019). In Argentina, at least three reproductive areas are recognised (Machinandiarena Citation1996). Likewise, the spawning of ling off the New Zealand coast has been consistently observed in at least six areas (Horn Citation2005). Reproductive isolation is one of the main characteristics that indicate differentiation among stocks and populations. The degree of isolation among reproductive groups can be tested using genetic analyses. For many years, genetic studies have been routinely used for stock differentiation in fisheries sciences. However, low levels of gene flow between stocks may preclude the detection of genetic differences (Begg and Waldman Citation1999); thus, a combination of other non-genetic methods may play a key role in stock differentiation (Ladroit et al. Citation2017). For example, genetic studies indicate no differences in ling along the New Zealand coast (Smith and Francis Citation1982), while life history parameters (Horn Citation2005) and otolith morphometry (Ladroit et al. Citation2017) show differences between fishing areas. Similar results have been found for ling in Chile; genetic studies report no differences between northern and southern areas (Canales-Aguirre et al. Citation2010), while life history parameters (Wiff et al. Citation2007; Wiff et al. Citation2011; Baker et al. Citation2014) and our otolith morphometry results, combined with powerful statistical analysis, show the contrary. These results reinforce the idea that stock differentiation for management purposes should be assessed using a combination of updated techniques such as analyses of genetic information, morphometry, parasites and life history traits.
Otolith morphometry provides a powerful tool to assess population differences, especially in light of recent advances in image processing and contour modelling. This is particularly important in the context of ling because their otolith contours, characterised by small indentations and rugosities, are complex and are not appropriately described by Fourier-based techniques (Wiff et al. Citation2019). Likewise, previous analyses on the otolith morphometry of ling using samples from the open sea and comparing linear hand-based measurements (e.g. radius, length and width) reported non-conclusive results regarding the population structure of this species (Chong Citation1993; Brito et al. Citation2008). Therefore, we advocate that the otolith morphometry applied to this species should be based on automatic image processing to reduce observation errors, and contours should be modelled using wavelet transform to appropriately capture otolith singularities. This method combined with machine learning statistical methods appears to be a powerful way to understand the spatial ecology of fish and classify individuals into populations.
Similar to many other fish species harvested for commercial purposes in Patagonia, ling live in fjords, inner channels and the open seas. Chilean Patagonia, among the least researched ocean regions in the world, has complex geomorphology and hydrology and is characterised by a variety of environments, such as fjords, channels, straits and estuaries (Silva and Palma Citation2008). Environmental conditions also show an important latitudinal gradient with a clear separation at approximately 48°S (Cuevas et al. Citation2019). The euphotic zone in the northern section of the Patagonia, where Achao and Gala are located, is associated with warmer waters and higher levels of primary production than the southern part of Patagonia (Charles). Bustos et al. (Citation2011) reported that larval stages of several commercial teleost fish, including ling, are found both in fjords and the open sea, supporting the hypothesis that reproduction occurs widely throughout the area for some species, such as southern hake (Medina et al. Citation2014). These findings are particularly important in the context of the stock differentiation of ling. Most of the current information about the life history and population dynamics of this species test the hypothesis related to the latitudinal gradient, but there is scarce information related to the comparison between fish inhabiting the fjords versus fish inhabiting the open sea. No hypotheses about recruitment are available for ling, but it has recently been reported that fish are also reproductively active inside the fjords and display levels of batch fecundity similar to those in the open sea (Wiff et al. Citation2019). These findings support the hypothesis that differences in the population attributes of individuals do not vary longitudinally and that latitudinal differences in environmental conditions may influence the spatial patterns of the life history traits of fish species, including otolith morphometry.
Habitat temperature is a key factor that affects nearly all biological processes, including otolith morphometry. For example, results for Atlantic cod (Gadus morhua) show that even a 2°C difference in water temperature can lead to changes in optical density (opacity) and the average width of the daily increments in otoliths (Neat et al. Citation2008). Such findings are important in the context of the latitudinal gradients of habitat temperature experienced by ling. Fishing grounds located in northern Patagonia (Achao, Gala) are shallower (ca 185 m) than those of Charles (ca 260 m) in the southern area. Castro et al. (Citation2015) and Cuevas et al. (Citation2019) show changes in water column temperature along the latitudinal gradient, which may have an effect on otolith shape.
Allometric growth in otoliths is an ontogenetic process that is affected by environmental conditions, which has been proven in demersal (Hüssy Citation2008; Neat et al. Citation2008; Leguá et al. Citation2013; Mille et al. Citation2016) and pelagic fishes (Libungan et al. Citation2015b). Controlled experiments demonstrated the relationship between temperature and feeding in the chemical composition and shape of otoliths in Atlantic cod (Hüssy Citation2008; Neat et al. Citation2008). The protein content of diet items affects otolith development, and thus, differences in the type and quality of food consumption result in differences in otolith shape (Mille et al. Citation2016). In the case of ling, the underlying causes of observed changes in life history parameters along the latitudinal gradient have not yet been determined. However, we hypothesised that changes in feeding and habitat temperature can be relevant in producing differences in otolith shape. In this context, Pool et al. (Citation1997), based on stomach content analysis, reported changes in the diet composition of ling along the latitudinal gradient in the fjords and inner channels of Chilean Patagonia. Therefore, differences in food items consumed by ling in the different fishing localities may affect otolith shape.
The isolation of ling in small reproductive units, in combination with the exposure of this species to different habitat environments and the fjords and inner channels of Patagonia that act as natural barriers, are key factors that may influence stock differentiation in this species. The results show differences in otolith shape among the three sampled localities. However, these differences are mainly observed in Charles, while Achao and Gala exhibit a substantial degree of mixing in both the LDA and random forest results (). This result is not unexpected considering the geography of this austral zone of Chile. Achao and Gala are closer to each other than to Charles and, connected through the Moraleda, are separated by no physical barriers (). Several fishing grounds for ling are located in a continuum between Achao and the southernmost part of the Moraleda Channel (Wiff et al. Citation2019). Given that shape differences in otoliths arise from both environmental and genetic causes (Cardinale et al. Citation2004; Hüssy et al. Citation2016), a high degree of mixing in the otolith shape is therefore expected between Achao and Gala. These localities belong to the same biogeographic region (Camus Citation2001) and also have similar habitat conditions (Cuevas et al. Citation2019). Despite being relatively sedentary (Cordo Citation1998), the close proximity of the Achao and fishing grounds along the Moraleda Channel led us to hypothesise that there is considerable mixing of individuals from both these zones. Conversely, individuals at Charles are geographically isolated from Gala and Achao, with no direct connectivity though the fjords and inner channels (). In addition, the fishing grounds in Region XII (refer to ) are sparse and not well defined (Wiff et al. Citation2019). This could be due to the low interest in targeting ling in Region XII, as reported in Wiff et al. (Citation2019), but could also be the result of severe fragmentation of the ling habitat, which precludes connectivity and mixing among the three sampled localities. Therefore, differences found in the otolith shape at Charles support the idea that Region XII represents one stock unit that is isolated from the northern area, possibly attributable to differences in connectivity and environmental conditions, such as habitat temperature and food items.
Since 2005, the ling fishery in Chile has been managed by assuming two independent stock units, one in the northern area (41°28,6’S-47°00’S) and the other in the southern area (47°00’S-57°00’S). Differences in life history attributes have been reported between these two areas in relation to growth (Wiff et al. Citation2007), mortality (Wiff et al. Citation2011) and length at maturity (Baker et al. Citation2014) of individuals collected from the open sea. Recently, Wiff et al. (Citation2019) reported differences in female maturity ogives between the northern and southern areas for individuals collected inside the fjords and inner channels. Females inhabiting the southern area reached larger sizes, matured later and exhibited higher survival rates than their northern counterparts. These differences in life history traits also trigger differences in resilience to fishing exploitation (Wiff et al. Citation2016; Wiff et al. Citation2018); thus, management measurements should also be differentiated between the northern and southern areas. Our results add additional information supporting the hypothesis that fish inhabiting the northern and southern areas, either in the open sea or fjords, should be treated as independent stock units. We also suggest that the use of otolith morphology, combined with sound statistical analysis, could help improve management along this vast and fragmented habitat shared by several fish species in Chilean Patagonia.
Acknowledgements
We are sincerely grateful to the three anonymous reviewers for their valuable comments and suggestions, which greatly improved an early version of this manuscript. We also thank Michael Rojas and Manuel Vargas for their help in otolith sampling and image processing and Aurora Guerrero (under the secretariat of fisheries) for her logistic help during the development of this project.
Disclosure statement
No potential conflict of interest was reported by the authors.
Additional information
Funding
References
- Aguayo M, Payá I, Céspedes R, Miranda H, Catasti V, Lillo S, Galvéz P, Adasme L, Balbontín F, Bravo R. 2001. Dinámica reproductiva de merluza del sur y congrio dorado. Technical Report FIP 99/15. (Request a copy at: www.ifop.cl (In spanish)).
- Anderson MJ, Willis TJ. 2003. Canonical analysis of principal coordinates: a useful method of constrained ordination for ecology. Ecology. 84:511–525. doi: 10.1890/0012-9658(2003)084[0511:CAOPCA]2.0.CO;2
- Baker LL, Wiff R, Quiroz JC, Flores A, Cespedes R, Barrientos MA, Ojeda V, Gatica C. 2014. Reproductive ecology of female pink cusk-eel (Genypterus blacodes): Evaluating differences between fishery management zones in the Chilean austral zone. Environ Biol Fish. 97:1083–1093. doi: 10.1007/s10641-013-0199-2
- Begg GA, Waldman JR. 1999. An holistic approach to fish stock identification. Fish Res. 43:35–44. doi: 10.1016/S0165-7836(99)00065-X
- Bolles KL, Begg GA. 2000. Distinctions between silver hake (Merluccius bilinearis) stocks in U.S. waters of the northwest Atlantic based on whole otolith morphometric. Fish Bull. 98:451–462.
- Bourel M, Segura AM. 2018. Multiclass classification methods in ecology. Ecol Indic. 85:1012–1021. doi: 10.1016/j.ecolind.2017.11.031
- Brito CG, Ojeda V, Rodríguez L. 2008. Análisis morfométrico de otolitos de congrio dorado (Genypterus blacodes) como mecanismo de discriminación de unidades poblacionales y aplicación de redes neuronales artificiales en estimación de edad. In: Gutíerrez JC, Yáñez E, editor(s). Nuevas aproximaciones metodológicas para el análisis de pesquerías. España: Universidad de Huelva, Servicio de Publicaciones; pp. 73–88.
- Bustos CA, Landaeta MF, Balbontín F. 2011. Ichthyoplankton spatial distribution and its relation with water column stratification in fjords of southern Chile (46°48’–50°09’S) in austral spring 1996 and 2008. Cont Shelf Res. 31:293–303. doi: 10.1016/j.csr.2010.03.013
- Campana SE, Casselman JM. 1993. Stock discrimination using otolith shape analysis. Can J Fish Aquat Sci. 50:1062–1083. doi: 10.1139/f93-123
- Camus PA. 2001. Marine biogeography of continental Chile. Rev Chil Hist Nat. 74:587–617. doi: 10.4067/S0716-078X2001000300008
- Canales-Aguirre CB, Ferrada S, Hernández CE, Galleguillos R. 2010. Population structure and demographic history of Genypterus blacodes using microsatellite loci. Fish Res. 106:102–106. doi: 10.1016/j.fishres.2010.06.010
- Cardinale M, Doering-Arjes P, Kastowsky M, Mosegaard H. 2004. Effects of sex, stock, and environment on the shape of known-age Atlantic cod (Gadus morhua) otoliths. Can J Fish Aquat Sci. 61:158–167. doi: 10.1139/f03-151
- Castro L, Soto S, Llanos A, Pérez I, Cubillos L, Alarcón R, Claramunt G, Herrera G, Parada C, Escalona E, Barrientos P. 2015. Identificación de zonas de desove y estadios tempranos de pelágicos pequeños en aguas interiores de la X y XI Regiones. Technical Report FIP 2013-17.
- Chong J. 1993. Estimación de fecundidad y talla de primera madurez sexual del congrio dorado (Genypterus blacodes) en la pesquería sur-austral. Technical report IFOP. (Request a copy at: www.ifop.cl (In Spanish)).
- Cordo HD. 1998. Estandarización del esfuerzo de pesca ejercido sobre el abadejo (Genypterus blacodes), período 1986-1996. INIDEP, DNI Inf Int. 98(6):18.
- Cuevas LA, Tapia FJ, Iriarte JL, González HE, Silva N, Vargas CA. 2019. Interplay between freshwater discharge and oceanic waters modulates phytoplankton size-structure in fjords and channel systems of the Chilean Patagonia. Progr Oceanogr. 173:103–113. doi: 10.1016/j.pocean.2019.02.012
- Hastie T.J, Tibshirani R.J., Friedman J.H. 2009. The elements of statistical learning : Data mining, inference, and prediction. New York: Springer-Verlag.
- Horn PL. 2005. A review of the stock structure of ling (Genypterus blacodes) in New Zealand waters. New Zealand Fisheries Assessment Report 2005/59.
- Hüssy K. 2008. Otolith shape in juvenile cod (Gadus morhua): ontogenetic and environmental effects. J Exp Mar Biol Ecol. 364:35–41. doi: 10.1016/j.jembe.2008.06.026
- Hüssy K, Mosegaard H, Albertsen CM, Nielsen EE, Hemmer-Hansen J, Eero M. 2016. Evaluation of otolith shape as a tool for stock discrimination in marine fishes using Baltic Sea cod as a case study. Fish Res. 174:210–218. doi: 10.1016/j.fishres.2015.10.010
- James G, Witten D, Hastie T, Tibshirani R. 2014. An introduction to statistical learning: with applications in R. Springer Texts in Statistics. New York: Springer-Verlag.
- Kuhl FP, Giardina CR. 1982. Elliptic Fourier features of a closed contour. Comp Gr Image Process. 18:236–258. doi: 10.1016/0146-664X(82)90034-X
- Ladroit Y, Ó Maolagáin C, Horn PL. 2017. An investigation of otolith shape analysis as a tool to determine stock structure of ling (Genypterus blacodes). New Zealand Fisheries Assessment Report 2017/24.
- Legendre P, Oksanen J, ter Braak CJF. 2011. Testing the significance of canonical axes in redundancy analysis. Methods Ecol Evol. 2:269–277. doi: 10.1111/j.2041-210X.2010.00078.x
- Leguá J, Plaza G, Pérez D, Arkhipkin A. 2013. Otolith shape analysis as a tool for stock identification of the southern blue whiting, Micromesistius australis. Lat Am J Aquat Res. 41:479–489.
- Liaw A, Wiener M. 2002. Classification and regression by random forest. Newspaper Res J. 23:18–31. doi: 10.1177/073953290202300203
- Libungan L, Óskarsson GJ, Slotte A, Jacobsen JA, Pálsson S. 2015a. Otolith shape: a population marker for Atlantic herring Clupea harengus. J Fish Biol. 86:1377–1395. doi: 10.1111/jfb.12647
- Libungan L, Pálsson S. 2015. Shaper: an R package to study otolith shape variation among fish populations. PLoS ONE. DOI:10.1371/journal.pone.0121102.
- Libungan L, Slotte A, Husebø Å, Godiksen JA, Pálsson S. 2015b. Latitudinal gradient in otolith shape among local populations of atlantic herring (Clupea harengus L.) in Norway. PLoS ONE. 10(6):e0130847. doi: 10.1371/journal.pone.0130847
- Lleonart J, Salat J, Torres G. 2000. Removing allometric effects of body size in morphological analysis. J Theor Biol. 205:85–93. doi: 10.1006/jtbi.2000.2043
- Machinandiarena L. 1996. Estado actual del conocimiento de la reproducción y las áreas de cría del abadejo Genypterus blacodes. Inf. Téc. Int. DNI - INIDEP N° 114.
- Medina G, Castro L, Pantoja S. 2014. Fatty acids in Merluccius australis tissues, a comparison between females from inshore and offshore spawning areas in the Chilean Patagonia. Fish Res. 160:41–49. doi: 10.1016/j.fishres.2013.11.005
- Mille T, Mahé K, Cachera M, Villanueva MC, de Pontual H, Ernande B. 2016. Diet is correlated with otolith shape in marine fish. Mar Ecol Prog. 555:167–184. doi: 10.3354/meps11784
- Modin J, Fagerholm B, Gunnarsson B, Pihl L. 1996. Changes in otolith microstructure at metamorphosis of plaice, Pleuronectes platessa L. ICES J Mar Sci. 53:745–748. doi: 10.1006/jmsc.1996.0094
- Neat FC, Wright PJ, Fryer RJ. 2008. Temperature effects on otolith pattern formation in Atlantic cod Gadus morhua. J Fish Biol. 73:2527–2541. doi: 10.1111/j.1095-8649.2008.02107.x
- Oksanen J, Blanchet FG, Kindt R, Legendre P, et al. 2013. Vegan: community ecology package. Available at http://cran.r-project.org/web/packages/vegan/index.html.
- Parisi-Baradad V, Lombarte A, García-Ladona E, Cabestany J, Piera J, Chic O. 2005. Otolith shape contour analysis using affine transformation invariante wavelet transforms and curvature scale representation. Mar Fresh Res. 56:795–804. doi: 10.1071/MF04162
- Parisi-Baradad V, Manjabacas A, Lombarte A, Olivella R, Chic Ò, Piera J, García-Ladona E. 2010. Automated Taxon Identification of teleost fishes using an otolith online database_AFORO. Fish Res. 105:13–20. doi: 10.1016/j.fishres.2010.02.005
- Pool H, Balbontín F, Montenegro C, Cortés N, Arriaza M. 1997. Interacciones tróficas en recursos demersales en la zona sur austral. Technical Report FIP 94/32. (Request a copy at: www.ifop.cl (In Spanish)).
- R Core Team. 2018. R: A language and environment for statistical computing. Vienna, Austri: R Foundation for Statistical Computing. URL http://www.R-project.org/.
- Renán X, Montero-Muñoz J, Garza-Pérez JR, Brulé T. 2016. Age and stock analysis using otolith shape in gags from the southern gulf of Mexico. Trans Am Fish Soc. 145:1252–1265. doi: 10.1080/00028487.2016.1217928
- Sadighzadeh Z, Tuset VM, Valinassab T, Vosugi G. 2014. Use of otolith shape for stock identification of John's snapper, Lutjanus johnii (Pisces: Lutjanidae), from the Persian Gulf and the Oman Sea. Fish Res. 155:59–63. doi: 10.1016/j.fishres.2014.02.024
- Salimi N, Loh KH, Dhillon SK, Chong VC. 2016. Fully-automated identification of fish species based on otolith contour: using short-time Fourier transform and discriminant analysis (STFT-DA). PeerJ. 4:e1664. doi:10.7717/peerj.1664.
- Segura AM, Piccini C, Nogueira L, Alcántara I, Calliari D, Kruk C. 2017. Increased sampled volume improves Microcystis aeruginosa complex (MAC) colonies detection and prediction using Random Forests. Ecol Indic. 79:347–354. doi: 10.1016/j.ecolind.2017.04.047
- Silva N, Palma S. 2008. The CIMAR program in the austral chilean channels and fjords. In: Silva N., Palma S., editors. Progress in the Oceanographic knowledge of chilean interior waters, from Puerto Montt to Cape Horn. Valparaíso: Comité Oceanográfico Nacional - Pontificia Universidad Católica de Valparaíso; p. 11–15.
- Smith PJ, Francis RICC. 1982. A glucosephosphate isomerase polymorphism in New Zealand ling Genypterus blacodes. Comp Biochem Physiol B. 73:451–455. doi: 10.1016/0305-0491(82)90057-8
- Stransky C. 2013. Morphometric outlines. In: Cadrin SX, Kerr LA, Mariani S, editor(s). Stock identification methods. 2nd ed. London, UK: Elsevier; pp. 129–140.
- Wiff R, Flores A, Neira S, Caneco B. 2018. Estimating steepness of the stock recruitment relationship in Chilean fish stock using meta-analysis. Fish Res. 200:61–67. doi: 10.1016/j.fishres.2017.12.004
- Wiff R, Ojeda V, Quiroz JC. 2006. Evaluación de stocks y cuota total permisible para congrio dorado 2006. Technical report IFOP-SUBPESCA. (Request a copy at: www.ifop.cl (In Spanish)).
- Wiff R, Ojeda V, Quiroz JC. 2007. Age and growth in pink cusk-eel (Genypterus blacodes) off the Chilean austral zone: Evaluating differences between management fishing zones. J Appl Ichthyol. 23:270–272. doi: 10.1111/j.1439-0426.2007.00854.x
- Wiff R, Queirolo D, Ahumada M, Gacitúa S, Flores A, Apablaza P, Gelcich S. 2019. Construcción de indicadores de abundancia de congrio dorado en la pesquería demersal austral (PDA). Technical report FIPA 2017-46.
- Wiff R, Quiroz JC, Neira S, Gacitúa S, Barrientos MA. 2016. Chilean fishing law, maximum sustainable yield and the stock-recruitment relationship. Lat Am J Aquat Res. 44:380–391. doi: 10.3856/vol44-issue2-fulltext-19
- Wiff R, Quiroz JC, Ojeda V, Barrientos MA. 2011. Estimation of natural mortality and uncertainty in pink cusk-eel (Genypterus blacodes Schneider, 1801) in southern Chile. Lat Amer J Aquat Res. 39:316–326. doi: 10.3856/vol39-issue2-fulltext-13