
ABSTRACT
Microplastic pollution in aquatic systems has been reported globally at an alarming rate, with an increasing number of documented negative biological consequences. Research on microplastic pollution in freshwaters has barely begun in New Zealand, and few studies from smaller lotic systems such as streams exist globally. We investigated the extent of microplastic pollution within urban streams across New Zealand and determined if microplastic concentrations were related to human population density and urbanisation of streams. Fifty-two streams were surveyed across five urban agglomerations in January 2019. Microplastics were found in samples from all sites at densities ranging from <1 to 44 items/m3. This concentration range was comparable to global data but lower than reported in another recent New Zealand study, probably due to differences in sampling methodology. Microplastic pollution was similar across all urban centres, and neither length of urbanised catchment nor urban proportion of the stream were significant predictors of microplastic concentrations. These findings suggest microplastic pollution in New Zealand streams are comparable to larger aquatic systems globally, and that smaller urban streams are significant transport pathways for microplastics. We also recommend standardising microplastic sampling methods to a greater extent in the future, to improve comparability across studies.
Introduction
Worldwide plastic production is at an all-time high, with over 335 million metric tonnes being produced in 2016 alone (Plastics Europe Citation2016; Geyer et al. Citation2017). Future projections see this number increasing more than 5-fold in the next 30 years (Geyer et al. Citation2017). Of the plastic produced, it is estimated that over 10% ends up in aquatic environments such as streams, rivers, lakes and oceans where plastic particles accumulate in large volumes (Klein et al. Citation2017). Much of the plastic particles that accumulate in aquatic environments are smaller than 5 mm in length and generally classified as ‘microplastics’ (Rist and Hartmann Citation2017; Jiang Citation2018; Zhao et al. Citation2018). Compared to larger plastic particles, microplastics are much more difficult to trace and distinguish. They also represent a more serious potential threat to aquatic ecosystems and the organisms that inhabit them. Although both types of plastics may contain toxic chemicals such as plasticisers, only microplastics are small enough to settle into substrata, be ingested by organisms, and pass through biological barriers (Shim and Thomposon Citation2015; Clunies-Ross et al. Citation2016; Rist and Hartmann Citation2017; Harrison et al. Citation2018; Zhao et al. Citation2018). Microplastics include a wide range of polymers and shape categories and can be found in primary or secondary forms (Klein et al. Citation2017; Rist and Hartmann Citation2017). Primary microplastics are manufactured at a size smaller than 5 mm and include the shape classes of beads and pellets (Shim and Thomposon Citation2015; Klein et al. Citation2017). Secondary microplastics are fragments, fibres or foams formed from broken-down or degraded, larger plastics and contain the shape categories of fragments and fibres (McCormick et al. Citation2016; Klein et al. Citation2017; Jiang Citation2018).
Thus far, the majority of aquatic microplastics studies (>80%) have been conducted in the marine realm (Wagner et al. Citation2014; Lambert and Wagner Citation2017; Blettler et al. Citation2018; Jiang Citation2018). These studies have largely focused on two main areas: extent of microplastics pollution (accumulation, sources, concentrations) and biological impacts on marine organisms. Microplastics have been found in the water column, at the sea surface, in marine sediments, and washed up along coastlines (Shim and Thomposon Citation2015; Dai et al. Citation2018; Zhao et al. Citation2018). They have been found across most of the world's oceans and beaches, not just in areas with dense human populations, but also in relatively pristine and isolated areas (Clunies-Ross et al. Citation2016; Dai et al. Citation2018; Hamid et al. Citation2018; Zhao et al. Citation2018). Microplastic concentrations have been related to anthropogenic pressure, offshore and onshore winds, and ocean currents (Dai et al. Citation2018; Hamid et al. Citation2018). However, there is a general lack of data on where microplastics are distributed in aquatic systems, which makes it difficult to fully evaluate the effects they could have on these systems. In terms of their biological impacts, microplastics have been detected and shown to bioaccumulate in marine organisms across all trophic levels, with varying direct and indirect effects on the fitness of the studied organisms (Shim and Thomposon Citation2015; Karthik et al. Citation2018; Perez-Venegas et al. Citation2018; Provencher et al. Citation2018).
Compared to marine systems, microplastic studies in freshwater systems are much rarer (Lambert and Wagner Citation2017; Blettler et al. Citation2018). Despite this, there is sufficient evidence to indicate that microplastics are widespread in freshwaters, with these plastics having been found in rivers or lakes on every continent in the world (Horton et al. Citation2017; Khan et al. Citation2017; Lambert and Wagner Citation2017; Jiang Citation2018). The majority of these data come from Asia, North America and Europe. In these studies, microplastics have been observed in both the bed substrata and the water column of many rivers, and the concentrations of microplastics found have been comparable to those in marine systems (Lambert and Wagner Citation2017). For example, average microplastic particle density along the River Rhine in Germany is 892,777/km2, and over 100 microplastic particles per m3 of water have been found in the River Seine in France (Mani et al. Citation2015; Klein et al. Citation2017). The main sources of this microplastic pollution in rivers have been shown to be urban runoff, especially during periods of high rainfall (Hamid et al. Citation2018), grey water from urban areas (Dris et al. Citation2017), and wastewater treatment plant outflows (McCormick et al. Citation2016; Lambert and Wagner Citation2017; Jiang Citation2018; Li et al. Citation2018b).
Similar to marine biota, microplastics have been found to bioaccumulate in freshwater organisms, be transferred across trophic levels, reduce fitness and increase mortality (Duis and Coors Citation2016; Lambert and Wagner Citation2017; Mattsson et al. Citation2017; Jabeen et al. Citation2018; Ehlers et al. Citation2019). However, the distribution of existing microplastics studies in freshwaters across the world is highly uneven, and there is a general lack of studies on smaller freshwater bodies such as low-order streams, with the majority of existing research focusing on large rivers (Blettler et al. Citation2018; Dikareva and Simon Citation2019). Addressing this knowledge gap is necessary for gaining a better understanding to what extent freshwater organisms are being exposed to microplastics, because small streams are the primary interface between the land (where plastics are used) and the waterways draining these catchments (Dikareva and Simon Citation2019). Consequently, further studies into the extent of microplastic pollution in smaller streams are required.
Against this scientific background, the present study contributes to determining the extent of microplastic pollution in New Zealand's urban waterways. At the time the fieldwork for our study took place (January 2019), no published data existed on this topic. Since then, one study has been published (Dikareva and Simon Citation2019), a survey of 21 streams in the Auckland metropolitan area, which found that that microplastics abundance was weakly positively related to residential land-use cover. Our study complements this earlier study by surveying 52 urban streams in five of the largest urban agglomerations in New Zealand across both main islands (Auckland, Hamilton, Wellington, Christchurch and Dunedin). In a global context, our study also helps address the general lack of research on microplastic pollution in smaller running-water ecosystems and increases our understanding of the factors that may drive microplastic pollution in these ecosystems, such as urbanisation and physical stream characteristics. The study aimed to determine the extent of microplastic pollution in urban streams across New Zealand. We examined water samples for microplastics and investigated if urbanisation influenced microplastic densities, using total stream length, length of urbanised catchment and urban proportion of the stream as predictor variables. Based on the findings of the pertaining literature, we hypothesised that (1) the majority of sampled sites will have microplastics present, (2) microplastic concentrations and make-up will be comparable to larger rivers globally (Dikareva and Simon Citation2019), (3) concentrations will decrease from larger to smaller urban centres, paralleling human population size (Wang et al. Citation2017; Dai et al. Citation2018), and (4) concentrations will be positively correlated with the degree of urbanisation upstream of each site (Wang et al. Citation2017; Dai et al. Citation2018).
Methods
Site selection
All studied stream sites were located in the urban agglomerations of Auckland, Hamilton, the greater Wellington area, Christchurch and Dunedin. Stream sites were selected using Google Maps satellite data, freshwater data from regional and city council websites, and advice from individuals with knowledge of the areas. As preliminary site selection was conducted using online resources, the suitability of each site for sampling needed to be confirmed in the field. All pre-selected stream sites were visited and sampled if possible. Sites that were inaccessible, too deep, too wide (for most of the streamflow to be sampled by three drift nets, see below) or fast-flowing were excluded due to safety reasons and physical constraints. Stream sites that were too small to allow deploying at least one drift net (see below) or had very low or no discharge were excluded as well. Using these selection criteria, 52 suitable sites were identified and sampled. These sites were all from different streams and spanned a wide gradient of urbanisation intensity, from 6% to 100% urbanised catchment area (see Table S1 for site characteristics and Fig. S1 for site locations). The number of suitable stream sites in each urban agglomeration varied greatly, therefore it was impossible to sample an even number of sites per region (11 in Auckland, 10 in Hamilton, 18 in Wellington, 10 in Christchurch and 3 in Dunedin).
Stream sampling
All 52 sites were sampled during a three-week period starting on 6th January 2019. During this period all streams were at normal flows (around annual median flow) bar two, site 16 and site 27, which were at slightly elevated flows due to recent rainfall. At each site, we determined the GPS coordinates, measured stream width, and estimated the degree of channelisation (1–5, with 5 being extremely modified, e.g. complete concrete channel, and 1 being without any visible human impact) and the dominant substratum type (mud/silt, sand, gravels, cobbles, rock and concrete) (Table S1). We also noted any obvious nearby point sources of pollution (stormwater drains). Stream width and degree of channelisation were later included as predictor variables in the statistical analysis (see below).
The microplastic sampling technique was adapted from previous microplastic water column sampling in streams (McCormick et al. Citation2016; Klein et al. Citation2017). Large drift nets (frame 0.5 × 0.3 m) were deployed in a fast-flowing area of each stream site from the surface water layer of the stream. A mesh size of 250 µm was used as coarser-meshed nets exclude small microplastics from being sampled and smaller mesh sizes are prone to clogging (Shim and Thomposon Citation2015; McCormick et al. Citation2016; Klein et al. Citation2017). The number of nets deployed varied depending on stream width and ranged from 1 to 3 nets. Deploying nets this way meant the discharge from the majority of the stream channel was captured, not just a small area of the surface water layer or the thalweg of the stream. Such cross-sectional study designs may represent a more realistic approach to microplastic sampling than using smaller nets that collect lower volumes of water from much smaller areas, which can lead to overestimating microplastic concentrations (Mendoza and Balcer Citation2019).
The top of each net was deployed flush with the water surface of the stream and nets were kept at a consistent height, perpendicular to the main flow direction, for 15 minutes. At the beginning and end of this period, flow velocity was measured at the centre of each net (using a Marsh McBirney FlowMate) so the average velocity over the sampling period could be calculated. In all cases where drift nets were not fully submerged, water depth was measured to allow calculating the water volume flowing through each net during the sampling period. After sampling, the contents of the nets were pooled and rinsed into 1-L containers using unfiltered site water. Nets were also rinsed on the outside of the netting, and again before being deployed at each new site, to avoid any cross-contamination of microplastic particles.
Laboratory analysis
The laboratory protocol for identifying and quantifying microplastics was adapted from water column sampling in previous marine and freshwater studies (McCormick et al. Citation2016; Klein et al. Citation2017). Stream samples were first filtered through two stacked metal sieves (mesh size 5 mm and 250 μm, respectively) to separate them into macro- and micro-sized particles. The two size classes were then rinsed into separate trays and placed in drying ovens at 65°C until all water had evaporated (for 16–24 hours, depending on the amount of water in the tray). After drying, the larger particle size class (>5mm) was examined by eye and any macroplastics particles found were counted and classified. To separate microplastics from organic material in the size class <5 mm, organic material was degraded and digested by way of wet peroxide oxidation. Hydrogen peroxide (0.05 mol/L Fe(II) and 30% hydrogen peroxide) was added to the sample and heated to 75°C until bubbling occurred. This procedure was repeated until most of the organic material had been digested by the solution. Wet peroxide oxidation at this temperature degrades organic material while plastic material resists degradation (McCormick et al. Citation2016; Klein et al. Citation2017).
To further separate microplastics from any leftover organic material, sodium chloride was added to the solution for density separation (final concentration 6 mol/L). The solution was then covered and left to stand overnight (McCormick et al. Citation2016). After adding sodium chloride, most of the plastic particles (an estimated 50%–70%) floated to the surface of the solution while any other material remained at the bottom. After this separation step, all particles floating at the surface were collected and examined under an Olympus SZ51 dissecting microscope (magnification 8–40X) for quantification and categorisation. Any material remaining in the solution was collected and also examined under the microscope to ensure no microplastic particles were missed.
Under the microscope, all microplastic particles were counted, measured and sorted into the previously described categories of beads, fragments, and fibres. Polystyrene was given its own category as it was so numerous. Films were absent from our samples and were therefore not categorised. Colour and shape of each particle were also recorded. Microplastics found in the samples were examined by at least two people to reduce the possibility of misidentification. In some cases, microplastics were difficult to distinguish from organic matter or other similar materials such as glass or substances that resembled fibres. In such cases, these materials were placed on a hot plate and heated. Microplastics would melt whereas other materials would not, thus identifying them as non-microplastics. Any macroplastics found during the laboratory analysis were also recorded for further examination and included in the data analysis, as macroplastics data have often been discarded in previous related studies (Blettler et al. Citation2018). Samples were kept covered at all times unless being directly examined under the microscope to avoid contamination. In some samples, we found a few long, clear fibres that resembled fibres from drift net material. Any fibres such as these were removed from the samples and excluded from the analysis.
Data analysis
All statistical analyses were performed in SPSS (IBM SPSS Statistics, Version 24). Multiple linear regressions (stepwise backward and forward selections) were used to determine the relationships between six continuous predictor variables and eight microplastics response variables. Predictors were stream width (m), degree of channelisation (1–5), water flow velocity (m/s), total stream length (km), length of urbanised catchment (km), and urban proportion of the stream (%). A correlation matrix revealed that none of these predictors were strongly correlated, and collinearity statistics obtained during the analyses confirmed that no collinearity problems occurred. The response variables were total microplastic items, total microplastic concentrations/m3, and concentrations of the three microplastic size categories and the three most common shape categories. To fulfil the assumptions of the analysis, all these response variables were natural log-transformed after exploratory data analysis. The backward stepwise selection method (removal probability P = 0.10) provided a more inclusive assessment of the predictors related to microplastics responses, whereas the forward selection method (entry probability P = 0.05) provided a more conservative assessment.
Total stream length and length of urbanised catchment were measured using satellite images from Google Earth (2019). Length of urban catchment and urban proportion (length of urbanised catchment/total stream length) were chosen as predictors because microplastic concentrations have been found to be significantly related to urban population densities and anthropogenic pressure (Wang et al. Citation2017; Dai et al. Citation2018). Total stream length was selected because longer catchments provide more pathways and opportunities for microplastic pollution to enter stream systems. Flow velocity (averaged across the 1–3 drift nets at each site) was selected because faster-flowing streams might transport disproportionally higher numbers of microplastic items.
Our data are displayed as microplastic items/m3 for ease of comparison with the majority of previous freshwater microplastics studies (Mendoza and Balcer Citation2019). Where appropriate, however, the data are also expressed in total items captured per site during the 15- minute sampling period, because this allows extrapolating microplastic fluxes over longer time periods (McCormick et al. Citation2016). To determine potential differences in microplastic densities between regions, a one-way ANOVA was performed.
Results
Microplastics were found in every stream site sample. The extent of microplastic pollution across the 52 sites spanned a gradient of several orders of magnitude. The total number of microplastic items found per site ranged from 1 to >4800 (Table S2), which equated to densities between <1 and 44.8 items/m3 of water (, Table S3). Distributions of size ranges and microplastic classes also varied greatly. There was no significant correlation between the total number of microplastic items per site and microplastic concentrations per m3 of stream water (R2 = 0.07, p = 0.08), indicating that the two metrics complemented each other.
Figure 1. Microplastic distributions across all 52 study sites, expressed as the number of microplastic items per m3 of water, by size categories (a) and shape categories (b). The violin plot outlines illustrate kernel probability density with the width of the shaded area representing the proportion of data found at this concentration (van der Bijl et al. Citation2015).
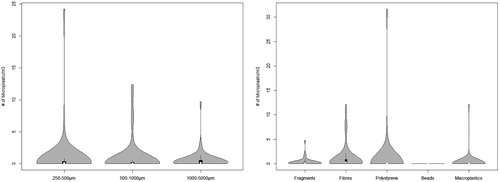
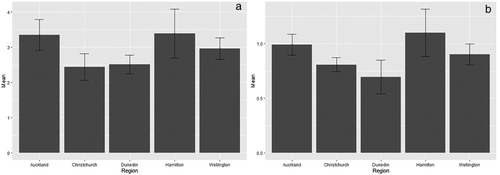
A total of 7178 microplastic items were collected across all sites combined. Of these items, 43% were in the 250–500 μm size class, 35% were 500–1000 μm and 22% were 1000–5000 μm. In addition, 1469 macroplastics were found, making up 17% of the total plastic items collected. In terms of microplastic classes, the most common type was polystyrene, which accounted for 51% of the total microplastic items found (). This was followed by fibres (33%), then fragments (15%), and lastly beads (<1%) (see Figure S2 for some examples). There were no significant differences between regions for total microplastic items or total microplastics/m3 ().
Figure 2. Microplastic composition in size classes (a) and identification classes (b).
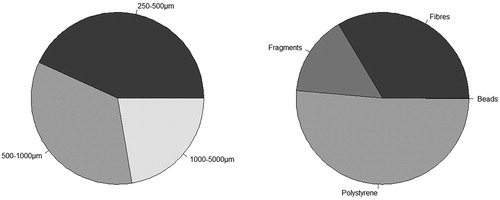
Figure 3. (a) Mean total number (LN-transformed) of microplastic items caught during the 15-minute sampling period by region (DF = 4, p = 0.57, eta2 = 0.06) and (b) mean fourth-root number of microplastics per m3 of water by region (DF = 4, p = 0.47, eta2 = 0.07).
Microplastic pollution increased more than 40-fold across the 16 most polluted sites, from 1.0 to 44.8 microplastics items/m3 (). These sites were distributed relatively evenly among the five regions. Across the 16 sites, the total number of microplastic items collected per site still varied over three orders of magnitude, from 11 to 4833 items. Microplastic densities per m3 also varied considerably across these sites, for both individual microplastic size classes and identification classes. For example, the polystyrene identification class varied from 0 to 31.7 items/m3.
Table 1. The 16 most polluted stream sites based on microplastic concentrations per m3. Shown are total microplastic items per site caught in 15 minutes, total numbers extrapolated over 24 hours (based on the flow velocities measured during sampling), and microplastic concentrations/m3 for each size class and identification class.
In the regression analyses, none of the observed correlative relationships were strong, and several had R2-values below 0.10, indicating relationships likely to be of limited biological relevance (see Nakagawa and Cuthill Citation2007). The total number of microplastic items per site was positively related to the degree of channelisation and total stream length in the model selected by stepwise backward selection (R2 = 0.14; ). The more conservative model selected by forward selection (R2 = 0.08) contained only channelisation (a). Total microplastic concentration per m3 of water was unrelated to any of the examined six predictor variables.
Figure 4. The four strongest (in relative terms) relationships from the multiple linear regression analysis. A. Total microplastic items (LN-transformed) versus channelisation (R2 = 0.08, p = 0.05), B. 1000–5000 µm microplastics/m3 (LN) versus channelisation (R2 = 0.07, p = 0.06), C. Microplastic fibres/m3 (LN) versus stream width (m) (R2 = 0.10, p = 0.02), D. Polystyrene/m3 (LN) versus channelisation (R2 = 0.06, p = 0.08). Note that 0.01 was added to the three microplastic concentration variables before LN-transformation because they contained zeros.
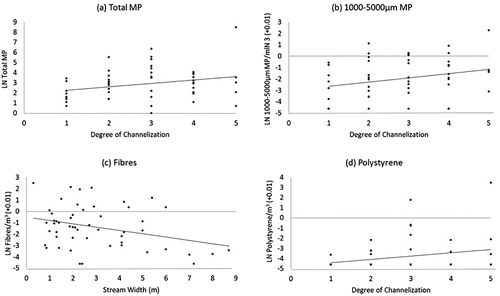
Table 2. Multiple linear regression outputs for microplastic (MP) response variables and the six continuous predictor variables (stream length, urban catchment length, proportion of urbanised catchment, water flow velocity, channelisation and stream width). Beads were too rare to be included in this analysis.
Concentration of large microplastics was positively related to channelisation (R2 = 0.07; b), but only in the backward selection. Concentrations of small or medium-sized microplastics were unrelated to the predictors.
Concentration of microplastic fibres was negatively related to stream width (R2 = 0.10; backward and forward selections; c), while concentration of polystyrene showed a positive relationship with channelisation (R2 = 0.06; backward selection only; d). Concentration of fragments was unrelated to the predictors.
Discussion
Microplastic pollution of urban streams across New Zealand
Microplastics were found in all samples from the 52 urban stream sites surveyed in January 2019, with concentrations varying from 0.03 to 44.8 items/m3. In cases where very low microplastic numbers were found (<5 items total), we cannot be certain that these streams actually contained microplastics due to potential contamination during sampling and laboratory analysis, despite our best efforts to avoid contamination. Nevertheless, we can still state with confidence that the majority of streams sampled did contain microplastics, thus our first hypothesis was supported.
Microplastic concentrations at the majority of sites were below 1 item/m3, which is low compared to the concentrations in some previous studies from running waters in New Zealand (Dikareva and Simon Citation2019) and overseas (Moore et al. Citation2011; Dris et al. Citation2015; Lahens et al. Citation2018). This result suggests that many urban waterways in New Zealand may be relatively lightly polluted with microplastics compared to other countries. However, when the discharges of the sampled streams and the total number of microplastics collected during 15 minutes are taken into account, this level of pollution can still mean that up to 5,000 microplastics items are transported through the system during a 24-hour period at the sampled flow rate. In fact, even the site with the lowest microplastic concentration (0.03 items/m3) would still have over 90 microplastic items passing through the system over 24 hours. Across the ten most polluted sites, microplastic concentrations ranged from 2.1 to 44.8 items/m3. At these sites, the total microplastic flux across 24 hours at the sampled conditions would be between 1500 and 464,000 items. These numbers demonstrate that smaller urban streams can contain and transport considerable amounts of microplastics.
Microplastic concentrations in our study were generally lower than those in the only other published study from New Zealand, Dikareva and Simon (Citation2019), who sampled 21 streams in the Auckland metropolitan area in November 2016 and found that microplastic concentrations ranged from 17 to 303 items/m3. Interestingly, five streams were sampled in both studies, but microplastic concentrations in these streams were much lower in our study (see ), despite the fact that stream flows were equally moderate in both studies. This difference across studies may be mainly due to sampling methodology (Li et al. Citation2018a). Our nets were far larger than those in the earlier study (50 × 30 cm frame versus 8.3 cm diameter), and we exposed up to three nets in larger streams. Consequently, our nets captured a much larger proportion of the entire stream cross-section, including slower-flowing areas such as stream margins, and thus may have provided a more realistic assessment of the average microplastics densities across the entire cross-section (Mendoza and Balcer Citation2019). Further, Dikareva and Simon (Citation2019) used a mesh size of 63 μm whereas we chose 250 μm to avoid clogging of our larger nets during sampling. The 250 μm mesh size is commonly used in microplastics studies around the world, although this comes at the cost of not detecting smaller microplastic items (Shim and Thomposon Citation2015; McCormick et al. Citation2016; Klein et al. Citation2017). Due to using a smaller mesh size, Dikareva and Simon (Citation2019) likely captured more small microplastic items than we did, as illustrated by the higher proportions of items <500 μm in their study (). The combination of different net size, net positioning and mesh size probably explains why our microplastic concentrations were considerably lower than those in Dikareva and Simon (Citation2019).
Table 3. Comparisons of microplastic concentrations/m3 between our stream survey and Dikareva and Simon (Citation2019) across the same five stream sites. All five sites were sampled at moderate flows in both studies.
Alternatively, microplastic concentrations might vary between seasons (November versus January). November (spring in New Zealand) has typically more unsettled weather than January (summer), which could have led to more rain and elevated stream flows, possibly resulting in increased microplastic concentrations – yet this explanation is unlikely because discharges of the sampled streams were equally moderate in both studies. Concentrations in Auckland streams might have also generally declined from 2016 to 2019, but this also seems unlikely given the rapid, ongoing growth of the Auckland metropolitan area. As both alternative explanations are far more speculative than the sampling-method-related explanation, we recommend standardising sampling methods to a greater extent in future microplastics studies in running waters, to improve comparability across studies. This should be done by using standardised net dimensions so water volumes sampled can be more easily compared. A minimum proportion of the entire stream cross-section to be sampled could also be recommended, and a standardised mesh size for sampling.
In a global context, our study helps reduce the general lack of research on microplastic pollution in smaller running-water ecosystems by exploring microplastic concentrations in these systems and potential drivers behind microplastic pollution. The microplastic concentrations observed across our 52 stream sites in New Zealand (0.03–44.8 items/m3) are comparable to many studies of larger urban running waters elsewhere, in agreement with our second hypothesis. These overseas studies include tributaries of the Great Lakes in the U.S.A. (0.05–32/m3), the Seine River in Paris (0.28–47/m3, manta trawl sample of the top 30 cm of water), the Raritan River in New Jersey (7.7–24/m3), and Chicago Metropolitan rivers (1–15/m3) (Dris et al. Citation2015; Baldwin et al. Citation2016; Estahbanati and Fahrenfeld Citation2016; McCormick et al. Citation2016). Wider concentration ranges have been found in some highly urbanised catchments in major metropoles such as the Los Angeles and San Gabriel Rivers in California (<1–153/m3), the Seine and Marne Rivers in Paris (4–188/m3, submerged plankton net sample of the top 10–35 cm of water), and the Saigon River in Vietnam (10–223/m3) (Moore et al. Citation2011; Dris et al. Citation2015; Lahens et al. Citation2018).
Because our reported microplastic concentrations are similar to those from larger rivers in several major urban centers across the world, some New Zealand urban streams may be subject to microplastic pollution severe enough to affect freshwater organisms. In fact, even microplastics at lower concentrations than found in our study can influence microbial communities in freshwater systems (McCormick et al. Citation2016). Further, microplastics at the concentrations we found may be ingested by fish or freshwater invertebrates (particularly by suspension feeders), with potentially negative consequences, although these are still poorly understood (Mattsson et al. Citation2017; Blettler et al. Citation2018; Jabeen et al. Citation2018; Windsor et al. Citation2019). Microplastics can also travel downstream to estuaries where they may settle, with potentially adverse effects on estuarine communities (Zhao et al. Citation2015). Finally, our findings add to the growing evidence that smaller urban waterways have comparable microplastic pollution to larger rivers and that they can be significant transport pathways for microplastics (Wagner et al. Citation2014; Blettler et al. Citation2018; Dikareva and Simon Citation2019).
Lack of regional differences and urban predictor analysis
In contrast with our third hypothesis, we found no significant differences in microplastic concentrations across five of the largest urban agglomerations in the country. This finding suggests that microplastic pollution in New Zealand's urban streams can be regarded as a nationwide issue. We had expected microplastic pollution to worsen as human population size increases (Wang et al. Citation2017; Dai et al. Citation2018), resulting e.g. in Auckland having higher levels of pollution than Dunedin, but this was not the case. Therefore, urban population size may not be as important as a driver of microplastic pollution as previously thought, at least not in New Zealand. This interpretation is further supported by the absence of any significant positive correlations between our microplastic response variables and the proportion of urban catchment or urban stream length, rejecting our fourth hypothesis. This result is not that unusual when put into a global context, because microplastics have also been found in remote lakes and other non-urbanised catchments (e.g. Eerkes-Medrano et al. Citation2015). Such studies show that large human populations are not required for high microplastic densities to occur, even though the former are definitely one of the key contributing factors (Eerkes-Medrano et al. Citation2015).
We detected several correlative relationships in our urban predictor analysis, although all of them were weak (R2 = 0.14 or lower), therefore their biological relevance may be limited (Nakagawa and Cuthill Citation2007). The most consistent pattern was a positive relationship of several microplastic metrics (total microplastic items per site, concentration of large items, concentration of polystyrene) with the degree of channelisation, while concentration of fibres became lower with increasing stream width. Interestingly, neither of the catchment-scale predictors related to urbanisation (urbanised catchment length, urban proportion of the stream) were retained in the regression models, similar to most of the catchment-scale predictors in the earlier study of Auckland streams (Dikareva and Simon Citation2019), despite the larger sample size in our study (52 versus 21 stream sites). This was a consequence of our data being highly variable across stream sites with a similar degree of urbanisation. When combined, the results from both studies suggest that local physical stream characteristics may be more relevant for determining the extent of microplastics pollution in a given stream reach than the conditions in the wider upstream catchment.
Microplastic composition
Because we did not use spectroscopy to identify specific polymers of plastic, our microplastic composition data are based purely on microscope analysis. This method has the potential to misidentify some non-plastic based microfibres as microplastics (Mendoza and Balcer Citation2019). However, most microfibres released into the environment are either wholly plastic, at least partially plastic, or a plastic blend (Wagner et al. Citation2014). Moreover, the chances of misidentification are highest when examining microplastic items <100 μm (Duis and Coors Citation2016), which is smaller than the microplastics captured by our 250-μm nets. Finally, our laboratory analysis contained steps aimed at avoiding microplastic misidentification and also contamination. Therefore, it is unlikely that misidentification or contamination affected our main findings.
Polystyrene was the most common plastic type found, due to an abnormally high quantity of polystyrene being found at one site (Site 16, >3000 items). Despite this, when taking into account all microplastic identification classes, our results are comparable to those from other studies (Lin et al. Citation2018), again supporting our second hypothesis. Fibres were the most common type after polystyrene, which has usually been the case in global studies (Wang et al. Citation2017; Lin et al. Citation2018). This is due to there being many sources of fibres such as clothing and textiles which can come from residential, commercial and industrial areas (Wang et al. Citation2017). Fibres are also more readily transported through the environment as they are small and light so are easily transported by wind and water currents (Wang et al. Citation2017).
Fragments were the next-most common form of microplastics, consistent with the published literature (Duis and Coors Citation2016; Wang et al. Citation2017; Lin et al. Citation2018; Tibbetts et al. Citation2018). Fragments are expected to be found in lower quantities than fibres as there are fewer sources of fragments and they are not as readily transported (Wang et al. Citation2017). Also, they are secondary microplastics derived from disintegration of larger macroplastics so they may not have broken down fully when entering the environment (Wang et al. Citation2017). Supporting this theory, a relatively high number of macroplastics were detected in our study. In the current scientific literature on plastics pollution in aquatic ecosystems, macroplastics are mentioned far less often than microplastics (Blettler et al. Citation2018; Lahens et al. Citation2018). Nevertheless, we agree with Blettler et al. (Citation2018) and Lahens et al. (Citation2018) that macroplastics are also worth reporting on in combination with microplastics as larger plastic items will break down either within streams and rivers or later in marine environments, subsequently creating more microplastic pollution within these environments.
In contrast to overseas studies (Wang et al. Citation2017; Tibbetts et al. Citation2018), our results suggest microbeads do not contribute to the microplastic pollution in New Zealand urban streams, paralleling findings of the earlier study of urban streams in Auckland (Dikareva and Simon Citation2019). This difference from overseas is most likely due to the fact that primary microplastics such as beads and pellets are rarely manufactured in New Zealand and not as widely used (Dikareva and Simon Citation2019). As a result, less primary microplastic pollution is observed in urban streams. Moreover, use of microbeads in personal care products within New Zealand has been phased out due to a Government ban in May 2018, and this may also have contributed to the lack of beads found in our study.
Conclusions and future research directions
Our study represents the first microplastic survey of streams across five of the largest urban agglomerations in New Zealand. The study shows that small urban streams across New Zealand can have substantial microplastic pollution, comparable to levels observed overseas, and that large quantities of microplastics move through these systems. More generally, our findings from smaller streams are also highly comparable to larger urban waterways sampled overseas. This adds to the growing evidence that smaller urban streams are sources for microplastic pollution and represent significant transport mechanisms for microplastics. Future research in New Zealand should determine if microplastic pollution occurs to the same extent in stream sediments and in other urban or non-urban freshwater systems such as larger rivers and lakes (Wagner et al. Citation2014), and if field-realistic microplastic additions in laboratory or mesocosm experiments affect aquatic organisms or stream communities. Further, invertebrate and fish species in microplastic-polluted freshwater systems should be examined to determine if organisms are ingesting microplastics, with potentially harmful consequences (Wagner et al. Citation2014; Blettler et al. Citation2018). Finally, we recommend standardising microplastics sampling methods in running waters to a greater extent in the future.
Supplementary Information
Download MS Word (5.6 MB)Acknowledgements
We thank Samuel Foster and Tim Howarth for their help sampling in the field and Hortense Vandenkoornhuyse, Claire Goetz and Nicky McHugh for their help with laboratory work.
Disclosure statement
No potential conflict of interest was reported by the authors.
Data availability
The datasets generated during the current study are available from the corresponding author on reasonable request.
ORCID
Aidan K. Mora-Teddy http://orcid.org/0000-0002-7158-8564
Related Research Data
References
- Baldwin AK, Corsi SR, Mason SA. 2016. Plastic debris in 29 Great Lakes tributaries: relations to watershed attributes and hydrology. Environmental Science & Technology. 50(19):10377–10385. doi: 10.1021/acs.est.6b02917
- Blettler MCM, Abrial E, Khan FR, Sivri N, Espinola LA. 2018. Freshwater plastic pollution: recognizing research biases and identifying knowledge gaps. Water Research. 143(15):416–424. doi: 10.1016/j.watres.2018.06.015
- Clunies-Ross PJ, Smith GPS, Gordon KC, Gaw S. 2016. Synthetic shorelines in New Zealand? Quantification and characterisation of microplastic pollution on Canterbury’s coastlines. New Zealand Journal of Marine and Freshwater Research. 50(2):317–325. doi: 10.1080/00288330.2015.1132747
- Dai Z, Zhang H, Zhou Q, Tian Y, Chen T, Tu C, Fu C, Luo Y. 2018. Occurrence of microplastics in the water column and sediment in an inland sea affected by intensive anthropogenic activities. Environmental Pollution. 242(B):1557–1565. doi: 10.1016/j.envpol.2018.07.131
- Dikareva N, Simon K. 2019. Microplastic pollution in streams spanning an urbanisation gradient. Environmental Pollution. 250:292–299. doi: 10.1016/j.envpol.2019.03.105
- Dris R, Gasperi J, Mirande C, Mandin C, Guerrouache M, Langlois V, Tassin B. 2017. A first overview of textile fibers, including microplastics, in indoor and outdoor environments. Environmental Pollution. 221:453–458. doi: 10.1016/j.envpol.2016.12.013
- Dris R, Imhof H, Sanchez W, Gasperi J, Galgani F, Tassin B, Laforsch C. 2015. Beyond the ocean: contamination of freshwater ecosystems with (micro-) plastic particles. Environmental Chemistry. 12(5):32.
- Duis K, Coors A. 2016. Microplastics in the aquatic and terrestrial environment: sources (with a specific focus on personal care products), fate and effects. Environmental Sciences Europe. 28(1):2. doi: 10.1186/s12302-015-0069-y
- Eerkes-Medrano D, Thompson RC, Aldridge DC. 2015. Microplastics in freshwater systems: a review of the emerging threats, identification of knowledge gaps and prioritisation of research needs. Water Research. 75:63–82. doi: 10.1016/j.watres.2015.02.012
- Ehlers SM, Manz W, Koop JHE. 2019. Microplastics of different characteristics are incorporated into the larval cases of the freshwater caddisfly Lepidostoma basale. Aquatic Biology. 28:67–77. doi: 10.3354/ab00711
- Estahbanati S, Fahrenfeld NL. 2016. Influence of wastewater treatment plant discharges on microplastic concentrations in surface water. Chemosphere. 162:277–284. doi: 10.1016/j.chemosphere.2016.07.083
- Geyer R, Jambeck JR, Law KL. 2017. Production, use and fate of all plastics ever made. Science Advances. 3(7):e1700782. doi: 10.1126/sciadv.1700782
- Hamid FS, Bhatti MS, Anuar N, Mohan P, Periathamby A. 2018. Worldwide distribution and abundance of microplastic: how dire is the situation? Waste Management Research. 36(10):873–897. doi: 10.1177/0734242X18785730
- Harrison JP, Hoellein TJ, Sapp M, Tagg AS, Ju-Nam Y, Ojeda JJ. 2018. Microplastic-associated biofilms: a comparison of freshwater and marine environments. In: Wagner M, Lambert S, editors. Freshwater microplastics. Vol 58, The handbook of environmental chemistry. Cham: Springer; p. 181–202.
- Horton AA, Walton A, Spurgeon DJ, Lahive E, Svendsen C. 2017. Microplastics in freshwater and terrestrial environments: evaluating the current understanding to identify the knowledge gaps and future research priorities. Science of the Total Environment. 586:127–141. doi: 10.1016/j.scitotenv.2017.01.190
- Jabeen K, Li B, Chen Q, Su L, Wu C, Hollert H, Shi H. 2018. Effects of virgin microplastics on goldfish (Carassius auratus). Chemosphere. 213:323–332. doi: 10.1016/j.chemosphere.2018.09.031
- Jiang J. 2018. Occurrence of microplastics and its pollution in the environment: a review. Sustainable Production and Consumption. 13:16–23. doi: 10.1016/j.spc.2017.11.003
- Karthik R, Robin RS, Purvaja R, Ganguly D, Anandavelu I, Raghuraman R, Hariharan G, Ramakrishna A, Ramesh R. 2018. Microplastics along the beaches of southeast coast of India. Science of the Total Environment. 645:1388–1399. doi: 10.1016/j.scitotenv.2018.07.242
- Khan FR, Mayoma BS, Biginagwa FJ, Syberg K. 2017. Microplastics in Inland African waters: presence, sources, and fate. Freshwater microplastics. In: Wagner M, Lambert S, editors. Freshwater microplastics. Vol 58, The handbook of environmental chemistry. Cham: Springer; p. 101–124.
- Klein S, Dimzon IK, Eubeler J, Knepper TP. 2017. Analysis, occurrence, and degradation of microplastics in the aqueous environment. Freshwater microplastics. In: Wagner M, Lambert S, editors. Freshwater microplastics. Vol 58, The handbook of environmental chemistry. Cham: Springer; p. 51–68.
- Lahens L, Strady E, Kieu-Lu TC, Dris R, Boukerma K, Rinnert E, Gasperi J, Tassin B. 2018. Macroplastic and microplastic contamination assessment of a tropical river (Saigon River, Vietnam) transversed by a developing megacity. Environmental Pollution. 236:661–667. doi: 10.1016/j.envpol.2018.02.005
- Lambert S, Wagner M. 2017. Microplastics are contaminants of emerging concern in freshwater environments: an overview. In: Wagner M, Lambert S, editors. Freshwater microplastics. Vol 58, The handbook of environmental chemistry. Cham: Springer; p. 1–24.
- Li X, Chen L, Mei Q, Dong B, Dai X, Ding G, Zeng EY. 2018b. Microplastics in sewage sludge from the wastewater treatment plants in China. Water Research. 142:75–85. doi: 10.1016/j.watres.2018.05.034
- Li J, Liu H, Chen JP. 2018a. Microplastics in freshwater systems: a review on occurrence, environmental effects, and methods for microplastics detection. Water Research. 137:362–374. doi: 10.1016/j.watres.2017.12.056
- Lin L, Zuo L, Peng J, Cai L, Fok L, Yan Y, Li H, Xu X. 2018. Occurrence and distribution of microplastics in an urban river: a case study in the Pearl River along Guangzhou City, China. Science of the Total Environment. 644:375–381. doi: 10.1016/j.scitotenv.2018.06.327
- Mani T, Hauk A, Walter U, Burkhardt-Holm P. 2015. Microplastics profile along the Rhine River. Scientific Reports. 5:17988. doi: 10.1038/srep17988
- Mattsson K, Johnson EV, Malmendal A, Linse S, Hansson L, Cedervall T. 2017. Brain damage and behavioural disorders in fish induced by plastic nanoparticles delivered through the food chain. Scientific Reports. 7:11452. doi: 10.1038/s41598-017-10813-0
- McCormick AR, Hoellein TJ, London MG, Hittie J, Scott JW, Kelly JJ. 2016. Microplastic in surface waters of urban rivers: concentration, sources, and associated bacterial assemblages. Ecosphere. 7(11):e01556. doi: 10.1002/ecs2.1556
- Mendoza LM, Balcer M. 2019. Microplastics in freshwater environments: a review of quantification assessment. Trends in Analytical Chemistry. 113:402–408. doi: 10.1016/j.trac.2018.10.020
- Moore CJ, Lattin GL, Zellers AF. 2011. Quantity and type of plastic debris flowing from two urban rivers to coastal waters and beaches of Southern California. Journal of Integrated Coastal Zone Management. 11(1):65–73.
- Nakagawa S, Cuthill IC. 2007. Effect size, confidence interval and statistical significance: a practical guide for biologists. Biological Reviews. 82:591–605. doi: 10.1111/j.1469-185X.2007.00027.x
- Perez-Venegas DJ, Seguel M, Paves H, Pulgar J, Urbina M, Ahrendt C, Galban Malagon C. 2018. First detection of plastic microfibers in a wild population of South American fur seals (Arctocephalus australis) in the Chilean Northern Patagonia. Marine Pollution Bulletin. 136:50–54. doi: 10.1016/j.marpolbul.2018.08.065
- Plastics-The Facts 2016-An analysis of European plastics production, demand and paste data. 2016. p. 12. http://www.plasticseurope.org/Document/plastics---the-facts-2016-15787.aspx?Page=DOCUMENT&FolID=2
- Provencher JF, Vermaire JC, Avery-Gomm S, Braune BM, Mallory ML. 2018. Garbage in guano? Microplastic debris found in faecal precursors of seabirds known to ingest plastics. Science of the Total Environment. 644(15):1477–1484. doi: 10.1016/j.scitotenv.2018.07.101
- Rist S, Hartmann NB. 2017. Aquatic ecotoxicity of microplastics and nanoplastics: lessons learned from engineered nanomaterials. In: Wagner M, Lambert S, editors. Freshwater microplastics. Vol 58, The handbook of environmental chemistry. Cham: Springer; p. 25–50.
- Shim WJ, Thomposon RC. 2015. Microplastics in the ocean. Archives of Environmental Contamination and Toxicology. 69(3):265–268. doi: 10.1007/s00244-015-0216-x
- Tibbetts J, Krause S, Lynch I, Smith GS. 2018. Abundance, distribution, and drivers of microplastic contamination in urban river environments. Water. 10(11):1597. doi: 10.3390/w10111597
- van der Bijl W, Thyselius M, Kotrschal A, Kolm N. 2015. Brain size affects the behavioural response to predators in female guppies (Poecilia reticulata). Proceedings of the Royal Society B: Biological Sciences. 282(1812):1132. doi: 10.1098/rspb.2015.1132
- Wagner M, Scherer C, Alvarez-Munoz D, Brennholt N, Bourrain X, Buchinger S, Fries E, Grosbois C, Klasmeier J, Marti T, et al. 2014. Microplastics in freshwater ecosystems: what we know and what we need to know. Environmental Sciences Europe. 26:12–16. doi: 10.1186/s12302-014-0012-7
- Wang W, Ndungu AW, Li Z, Wang J. 2017. Microplastics pollution in inland freshwaters of China: a case study in urban surface waters of Wuhan, China. Science of the Total Environment. 575:1369–1374. doi: 10.1016/j.scitotenv.2016.09.213
- Windsor FM, Tilley RM, Tyler CR, Ormerod SJ. 2019. Microplastic ingestion by riverine macroinvertebrates. Science of the Total Environment. 646:68–74. doi: 10.1016/j.scitotenv.2018.07.271
- Zhao J, Ran W, Teng J, Liu Y, Liu H, Yin H, Cao R, Wang Q. 2018. Microplastic pollution in sediments from the Bohai Sea and the Yellow Sea, China. Science of the Total Environment. 640-641:637–645. doi: 10.1016/j.scitotenv.2018.05.346
- Zhao S, Zhu L, Li D. 2015. Microplastic in three urban estuaries, China. Environmental Pollution. 206(1):597–604. doi: 10.1016/j.envpol.2015.08.027