
ABSTRACT
Determining the genetic structure and population dynamics of harvested species are key aspects of effective fisheries management. New Zealand scampi (Metanephrops challengeri) is a species of nethropid lobster that supports a commercial fishery on the continental shelf and slope around New Zealand. To determine the genetic structure and historical population demography of New Zealand scampi, we sequenced a 623 base-pair fragment of the mitochondrial gene cytochrome c oxidase subunit one (CO1) from 321 individuals across six widely separated sites off the coast of mainland New Zealand and the subantarctic Auckland Islands, representing much of the species’ distribution. The Auckland Islands population was found to be genetically distinct from all other sampled populations, potentially resulting from an absence of continuous suitable habitat between the central-eastern South Island and the Auckland Islands. An isolation-by-distance pattern of genetic structure was also detected. With the exception of the Mercury Islands, all sampled populations showed signs of recent population expansion, potentially linked to changes in habitat availability during the glacial-interglacial cycles of the Pleistocene. We recommend that the current NZ scampi management areas and harvesting rates for each remain unchanged.
Introduction
Identification of fisheries stock units is an essential aspect of effective fisheries management. The overall goal of fisheries management is to balance harvest-induced mortality with natural recruitment and immigration to maintain a self-sustaining population (Reiss et al. Citation2009). Small populations, or those that have undergone a bottleneck, face increased risk of extirpation and can hold a lower level of genetic diversity, reducing the adaptive potential of the population. The effect of genetic drift increases with decreasing population size, which reduces genetic diversity, and, in some cases, causes deleterious alleles to increase in frequency (Laikre et al. Citation2005). Dispersal and interbreeding between populations can influence genetic connectivity and demographic stability (Lowe and Allendorf Citation2010; Faurby and Barber Citation2012). The delineation of stock boundaries within the marine environment can be difficult. Patterns of population connectivity in deep-sea species remain poorly understood (Hilário et al. Citation2015; Baco et al. Citation2016), and the majority of marine phylogeographic studies to date primarily consider coastal species due to the difficulty and cost of effectively sampling the deep-sea (Bors et al. Citation2012). Deep-sea species generally have higher levels of population connectivity compared to shallow-water species (Baco et al. Citation2016), due, in part, to the relatively few barriers to dispersal in the deep-sea environment (Baco et al. Citation2016).
For many marine invertebrates, dispersal primarily occurs during their pelagic larval phase (Cowen and Sponaugle Citation2009), the duration of which (pelagic larval duration; PLD) is often used as a proxy for dispersal potential (Marko and Hart Citation2017). Direct study of larval dispersal is challenging because of the vast areas and large numbers of minute larvae involved (Levin Citation2006; Cowen and Sponaugle Citation2009). Moreover, larvae may not persist for long periods in the pelagic environment. This has meant that indirect methods (e.g. analyses of genetic structure) are frequently used to estimate the extent of larval dispersal. Complex oceanographic conditions and variation in larval behaviour can also influence the distance and success rate of dispersal. Ocean currents can enable dispersal far away from natal areas (Cowen et al. Citation2000), or, if larvae become trapped within local eddies, promote self-recruitment (Lobel and Robinson Citation1986). Halo- and thermo-clines can also restrict movement of marine organisms or form semi-permeable barriers (e.g. Jørgensen et al. Citation2005; Thornhill et al. Citation2008). Variation in the distributions and connectivity patterns among and within species is due to differing habitat requirements and availability, physiological tolerances to a range of abiotic factors, life-history strategies, and chance events (Ross et al. Citation2009). With so many biotic and abiotic factors involved, it is often misleading to apply generalisations about population connectivity from one species to another (e.g. Goldstien et al. Citation2006; Fleming et al. Citation2018). Therefore, patterns of population connectivity need to be assessed separately for each species (Wennerström et al. Citation2013).
New Zealand scampi (Metanephrops challengeri; NZ scampi hereafter) are targeted by a commercial trawl-based fishery, with the primary fishery areas comprising the region east of Great Barrier Island to the western Bay of Plenty in the northern North Island, east of the Wairarapa in the southern North Island, the Chatham Rise east of mainland New Zealand, and off the Auckland Islands, 450 km south of the mainland (Ministry for Primary Industries Citation2016). The fishery is currently managed as eleven separate stocks within the New Zealand Exclusive Economic Zone (EEZ) under New Zealand's quota management system. NZ scampi are endemic to New Zealand and inhabit soft benthic substrates on the continental shelf and slope at depths of 140–670 m (Yaldwyn and Webber Citation2011), in highest abundance between 200 and 500 m (Smith Citation1999). NZ scampi have a bipartite life cycle comprising a short pelagic larval stage of 3–5 days (Wear Citation1976) before benthic settlement. A mark-recapture study of adult individuals supported the current stock structure model by suggesting that adults do not traverse large distances, possibly moving as little as 500 m post settlement (Cryer and Stotter Citation1999). The short pelagic phase and limited movement of adults suggest that NZ scampi have low dispersal ability and predicted low levels of gene flow amongst geographically separated populations. However, there has been limited research into the genetic structure of NZ scampi populations, which would enable the efficacy of the current proposed stock structure to be tested.
Low-resolution allozyme data reported that the Auckland Islands population was genetically distinct from all other regions on the eastern mainland, with significant differences in allele frequencies at three of five polymorphic loci, and that there was significant genetic differentiation between the Bay of Plenty and the Chatham Rise populations (Smith Citation1999). However, this genetic differentiation was weaker, with only one polymorphic loci exhibiting significantly different allele frequencies between the latter populations (Smith Citation1999). The aim of the present study was to use DNA sequences from the faster evolving mitochondrial gene cytochrome c oxidase subunit 1 (CO1) to test for phylogeographic structure, and describe genetic diversity and past demography among and within NZ scampi populations. These data could then inform management of the NZ scampi fishery.
Methods
Sample collection
Samples () were collected via trawling in Bay of Plenty, south of Cape Kidnappers and off Wairarapa during a National Institute of Water and Atmospheric Research (NIWA) NZ scampi survey (KAH1501). Samples collected from off the Auckland Islands were taken during a separate survey (KAH1603), and Chatham Rise samples were sourced from commercial fishing vessels (see for a map of sampling localities). Trawls were conducted between 300 and 500 m water depth. A section of muscle tissue was excised from the tail and stored at 4°C in 80% ethanol.
Figure 1. Map of New Zealand indicating sampling locations and areas of interest. AI: Auckland Islands; CR: Chatham Rise; CP: Castlepoint; CK: Cape Kidnappers; WI: White Island; MI: Mercury Islands. Latitude, longitude, 200 m isobath, and 1000 m isobath shown.
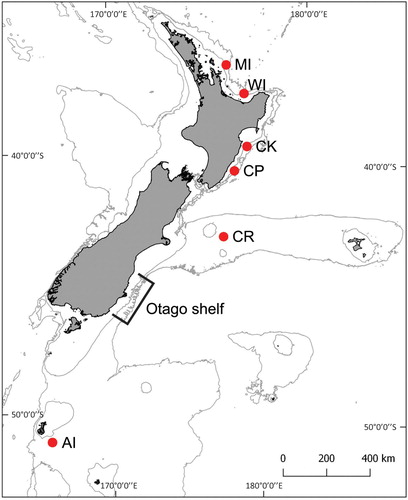
Table 1. Sampling information, summary statistics, estimates of genetic diversity, and neutrality test statistics for 321 partial NZ scampi CO1 sequences. For neutrality test values (Tajima's D and Fu's F-statistic), bold values indicate statistical significance. Key: n: Sample Size, S: Segregating Sites, TS: Transitions, TV: Transversions, HN: Number of Haplotypes, HP: Number of Private Haplotypes, HD: Haplotype Diversity, π: Nucleotide Diversity (standard deviation), k: Average Number of Nucleotide Substitutions.
DNA extraction, polymerase chain reaction, and DNA sequencing
DNA was extracted using a standard phenol–chloroform method (Sambrook et al. Citation1989), quantified using a Nanodrop ND1000 spectrophotometer (Thermo Fisher Scientific), and diluted to 50 ng/µL in Tris-EDTA buffer (10 mM Tris-HCl pH 8.0, 1 mM EDTA). A 710 base-pair (bp) fragment of CO1 was amplified using the polymerase chain reaction (PCR) with the universal invertebrate primer pair LCO1490 (5′-GGTCAACAAATCATAAAGATATTGG-3′)/HCO2198 (5′-TAAACTTCAGGGTGACCAAAAAATCA-3′) (Folmer et al. Citation1994). Each PCR (25 µL) contained 1 µl of DNA, 1x Bioline PCR Buffer (67 mM Tris-HCl, 16 mM (NH4)2SO4), 3 mM MgCl2, 0.06 mM Bovine Serum Albumin, 0.1 µM each of forward and reverse primer, 0.4 mM dNTPs, and 1 unit of Biotaq DNA Polymerase (Bioline Reagents Ltd). Thermocycling was carried out on a Biometra TProfessional Thermocycler (Göttingen, Germany) using the following parameters: 95°C 3 min, 40 cycles of 95°C 35 s, 50°C 35 s, and 72°C 45 s, with a final extension of 72°C 10 min. PCRs were visualised on a 2% agarose gel stained with ethidium bromide and exposed to UV light. Successful reactions were then purified using ExoSAP-IT (Amersham Parmacia Biotech) following the manufacturer's instructions. DNA sequencing was conducted by the Macrogen Sequencing Service (Macrogen Inc. Seoul, South Korea) using a 3730xl Genetic Analyzer (Applied Biosystems). DNA sequences were checked by eye, edited where appropriate, trimmed to 623 bp and aligned with Geneious (Version 8.0.5) (Kearse et al. Citation2012) using default parameters.
Genetic diversity and population structure
Summary statistics and estimates of genetic diversity were calculated using DnaSP (Version 5.10) (Librado and Rozas Citation2009) and Arlequin (Version 3.5.2.2) (Excoffier and Lischer Citation2010). Summary statistics included the number of segregating sites (S), frequency of transitions (Ts) and transversions (Tv), nucleotide diversity (π), haplotype diversity (HD), and the average number of nucleotide differences between sequences (k). Population structure was assessed using Bayesian Analysis of Population Structure (BAPS) (Version 6.0), with the implementation of the linked loci clustering model (Corander and Tang Citation2007) and multiple upper bounds to the number of clusters (k). K values were set from 2 to 10 with each tested 5 times to determine the most likely number of clusters. PopART (Leigh and Bryant Citation2015) was used to generate a median joining haplotype network (Bandelt et al. Citation1999), to enable haplotype frequencies and relationships to be visualised.
Pairwise ɸST values and AMOVAs (Analysis of Molecular Variance) were calculated within Arlequin using haplotype frequencies. Each analysis was bootstrapped with 10,000 permutations and a Bonferroni correction applied to pairwise ɸST estimates to reduce the chance of type one errors (false positives). AMOVAs were used to test support for different scenarios of population genetic structure through the a priori assignment of DNA sequences from different populations into groups. Three scenarios of population structure were constructed and tested using an AMOVA: (1) DNA sequences from different populations were placed into two groups, one consisting of the Auckland Islands, the other comprising all other populations. This grouping was chosen based upon the results of the BAPS analysis and haplotype network; (2) Populations were placed into three groups, one comprising the four North Island sites, the second group comprising only the Chatham Rise and the third, the Auckland Islands; (3) Populations were placed into two groups, one comprising all sites north of 42°S, the other comprising the Chatham Rise and Auckland Islands. This is based on previously published reports of genetic disjunctions in marine invertebrates around this latitude (e.g. Waters and Roy Citation2004; Ayers and Waters Citation2005; Goldstien et al. Citation2006; Veale and Lavery Citation2011).
The Isolation-By-Distance Web Service (http://ibdws.sdsu.edu/~ibdws/) (Jensen et al. Citation2005) was used to test for a correlation between genetic differentiation and geographic distance (Isolation-by-Distance). A Mantel's test with 1,000 randomisations was used on the regression analysis to assess significance. Minimum over-water distances (km) between sampling locations were estimated using Google Earth (version 7.1). Genetic distances were transformed using Slatkin's linearised genetic differentiation formula [ɸST / (1−ɸST)] (Slatkin Citation1995), following Rousset (Citation1997), who suggested using Slatkin's linearised distance and geographic distance for one-dimensional habitats. A one-dimensional habitat was defined as habitat where the distance between sampled populations is greater than the length of the habitat (Rousset Citation1997). Habitat within this study was defined as one-dimensional due to the large latitudinal range sampled. A final regression analysis was conducted that excluded the Auckland Islands to check if the relatively high geographic- and genetic distances between the Auckland Islands and other locations strongly influenced the previous analyses.
Demographic history
Multiple approaches were used to examine the demographic history of NZ scampi. These include calculation of Tajima's D (Tajima Citation1989), and Fu's F statistics (Fu Citation1997), mismatch distributions of pairwise DNA sequence divergence, and Bayesian skyline plots (Drummond et al. Citation2005). Tajima's D and Fu's F-statistics were calculated in Arlequin and bootstrapped with 10,000 permutations. Tajima's D was deemed to be statistically significant at p-values of <0.05, and Fu's F-statistic was deemed statistically significant at p-values of <0.02 (Fu Citation1997). Mismatch distributions (Rogers and Harpending Citation1992) were calculated for each separate population using DnaSP. Bayesian skyline plots were constructed in BEAST v1.8.2 (Drummond et al. Citation2012). Initially, two separate analyses were run; one containing the Auckland Islands sequence data, and another containing all other DNA sequences, to meet the Bayesian skyline plot assumption of panmixia. However, preliminary results suggested that the DNA sequence data of the Auckland Islands population alone did not contain enough power to reject the assumption of constant population size through time (data not shown), therefore, further Bayesian skyline plot analysis of the Auckland Islands population was not attempted. For the remaining DNA sequences (those obtained from populations along the eastern coast of the North Island and the Chatham Rise) multiple analyses were run using a strict clock model with the following mutation rates: 1 × 10⁻⁸, 7 × 10⁻⁹, and 1.3 × 10⁻⁸ substitutions/site/year. These mutation rates correspond to an intermediate estimate of decapod CO1 mutation rate (Zacarias Citation2013), alongside a rates reported for snapping shrimp within the genus Alpheus (Knowlton and Weigt Citation1998), and Jamaican land crabs (Schubart et al. Citation1998), respectively. The TN93+I+G model of nucleotide substitution was used as it was identified as the most appropriate model using the AIC criterion in jModelTest v2.1.1 (Darriba et al. Citation2012). A total of 506 iterations were analysed and the first 10% discarded as burn-in. The resulting trace file was viewed in Tracer v1.7 (Rambaut et al. Citation2018), and the effective sample sizes of priors and posterior probabilities were confirmed to be greater than 200.
Results
Genetic diversity and population structure
The final sequence alignment comprised 321 sequences with a total of 107 haplotypes. There were 79 variable sites, of which, 39 were parsimony informative and 40 were singletons. All populations contained private haplotypes, with the highest number of private haplotypes being detected from the Auckland Islands and Castlepoint sampling sites (HP = 21 for both sites). All populations had low levels of nucleotide diversity (π = 0.00345–0.00724) (), and high levels of haplotype diversity (HD = 0.839–0.922). The Mercury Islands site had the highest level of nucleotide diversity and highest average number of nucleotide substitutions (π = 0.00724, k = 4.479). The Auckland Islands samples featured almost exclusively private haplotypes (HN = 22, HP = 21), and contained lower levels of nucleotide diversity (π = 0.00345) and a lower number of nucleotide substitutions (k = 2.136) than the other sample sites ().
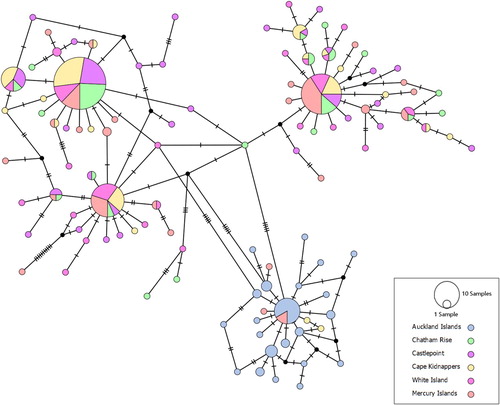
BAPS analysis indicated that there were five genetic clusters among the six sampled populations. Samples from the Auckland Islands formed one group, with a few samples from Cape Kidnappers (eastern North Island) and White Island (northern North Island) clustering with them (). The remaining samples from the populations other than the Auckland Islands were intermixed among the other four clusters. The median joining haplotype network also recovered the same population structure as BAPS from the dataset. The haplotype network () exhibited four expanded starburst-like haplogroups, indicative of recent demographic expansion. All samples from the Auckland Islands belonged to a single haplogroup, along with some samples from Cape Kidnappers and Mercury Islands (), separated by at least five substitutions from the other major haplogroups.
Figure 2. Bayesian analysis of population structure with k = 5. A total of 321 samples are represented. Colours represent different genetic clusters defined by BAPS. MI = Mercury Islands; WI: White Island; CK: Cape Kidnappers; CP: Castlepoint; CR: Chatham Rise; AI: Auckland Islands.
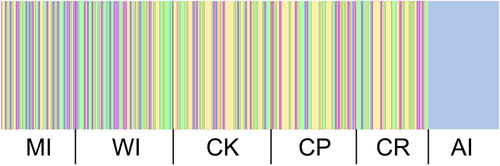
Figure 3. Median-joining haplotype network of 321 partial NZ scampi CO1 sequences. Each hatch mark represents one mutational step, while small black circles represent hypothetical unsampled haplotypes.
AMOVA analyses failed to detect a statistically significant difference among groups (ɸCT) in all tested scenarios (p = 0.13129–0.32337) (). However, statistically significant differences were detected among all populations (ɸST) (p < 0.001) and within predefined groups (ɸSC) (p < 0.001) for all sample groupings. Most genetic variation within the dataset could be explained by the variance among populations (88.18%–94.67%), with small amounts explained by the differences within and among groups. Pairwise ɸST values show statistically significant genetic differentiation between samples from the Auckland Islands and all other populations (). Small, yet statistically significant pairwise ɸST values were also obtained when comparing sampling localities within Bay of Plenty (Mercury Islands and White Island) to those along the eastern coast of the North Island, and the Chatham Rise (). Of these, only the comparisons between the Mercury Islands and Cape Kidnappers, and the Mercury Islands and Chatham Rise remained statistically significant after Bonferroni correction.
Table 2. Analysis of Molecular Variance (AMOVA) analyses of M. challengeri using 321 CO1 sequences with 3 a priori geographic groupings. (1) AI, MI-CR: Group 1: Auckland Islands, Group 2: Chatham Rise, Castlepoint, Cape Kidnappers, White Island, Mercury Islands. (2) AI, CR, MI-CP: Group 1: Auckland Islands, Group 2: Chatham Rise, Group 3: Castlepoint, Cape Kidnappers, White Island, Mercury Islands. (3) AI+CR, MI-CP: Group 1: Auckland Islands, Chatham Rise, Group 2: Castlepoint, Cape Kidnappers, White Island, Mercury Islands. d.f. = degrees of freedom, Var = variance component, %Var = variance component in percentage of total variation.
Table 3. Pairwise ɸST values determined by CO1 haplotype frequencies. Pairwise ɸST values were determined using 321 CO1 sequences and the haplotype frequencies between sampling localities. These are situated below the diagonal while the p-value associated with each comparison is located above the diagonal. Bold values indicate statistical significance after Bonferroni correction.
Mantel tests using Slatkin's linearised distance and geographic distance show a strong positive correlation between genetic and geographic distance (Figure S1) (R = 0.81–0.87). Interestingly, this statistically significant correlation increased slightly upon the removal of the Auckland Islands samples from the dataset (Figure S1B) (R = 0.8724; p = 0.01). In contrast, when the entire dataset was considered, a slightly weaker, non-statistically significant correlation was detected (R = 0.81, p = 0.052, Figure S1A). Large correlation coefficients indicate that geographic distance may explain approximately 80% of the variation in genetic distance between populations.
Demographic history
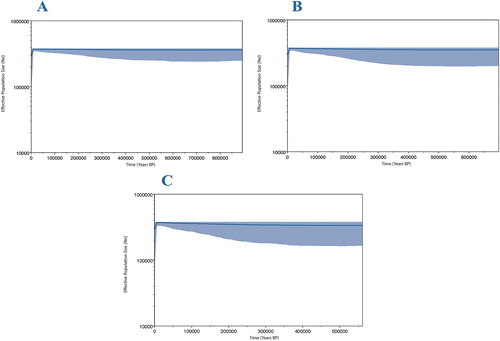
All neutrality tests returned negative values, though not all of these were statistically significant (). Fu's F-statistic was statistically significant for each population when analysed separately, and when all populations were combined. Tajima's D was statistically significant when considering all populations and when the Mercury Islands, White Island, and Auckland Islands were considered separately. A negative value from such neutrality tests can be due to an increase in population size or a bout of purifying selection (Tajima Citation1989). Mismatch distributions were consistent with the results returned by the neutrality tests and suggest that NZ scampi may have recently undergone a population expansion as some populations displayed genetic signatures of this event (Figure S2). Histograms for the Wairarapa, Cape Kidnappers, White Island and Mercury Islands sites, of the number of pairwise differences between sites, had a multimodal distribution. Conversely, histograms for the Auckland Islands and Chatham Rise sites had a unimodal distribution, consistent with recent population expansion. The Bayesian skyline plots estimated a stable effective population size over the past 500,000 years for all sampled populations from mainland New Zealand and the Chatham Rise ().
Figure 4. Bayesian skyline plots with differing mutation rates reconstructing changes in NZ scampi effective population size through time. A: 7 × 10⁻⁹ substitutions/site/year. B: 1 × 10⁻⁸ substitutions/site/year. C: 1.3 × 10⁻⁸ substitutions/site/year. The blue-shaded areas represent 95% confidence intervals.
Discussion
Statistically significant levels of genetic differentiation were found between NZ scampi from the Auckland Islands compared to those from the Chatham Rise and eastern North Island combined. NZ scampi from these latter regions also exhibited small but significant levels of genetic differentiation. Similar results were reported by Smith (Citation1999) based on allozyme data. The level of genetic structure between the Auckland Islands population and populations associated with mainland New Zealand is greater than reported levels of mitochondrial genetic structure between populations of European scampi (Nephrops norvegicus; Stamatis et al. Citation2004), similar to the genetic structure between populations of red spiny lobster (Panulirus interruptus; Perez-Enriquez et al. Citation2001), and significantly less than the genetic structure reported between populations of European spiny lobster (Palinurus elephas; Palero et al. Citation2008). The precise location of the genetic break between the Auckland Islands and eastern New Zealand reported here remains to be established due to the large distances between sample sites. In the vicinity of 45°S on the east coast of the South Island (along the Otago Shelf, ), there appears to be little co-occurrence of suitable habitat and bathymetry; potentially representing an impediment to gene flow. Our analyses suggest that NZ scampi populations have undergone a population expansion, although we cannot discern the specific timing of this event. This expansion may have been caused by the glacial-interglacial cycles of the Pleistocene, which similarly impacted lobster populations worldwide (see below).
Population structure
NZ scampi have a wide yet patchy distribution encompassing much of the continental shelf and slope off New Zealand (Smith Citation1999). Very few voucher specimens are held at the Museum of New Zealand Te Papa Tongarewa (R. Webber, pers. comm. 2017) or National Institute of Water Atmospheric Research (S. Mills, pers. comm. 2017). No voucher specimens are known from the east coast of the South Island between Timaru and Nugget Point, or east of Stewart Island, and neither are there records of commercial trawls targeting NZ scampi within these regions (Tuck Citation2014: ). There are no known records of NZ scampi off Otago Peninsula despite extensive trawling there (K. Probert, pers. comm. 2017). Off the eastern South Island, the continental shelf is relatively shallow, with only a few areas close to the upper bathymetric limit for NZ scampi (Mackay et al. Citation2015), and the continental slope drops off rapidly into unfavourable depths (Carter and Carter Citation1988). Land-derived gravels and sands make up much of the sediments within this area (Carter Citation1985), which may be unsuitable for burrow formation by NZ scampi. Suitable habitat for Metanephrops species is often correlated with sediment type and grain size (Wallner and Phillips Citation1990). The Otago region would have changed significantly during the Last Glacial Maximum, when eustatic sea levels were 120–130 m lower (Fleming et al. Citation1998) than at present. However, there would still have been little soft-sediment habitat within the bathymetric range of NZ scampi in this region during glacial maxima. Furthermore, the Clutha River on the east coast of the South Island has a strong influence on local ocean conditions such as temperature, salinity, and sediment load (Carter and Carter Citation1986; Hawke Citation1989), and the continental shelf and slope off Otago Peninsula is subject to density flows (Hawke Citation1989); either of which might present an impassable barrier to dispersing NZ scampi larvae or result in unfavourable habitat for adults.
Additionally, NZ scampi are not known to inhabit the waters off- or within- Fiordland (Brewin et al. Citation2008), possibly reflecting the unique hydrology of the region (Brewin et al. Citation2011). It seems probable that NZ scampi are either absent or in low abundance between 44°S and 46°20′S, and 45°30′S and 47°30′S, on the west and east coasts respectively of the South Island. Distribution disjunction could explain the marked genetic structure between the Auckland Islands and the other sampled populations. Additional sampling (e.g. the Challenger Plateau, west of Stewart Island, and the Antipodes Islands) could improve understanding of how and why NZ scampi populations are genetically structured.
Mantel tests showed a strong signal for genetic isolation by distance, although this relationship was not always statistically significant (Figure S1). The Auckland Islands are separated from the Chatham Rise by c. 1100 km, and there is significant genetic differentiation between NZ scampi populations in these areas. However, over a similar distance between the Chatham Rise and Mercury Islands, there was significantly less genetic structuring. While hypothesised phylogeographic barriers effectively isolate the Auckland Islands population, the near continuous population along the eastern coast of the North Island and the Chatham Rise may promote gene flow between neighbouring areas. Simulated larval dispersal models examining the subantarctic islands of New Zealand (including the Auckland Islands) demonstrate that larvae with a short PLD can only travel a short distance from their spawning site (Chiswell Citation2009), potentially limiting dispersal and gene flow between geographically separated areas.
Ocean currents are likely to impact the genetic and demographic connectivity of NZ scampi populations because their pelagic larvae are passive dispersers. However, the behaviour and positioning of larvae in the water-column are as yet poorly known, as is the effect and directionality of deeper currents in the bathymetric range of settled individuals. The main current systems that could influence the dispersal of individuals between NZ scampi populations examined in this study are the Tasman Front, which influences western New Zealand, especially in northern regions, and the Subtropical Front (STF), which extends to 500 m below sea level along the Otago shelf (Shaw et al. Citation1999), and passes to the south of the South Island before running eastwards along the Chatham Rise (see Chiswell et al. Citation2015). The STF has been proposed as a potential dispersal barrier to NZ scampi (Smith Citation1999), as populations on either side of the STF are genetically distinct (Smith Citation1999; this study). However, as above, the locality of the genetic disjunction cannot be precisely discerned due to the large geographic distance separating genetically distinct sampling sites. We observe no evidence for a north–south phylogeographic break around Cook Strait (Tables 2 & 3), as noted in studies of other marine invertebrates (e.g. Waters and Roy Citation2004; Ayers and Waters Citation2005; Veale and Lavery Citation2011). Many of the species exhibiting phylogeographic breaks in this area are coastal taxa, while the location of these breaks are often poorly defined and vary from species to species (Ross et al. Citation2009; Walton et al. Citation2019). Deep-sea species (i.e. NZ scampi) may be unconstrained by the biotic and abiotic factors that impact the connectivity of coastal species within this region.
Statistically significant genetic structure was detected amongst NZ scampi populations from the Bay of Plenty (Mercury Islands), the eastern coast of the North Island (Cape Kidnappers), and the Chatham Rise (). The East Auckland Current flows south along the north eastern coast of New Zealand, reaching the East Cape before much of this water is transported offshore. Offshore transport of water may influence the connectivity between populations of pelagic dispersers north and south of the East Cape by transporting pelagic larvae offshore and into waters that are unsuitable for larval settlement due to their depth, with populations of coastal marine invertebrates either side of the East Cape recorded as genetically distinct (Stevens and Hogg Citation2004; Veale and Lavery Citation2012). The current systems within these areas are further complicated by the presence of the East Cape and Wairarapa eddies, which have the potential to retain small drifting objects for up to 3 years (Chiswell and Roemmich Citation1998). These systems have been cited as a driver of self-recruitment in populations of Crustacea with an extremely long PLD (Chiswell and Booth Citation1999), but for species with a short PLD, such as NZ scampi, retention within these eddies will be more significant as mature larvae will be unable to reach habitat suitable for settlement (Ross et al. Citation2009). Populations of NZ scampi north and south of the East Cape are genetically connected, but genetic connectivity between populations does not imply that they are also demographically connected (Ovenden Citation2013). The East Cape could constitute a semi-permeable barrier for NZ scampi with successful dispersal occurring around it at low frequencies, leading to low levels of structure between populations either side of the East Cape.
Evolutionary insights determined via the sole analysis of mitochondrial DNA are limited by its maternal inheritance and lack of recombination. While our mitochondrial DNA results are supported by nuclear allozyme data (see Smith Citation1999), genomic analyses such as genotyping-by-sequencing (Elshire et al. Citation2011) may be able to detect additional genetic structure amongst NZ scampi populations, and further elucidate the recent evolutionary history of NZ scampi.
Demographic history
NZ scampi exhibit high levels of mitochondrial haplotype diversity. A total of 107 different CO1 haplotypes were identified from just 321 samples, which contained low levels of nucleotide diversity overall. These values are comparable to those exhibited by the CO1 region of M. mozambicus (Zacarias Citation2013), and slightly lower than observed levels in the deep-sea squat lobster Munida gracilis (Bors et al. Citation2012); the latter are syntopic with NZ scampi in parts of their respective distributions. High levels of haplotype diversity paired with low levels of nucleotide diversity suggests a demographic history of population size contraction before a recent expansion (Grant and Bowen Citation1998). Populations of triplefin fishes from southern New Zealand also showed high levels of haplotype diversity paired with low nucleotide diversity (Hickey et al. Citation2009). Additionally, a decrease in genetic diversity with increasing latitude has also been demonstrated in other species of crustacea (McMillen-Jackson and Bert Citation2003). The high effective population size of NZ scampi may reflect the relatively large area of available habitat, as greater habitat area is available to deep-water species than species constrained to coastal habitat. Mismatch distributions and the Bayesian skyline plot also reported patterns of population expansion.
The Pleistocene was characterised by a series of glacial-interglacial cycles that have left their mark upon the genetic population structure and demographic history of many taxa (see Hewitt Citation2000, Citation2004; Petit et al. Citation2003; Hickey et al. Citation2009). Pleistocene glacial cycles led to repeated extirpation-recolonisation events within the Southern Ocean fauna (Fraser et al. Citation2009; Nikula et al. Citation2010), and the onset of the present interglacial has allowed many Southern Hemisphere species to expand their distributions southward (Fraser et al. Citation2012). The northern and southern distribution limits of NZ scampi are bound by unfavourable bathymetry such that it is difficult to determine its thermal tolerance range. Southward isotherm tracking following the LGM, as recorded for a variety of marine invertebrates from shelf and slope depths (e.g. Maurea blacki, Marshall Citation1995; Zygochlamys delicatula, Beu Citation1999), could explain the genetic signal of population expansion exhibited by almost all of the populations analysed.
Post-glacial population expansion has been reported for other crustacean species within New Zealand waters (Nikula et al. Citation2010), and other areas of the world, including the Caribbean Sea and the North Atlantic Ocean (Maggs et al. Citation2008; Naro-Maciel et al. Citation2011). Post-glacial population expansion events among marine lobsters have largely been attributed to an increase in available habitat (Kennington et al. Citation2013). Lower sea-levels during the LGM do not appear to have significantly altered the amount of habitat that might have been available to NZ scampi, but may have altered habitat composition and other faunal elements. Populations of European scampi (Nephrops norvegicus) in the North Atlantic Ocean have recolonised areas after local extirpation potentially caused by glaciation (Stamatis et al. Citation2004; Pampoulie et al. Citation2011), and their genetic homogeneity has been attributed to this recent range expansion (Stamatis et al. Citation2004; Pampoulie et al. Citation2011). NZ scampi occupy similar habitat to European scampi and may have been subject to comparable extirpation events.
Management implications for New Zealand scampi
NZ scampi are currently managed as 11 separate units within the New Zealand Exclusive Economic Zone under New Zealand's quota management system. The genetically distinct populations reported in this study are currently managed separately. Photographic and trawl-based surveys of NZ scampi report stable population sizes for the areas examined within this study (Cryer et al. Citation2003; Tuck Citation2013, Citation2014; Tuck et al. Citation2015), and the estimates of genetic diversity and effective population size reported here remain high and show no indication of ongoing genetic bottleneck effects. Well managed commercial harvest of NZ scampi is unlikely to greatly impact their overall population dynamics and genetic diversity as populations are only exploited within a small proportion of their overall range. Although they live within burrows in areas of mud substrate, much of their range also incorporates rocky ground within such areas, which is not conducive to trawl-based fisheries (Wahle et al. Citation2011). A pot-based scampi fishery has been explored (Major et al. Citation2017), but does not appear to be commercially viable.
Photographic surveys of NZ scampi off the Auckland Islands observed a greater proportion of individuals emerged from their burrows compared to those of other surveyed management areas (Tuck Citation2015). If emergence levels for NZ scampi are greater at the Auckland Islands, their susceptibility to trawl-based fisheries is increased, as burrows offer protection from the light trawl gear employed which only catches emerged individuals (Cryer et al. Citation2003). NZ scampi from the Auckland Islands contain significant genetic variation unique to the Auckland Islands region, and this variation should be conserved. The current spatial arrangement of NZ scampi management areas has been designed to consider distinct NZ scampi grounds and fisheries (NZ scampi populations with similar recruitment trends and demographic parameters, and similar bycatch species) separately. This approach treats populations either side of East Cape, off the Auckland Islands, and on the Chatham Rise as separate management units, and with sustainable harvesting within these units, this continued approach should maintain stable population sizes and genetic diversity. We recommend that NZ scampi populations either side of East Cape, off the Auckland Islands, and on the Chatham Rise continue to be managed separately and are not overexploited. The present management areas and allocated harvests should achieve this.
Supplemental material
Download MS Word (614.3 KB)Acknowledgements
We would like to acknowledge the following: Rick Webber (Museum of New Zealand Te Papa Tongarewa) for constructive comments and discussion regarding the life cycle of NZ scampi, and access to Te Papa's collections. Keith Probert (University of Otago) for comment on the occurrence of NZ scampi off the south-eastern South Island. Sadie Mills for access to the NIWA invertebrate collection, and the base map used in Figure 1. Nic Rawlence for constructive comments on an earlier version of this manuscript. Thank you to the crew of the RV Kaharoa and FV Bilyara for obtaining the specimens used for this study.
Disclosure statement
No potential conflict of interest was reported by the authors.
Data availability statement
The DNA sequences generated for this study are available on Figshare. DOI:10.6084/m9.figshare.11465565
ORCID
Peter A. Ritchie http://orcid.org/0000-0002-8351-7931
Additional information
Funding
References
- Ayers K, Waters J. 2005. Marine biogeographic disjunction in central New Zealand. Marine Biology. 147(4):1045–1052.
- Baco AR, Etter RJ, Ribeiro PA, Von der Heyden S, Beerli P, Kinlan BP. 2016. A synthesis of genetic connectivity in deep-sea fauna and implications for marine reserve design. Molecular Ecology. 25(14):3276–3298.
- Bandelt H-J, Forster P, Röhl A. 1999. Median-joining networks for inferring intraspecific phylogenies. Molecular Biology and Evolution. 16(1):37–48.
- Beu AG. 1999. Fossil records of the cold-water scallop Zygochlamys delicatula (Mollusca: Bivalvia) off northernmost New Zealand: how cold was the Last Glacial Maximum? New Zealand Journal of Geology and Geophysics. 42(4):543–550.
- Bors EK, Rowden AA, Maas EW, Clark MR, Shank TM. 2012. Patterns of deep-sea genetic connectivity in the New Zealand region: implications for management of benthic ecosystems. Plos One. 7(11):e49474.
- Brewin PE, Probert PK, Barker MF. 2008. Deep-basin macrobenthos of doubtful sound, Fiordland, New Zealand. New Zealand Journal of Marine and Freshwater Research. 42(1):1–21.
- Brewin PE, Probert PK, Barker MF. 2011. Relative influence of processes structuring fjord deep-water macrofaunal communities across multiple spatial scales. Marine Ecology Progress Series. 425:175–191.
- Carter RM. 1985. Modern and relict sedimentation on the South Otago continental shelf, New Zealand. New Zealand Department of Scientific and Industrial Research.
- Carter L, Carter RM. 1986. Holocene evolution of the nearshore sand wedge, South Otago continental shelf, New Zealand. New Zealand Journal of Geology and Geophysics. 29(4):413–424.
- Carter L, Carter RM. 1988. Late quaternary development of left-bank-dominant levees in the Bounty Trough, New Zealand. Marine Geology. 78(3-4):185–197.
- Chiswell SM. 2009. Colonisation and connectivity by intertidal limpets among New Zealand, Chatham and Sub-Antarctic Islands. II. Oceanographic connections. Marine Ecology Progress Series. 388:121–135.
- Chiswell SM, Booth JD. 1999. Rock lobster Jasus edwardsii larval retention by the Wairarapa Eddy off New Zealand. Marine Ecology Progress Series. 183:227–240.
- Chiswell SM, Bostock HC, Sutton PJH, Williams MJM. 2015. Physical oceanography of the deep seas around New Zealand: a review. New Zealand Journal of Marine and Freshwater Research. 49(2):286–317.
- Chiswell SM, Roemmich D. 1998. The East Cape Current and two eddies: a mechanism for larval retention? New Zealand Journal of Marine and Freshwater Research. 32(3):385–397.
- Corander J, Tang J. 2007. Bayesian analysis of population structure based on linked molecular information. Mathematical Biosciences. 205(1):19–31.
- Cowen RK, Lwiza KM, Sponaugle S, Paris CB, Olson DB. 2000. Connectivity of marine populations: open or closed? Science. 287(5454):857–859.
- Cowen RK, Sponaugle S. 2009. Larval dispersal and marine population connectivity. Annual Review of Marine Science. 1(1):443–466.
- Cryer M, Downing K, Hartill B, Drury J, Armiger HJ, Middleton C, Smith MD. 2003. Digital photography as a stock assessment tool for Metanephrops challengeri on New Zealand’s continental slope. Deep Sea 2003: Conference on the Governance and Management of Deep-Sea Fisheries Part 1 Conference Reports.
- Cryer M, Stotter DR. 1999. Movement and growth rates of scampi inferred from tagging, Alderman Islands, Western Bay of Plenty. NIWA Technical Report. 49.
- Darriba D, Taboada GL, Doallo R, Posada D. 2012. Jmodeltest 2: more models, new heuristics and parallel computing. Nature Methods. 9(8):772–772.
- Drummond AJ, Rambaut A, Shapiro B, Pybus OG. 2005. Bayesian coalescent inference of past population dynamics from molecular sequences. Molecular Biology and Evolution. 22(5):1185–1192.
- Drummond AJ, Suchard MA, Xie D, Rambaut A. 2012. Bayesian phylogenetics with BEAUti and the BEAST 1.7. Molecular Biology and Evolution. 29(8):1969–1973.
- Elshire RJ, Glaubitz JC, Sun Q, Poland JA, Kawamoto K, Buckler ES, Mitchell SE. 2011. A robust, simple genotyping-by-sequencing (GBS) approach for high diversity species. Plos One. 6(5):e19379.
- Excoffier L, Lischer HE. 2010. Arlequin Suite Ver 3.5: a new series of programs to perform population genetics analyses under Linux and Windows. Molecular Ecology Resources. 10(3):564–567.
- Faurby S, Barber PH. 2012. Theoretical limits to the correlation between pelagic larval duration and population genetic structure. Molecular Ecology. 21(14):3419–3432.
- Fleming AM, Dohner MM, Phillips NE, Ritchie PA. 2018. Genetic connectivity among populations of two congeneric direct-developing whelks varies across spatial scales. New Zealand Journal of Marine and Freshwater Research. 52(1):100–117.
- Fleming K, Johnston P, Zwartz D, Yokoyama Y, Lambeck K, Chappell J. 1998. Refining the eustatic sea-level curve since the Last Glacial Maximum using far- and intermediate-field sites. Earth and Planetary Science Letters. 163(1-4):327–342.
- Folmer O, Hoeh W, Black M, Vrijenhoek R. 1994. Conserved primers for PCR amplification of mitochondrial DNA from different invertebrate phyla. Molecular Marine Biology and Biotechnology. 3(5):294–299.
- Fraser CI, Nikula R, Ruzzante DE, Waters JM. 2012. Poleward bound: biological impacts of Southern Hemisphere glaciation. Trends in Ecology & Evolution. 27(8):462–471.
- Fraser CI, Nikula R, Spencer HG, Waters JM. 2009. Kelp genes reveal effects of subantarctic sea ice during the Last Glacial Maximum. Proceedings of the National Academy of Sciences. 106(9):3249–3253.
- Fu YX. 1997. Statistical tests of neutrality of mutations against population growth, hitchhiking and background selection. Genetics. 147(2):915–925.
- Goldstien SJ, Schiel DR, Gemmell NJ. 2006. Comparative phylogeography of coastal limpets across a marine disjunction in New Zealand. Molecular Ecology. 15(11):3259–3268.
- Grant WS, Bowen B. 1998. Shallow population histories in deep evolutionary lineages of marine fishes: insights from sardines and anchovies and lessons for conservation. Journal of Heredity. 89(5):415–426.
- Hawke DJ. 1989. Hydrology and near-surface nutrient distribution along the South Otago continental shelf, New Zealand, in summer and winter 1986. New Zealand Journal of Marine and Freshwater Research. 23(3):411–420.
- Hewitt GM. 2000. The genetic legacy of the Quaternary ice ages. Nature. 405(6789):907–913.
- Hewitt GM. 2004. Genetic consequences of climatic oscillations in the Quaternary. Philosphical Transactions of the Royal Society of London B: Biological Sciences. 359(1442):183–195.
- Hickey AJ, Lavery SD, Hannan DA, Baker CS, Clements KD. 2009. New Zealand triplefin fishes (family Tripterygiidae): contrasting population structure and mtDNA diversity within a marine species flock. Molecular Ecology. 18(4):680–696.
- Hilário A, Metaxas A, Gaudron SM, Howell KL, Mercier A, Mestre NC, Ross RE, Thurnherr AM, Young C. 2015. Estimating dispersal distance in the deep sea: challenges and applications to marine reserves. Frontiers in Marine Science. 2(6). English.
- Jensen JL, Bohonak AJ, Kelley ST. 2005. Isolation by distance, web service. BMC Genetics. 6(1):13.
- Jørgensen HB, Hansen MM, Bekkevold D, Ruzzante DE, Loeschcke V. 2005. Marine landscapes and population genetic structure of herring (Clupea harengus L.) in the Baltic Sea. Molecular Ecology. 14(10):3219–3234.
- Kearse M, Moir R, Wilson A, Stones-Havas S, Cheung M, Sturrock S, Buxton S, Cooper A, Markowitz S, Duran C, et al. 2012. Geneious Basic: an integrated and extendable desktop software platform for the organization and analysis of sequence data. Bioinformatics. 28(12):1647–1649.
- Kennington WJ, Melville-Smith R, Berry O. 2013. Genetics of wild and captive lobster populations. Lobsters: biology, management, aquaculture and fisheries. Chichester: John Wiley & Sons; p. 36–63.
- Knowlton N, Weigt LA. 1998. New dates and new rates for divergence across the Isthmus of Panama. Proceedings of the Royal Society of London Series B: Biological Sciences. 265(1412):2257–2263.
- Laikre L, Palm S, Ryman N. 2005. Genetic population structure of fishes: implications for coastal zone management. AMBIO: A Journal of the Human Environment. 34(2):111–119.
- Leigh JW, Bryant D. 2015. Popart: full-feature software for haplotype network construction. Methods in Ecology and Evolution. 6(9):1110–1116.
- Levin LA. 2006. Recent progress in understanding larval dispersal: new directions and digressions. Integrative and Comparative Biology. 46(3):282–297.
- Librado P, Rozas J. 2009. DnaSP v5: a software for comprehensive analysis of DNA polymorphism data. Bioinformatics. 25(11):1451–1452. English.
- Lobel PS, Robinson AR. 1986. Transport and entrapment of fish larvae by ocean mesoscale eddies and currents in Hawaiian waters. Deep Sea Research Part A Oceanographic Research Papers. 33(4):483–500.
- Lowe WH, Allendorf FW. 2010. What can genetics tell us about population connectivity? Molecular Ecology. 19(15):3038–3051. English.
- Mackay KA, Mitchell JS, Neil HL, Mackay EJ. 2015. New Zealand’s Marine Realm. Wellington, New Zealand.
- Maggs CA, Castilho R, Foltz D, Henzler C, Jolly MT, Kelly J, Olsen J, Perez KE, Stam W, Väinölä R, et al. 2008. Evaluating signatures of glacial refugia for North Atlantic benthic marine taxa. Ecology. 89:S108–S122.
- Major RN, Taylor DI, Connor S, Connor G, Jeffs AG. 2017. Factors affecting bycatch in a developing New Zealand scampi potting fishery. Fisheries Research. 186:55–64.
- Marko PB, Hart MW. 2017. Genetic analysis of larval dispersal, gene flow, and connectivity. Evolutionary ecology of marine invertebrate larvae. p. 164.
- Marshall BA. 1995. A revision of the recent Calliostoma species of New Zealand (Mollusca: Gastropoda: Trochoidea). Nautilus. 108(4):83.
- McMillen-Jackson AL, Bert TM. 2003. Mitochondrial DNA variation and population genetic structure of the blue crab Callinectes sapidus in the eastern United States. Marine Biology. 145(4):769–777.
- Ministry for Primary Industries. 2016. Fisheries assessment plenary, May 2016: stock assessments and stock status. Wellington, New Zealand.
- Naro-Maciel E, Reid B, Holmes KE, Brumbaugh DR, Martin M, DeSalle R. 2011. Mitochondrial DNA sequence variation in spiny lobsters: population expansion, panmixia, and divergence. Marine Biology. 158(9):2027–2041.
- Nikula R, Fraser C, Spencer H, Waters J. 2010. Circumpolar dispersal by rafting in two subantarctic kelp-dwelling crustaceans. Marine Ecology Progress Series. 405:221–230.
- Ovenden JR. 2013. Crinkles in connectivity: combining genetics and other types of biological data to estimate movement and interbreeding between populations. Marine and Freshwater Research. 64(3):201–207. English.
- Palero F, Abelló P, Macpherson E, Gristina M, Pascual M. 2008. Phylogeography of the European spiny lobster (Palinurus elephas): influence of current oceanographical features and historical processes. Molecular Phylogenetics and Evolution. 48(2):708–717.
- Pampoulie C, Skirnisdottir S, Hauksdottir S, Olafsson K, Eiriksson H, Chosson V, Hreggvidsson GO, Gunnarsson GH, Hjorleifsdottir S. 2011. A pilot genetic study reveals the absence of spatial genetic structure in Norway lobster (Nephrops norvegicus) on fishing grounds in Icelandic waters. Ices Journal of Marine Science. 68(1):20–25.
- Perez-Enriquez R, Vega A, Avila S, Sandoval JL. 2001. Population genetics of red spiny lobster (Panulirus interruptus) along the Baja California Peninsula, Mexico. Marine and Freshwater Research. 52(8):1541–1549.
- Petit RJ, Aguinagalde I, de Beaulieu J-L, Bittkau C, Brewer S, Cheddadi R, Ennos R, Fineschi S, Grivet D, Lascoux M. 2003. Glacial refugia: hotspots but not melting pots of genetic diversity. Science. 300(5625):1563–1565.
- Rambaut A, Drummond AJ, Xie D, Baele G, Suchard MA. 2018. Posterior summarization in Bayesian phylogenetics using Tracer 1.7. Systematic Biology. 67(5):901–904.
- Reiss H, Hoarau G, Dickey-Collas M, Wolff WJ. 2009. Genetic population structure of marine fish: mismatch between biological and fisheries management units. Fish and Fisheries. 10(4):361–395. English.
- Rogers AR, Harpending H. 1992. Population growth makes waves in the distribution of pairwise genetic differences. Molecular Biology and Evolution. 9(3):552–569.
- Ross PM, Hogg ID, Pilditch CA, Lundquist CJ. 2009. Phylogeography of New Zealand's coastal benthos. New Zealand Journal of Marine and Freshwater Research. 43(5):1009–1027.
- Rousset F. 1997. Genetic differentiation and estimation of gene flow from F-statistics under isolation by distance. Genetics. 145(4):1219–1228.
- Sambrook J, Fritsch EF, Maniatis T. 1989. Molecular cloning. Vol. 2. New York: Cold Spring Harbor Laboratory Press.
- Schubart CD, Diesel R, Hedges SB. 1998. Rapid evolution to terrestrial life in Jamaican crabs. Nature. 393(6683):363–365. DOI:10.1038/30724.
- Shaw AGP, Kavalieris L, Vennell R. 1999. Seasonal and inter-annual variability of SST off the East Coast of the South Island, New Zealand. Geocarto International. 14(3):29–34.
- Slatkin M. 1995. A measure of population subdivision based on microsatellite allele frequencies. Genetics. 139(1):457–462.
- Smith PJ. 1999. Allozyme variation in scampi (Metanephrops challengeri) fisheries around New Zealand. New Zealand Journal of Marine and Freshwater Research. 33(3):491–497. English.
- Stamatis C, Triantafyllidis A, Moutou KA, Mamuris Z. 2004. Mitochondrial DNA variation in Northeast Atlantic and Mediterranean populations of Norway lobster, Nephrops norvegicus. Molecular Ecology. 13(6):1377–1390. English.
- Stevens MI, Hogg ID. 2004. Population genetic structure of New Zealand's endemic corophiid amphipods: evidence for allopatric speciation. Biological Journal of the Linnean Society. 81(1):119–133.
- Tajima F. 1989. Statistical method for testing the neutral mutation hypothesis by DNA polymorphism. Genetics. 123(3):585–595.
- Thornhill DJ, Mahon AR, Norenburg JL, Halanych KM. 2008. Open-ocean barriers to dispersal: a test case with the Antarctic Polar Front and the ribbon worm Parborlasia corrugatus (Nemertea: Lineidae). Molecular Ecology. 17(23):5104–5117.
- Tuck ID. 2013. Characterisation and length-based population model for scampi (Metanephrops challengeri) on the Mernoo Bank (SCI 3). Wellington, New Zealand: Ministry for Primary Industries.
- Tuck ID. 2014. Characterisation and length-based assessment model for scampi (Metanephrops challengeri) in the Bay of Plenty (SCI 1) and Hawke Bay/Wairarapa (SCI 2). Wellington, New Zealand: Ministry for Primary Industries.
- Tuck ID. 2015. Characterisation and a length-based assessment model for scampi (Metanephrops challengeri) at the Auckland Islands (SCI 6A). NIWA.
- Tuck ID, Parkinson D, Armiger H, Smith M, Miller A, Rush N, Spong K. 2015. Estimating the abundance of scampi in SCI6A (Auckland Islands) in 2013. New Zealand Fisheries Assessment Report. 10.
- Veale AJ, Lavery SD. 2011. Phylogeography of the snakeskin chiton Sypharochiton pelliserpentis (Mollusca: Polyplacophora) around New Zealand: are seasonal near-shore upwelling events a dynamic barrier to gene flow? Biological Journal of the Linnean Society. 104(3):552–563.
- Veale AJ, Lavery SD. 2012. The population genetic structure of the waratah anemone (Actinia tenebrosa) around New Zealand. New Zealand Journal of Marine and Freshwater Research. 46(4):523–536.
- Wahle R, MacDiarmid A, Butler M, Cockcroft A, Chan TY. 2011. Metanephrops Challengeri.
- Wallner B, Phillips BF. 1990. Development of a trawl fishery for deepwater metanephropid lobsters off the North West Continental slope of Australia: designing a management strategy compatible with species life history. CSIRO Division of Fisheries.
- Walton K, Marshall BA, Phillips NE, Verry AJF, Ritchie PA. 2019. Phylogeography of the New Zealand whelks Cominella maculosa and C. virgata (Gastropoda: Neogastropoda: Buccinoidea: Buccinidae). Biological Journal of the Linnean Society. 126(1):178–202.
- Waters J, Roy M. 2004. Phylogeography of a high-dispersal New Zealand sea-star: does upwelling block gene-flow? Molecular Ecology. 13(9):2797–2806.
- Wear RG. 1976. Studies on the larval development of Metanephrops challengeri (Balss, 1914) (Decapoda, Nephropidae). Crustaceana. 30(2):113–122.
- Wennerström L, Laikre L, Ryman N, Utter FM, Ab Ghani NI, André C, DeFaveri J, Johansson D, Kautsky L, Merilä J, et al. 2013. Genetic biodiversity in the Baltic Sea: species-specific patterns challenge management. Biodiversity and Conservation. 22(13-14):3045–3065.
- Yaldwyn JC, Webber WR. 2011. Annotated checklist of New Zealand Decapoda (Arthropoda: Crustacea). Tuhinga. 22:171–272.
- Zacarias LD. 2013. Genetic population structure of deep-water prawns Haliporoides triarthrus and langoustines Metanephrops mozambicus in the South West Indian Ocean: use of mitochondrial DNA to investigate metapopulation structure [masters thesis]. Durban, South Africa: University of KwaZulu-Natal.