
ABSTRACT
Microplastic (MP) particles (<5000 µm) pose a risk to many marine organisms. Globally, sponges are important suspension-feeding organisms that may be particularly vulnerable to MPs since many of these particles fall within their food size range. However, there has been little research on spatial variation in MP abundance in sponges. Here we examined MP abundance and spatial variation in sponges from Aotearoa New Zealand (NZ). We aimed to confirm the presence of potential microplastics (PMPs) in samples from 45 sponge samples across six species and three sites in the Wellington Harbour. Samples were digested with bleach, filtered, and analysed using fluorescent microscopy to quantify and measure PMPs. PMPs were present in every sponge sample with abundances between 207 ± 131 and 1893 ± 396 PMP particles g-1 (dry sponge weight). There were significant differences in PMP abundance between sites and between some species, but most of the variation was explained by site (40–53% vs. 4–24% of the variance). Our results suggest that PMP abundance in sponges is mainly explained by spatial variation in microplastic abundance rather than species identity.
Introduction
Globally, plastic waste is now so ubiquitous that it is considered a defining characteristic and a key geological indicator of the Anthropocene era (Zalasiewicz et al. Citation2016). The prevalence of plastics in the marine environment is widespread, reaching even remote areas such as the deep-sea floor and polar regions (Zalasiewicz et al. Citation2016) and poses a threat to many marine organisms (Prokić et al. Citation2019; Shannon Citation2020; Celis-Hernández et al. Citation2021; Girard et al. Citation2021; Ruffell et al. Citation2021). The global production of plastics increased from 1.7 million tonnes per annum in the 1950s (Auta et al. Citation2017) to 367 million tonnes in 2020 (Tiseo Citation2022) and has resulted in a huge accumulation of plastics in the oceans that is expected to continue to increase exponentially (Isobe et al. Citation2019). Microplastics (MPs) refer to plastic particles that are smaller than 5000 µm (Andrady Citation2011; Bridson et al. Citation2020; Fallon and Freeman Citation2021). These plastic particles can originate directly from manufacturing processes, such as purpose-built micro pellets used in cosmetics (primary MPs), or indirectly from larger pieces of plastic waste that have broken down over time (secondary MPs) (Sutton et al. Citation2016; Auta et al. Citation2017; Kokalj et al. Citation2021; Kiran et al. Citation2022).
MP particles pose a risk to marine taxa as their small size makes them easily ingestible (Andrady Citation2011; Gago et al. Citation2016; Auta et al. Citation2017; Markic et al. Citation2018; Gambarini et al. Citation2021; Kurniawan et al. Citation2021). MPs can also bioaccumulate within organisms posing a threat to animal health (Fossi et al. Citation2016; Sutton et al. Citation2016; Auta et al. Citation2017; Webb et al. Citation2020). Although MPs and nanoplastics (NPs, <1 µm) are unable to be digested or absorbed themselves (Andrady Citation2017; Andrady and Rajapakse Citation2019), they can transport heavy metals, persistent organic pollutants (POPs), chemical additives such as plasticisers, and residual monomers (often from polystyrene), which can leech into organisms and may be toxic (Andrady Citation2011, Citation2017; Brennecke et al. Citation2016; Andrady and Rajapakse Citation2019; Fallon and Freeman Citation2021; Richardson et al. Citation2021).
Marine sponges (Phylum Porifera) are generally long-lived, sessile, suspension-feeding invertebrates, and as such are particularly vulnerable to MPs (de Bhowmick et al. Citation2021; Fallon and Freeman Citation2021; Saliu et al. Citation2022). Sponges are highly abundant in tropical, temperate, and polar ecosystems (Bell et al. Citation2020), where they fulfil a range of important functional roles. Sponges filter large quantities of water and remove particulate organic matter with high efficiency (Bell Citation2008). Captured particles are ingested through phagocytosis (where the particle passes through the ostia and so the size is limited to the size of the ostia), and endocytosis (through the exopinacocytes (external cells) on the outer-most body layer) (Girard et al. Citation2021). Earlier research indicates that particles incorporated through phagocytosis are generally small, measuring around 5–50 µm (Reiswig Citation1971; Fallon and Freeman Citation2021; Girard et al. Citation2021), and that larger particles are incorporated into the sponge via exopinacocytes (Fallon and Freeman Citation2021; Girard et al. Citation2021). Furthermore, many previous studies (e.g. Perea-Blazquez et al. Citation2012) have shown that different sponge species preferentially consume different sized food particles, highlighting that sponge identify may be important in MP accumulation.
Recent studies examining the presence and abundance of microplastics in tropical sponges have confirmed that they are able to uptake foreign particles, such as microplastics, and incorporate them into their structure (Celis-Hernández et al. Citation2021; Fallon and Freeman Citation2021; Girard et al. Citation2021; Saliu et al. Citation2022; Soares et al. Citation2022). Furthermore, some studies suggest that MP uptake in sponges may be selective and that spiculate sponges generally tend to incorporate smaller particles into their skeletons (<50 µm), whereas non-spiculate sponges tend to incorporate larger particles (>50 µm) into their skeletons (Fallon and Freeman Citation2021; Girard et al. Citation2021). As a result of these studies, several authors have suggested that sponges might act as bioindicators of microplastic or microparticulate pollutants (Batista et al. Citation2014; Celis-Hernández et al. Citation2021; Fallon and Freeman Citation2021; Girard et al. Citation2021). Microplastics (or potential MPs) have been found to be present in sponges in the Mediterranean, Maldives (Saliu et al. Citation2022), Brazil (Soares et al. Citation2022), Panama (Fallon and Freeman Citation2021), Indonesia (Girard et al. Citation2021), Mexico (Celis-Hernández et al. Citation2021), and the North Sea (Karlsson et al. Citation2017). Currently little known about the effect that these MPs may have on the biological functions of sponges, although de Marchi et al. (Citation2022) found that MP presence impaired the filtration and respiration rates of the Mediterranean sponge Petrosia ficiformis.
Wellington Harbour (Te Whanganui-a-Tara) on the southern end of New Zealand’s North Island encompasses an area of about 85 km² (Wear and Gardner Citation2001), is semi-enclosed, and has a flushing time of approximately 10 days (Wear and Gardner Citation2001; Helson and Gardner Citation2004). The harbour has a large catchment area (725 km²) with a large river and several streams contributing to freshwater inflow (Booth Citation1984; Wear and Gardner Citation2001). The harbour receives inputs from urban discharge and stormwater run-off, which may contain contaminants (see ; Dickinson et al. Citation1996; Stephenson et al. Citation2008; Oliver Citation2011). MP presence in Wellington Harbour area has been previously recorded in green lipped mussels (Webb et al. Citation2019, Citation2020; Shannon Citation2020), marine sediments (Shannon Citation2020), and in streams that feed into the harbour (Mora-Teddy and Matthaei Citation2020). In the present study we assessed the presence of MPs in different sponge species across three sites in Wellington Harbour to assess the relative importance of location or species identity in determining MPs abundance. The aims of this study were: (1) to identify any presence of microplastics in sponges in Wellington Harbour; (2) measure spatial variation in MPs in sponges in Wellington Harbour; and (3) assess any differences in accumulation rates between different sponge species at the same location.
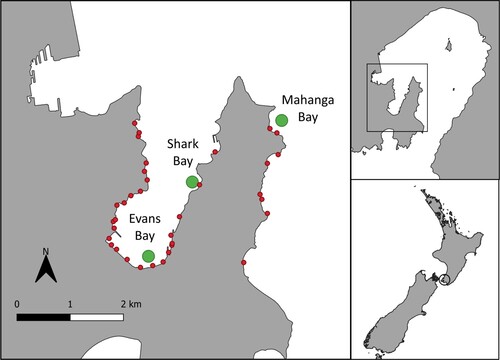
Figure 1. Left: Map of study sites in Wellington Harbour, New Zealand. The green circles mark the three sample sites: Evans Bay, Shark Bay, and Mahanga Bay. The red circles represent stormwater pipe outlets (Wellington City Council, n.d.). Note the higher concentration of stormwater pipe outlets closer to the Evans Bay site. Right: Map of the wider Wellington Harbour. Inset shows the location relative to Aotearoa New Zealand.
Materials and methods
Study site and sample collection
Sponge samples were collected at three sites in the harbour: Mahanga Bay (-41.291822, 174.834171), Shark Bay (-41.301300, 174.817265), and Evans Bay (-41.316188, 174.803839) () on 15th April 2022. Because of the potential impact of storm water or rainfall runoff on the availability of MPs to sponges, the sampling date was chosen based on there being no rainfall in the preceding 5 days. Samples at each site were collected via SCUBA between 2 and 11 m depth. Each sponge sample collected was at least 3 m away from each other sample and covered a total reef length of approximately 150 m. A small sample (2 to 5 cm3 approximately) was removed using a steel blade or by hand from five sponges (N = 5) of three different species at each site. The variation in size of sponge samples reflected the different morphologies of sponges and the difficulty collecting an exact amount of tissue in each sample. Sponge species collected were those that were the most abundant at each site. At Mahanga Bay, Crella incrustans, Suberites australiensis, and Dactylia varia were sampled; at Shark Bay, Crella incrustans, Suberites australiensis, and Chondropsis sp. were sampled; and at Evans Bay Crella incrustans, Crella affinis, and Halichondria knowltoni were sampled. The species that were present at each site varied, with only one species consistently present across all three sites. This species (Crella incrustans) along with two other abundant species were collected at each site. Each separate sponge sample was wrapped immediately in aluminium foil underwater to prevent any plastic contamination and transported in a mesh bag to the laboratory within two hours of collection.
Sample processing
Sponge samples were kept frozen (−20°C) and wrapped in aluminium foil until processing. As the study was only focussed on microplastics (MPs) that were retained within the sponge body, sponge samples were individually rinsed with analytical grade water (Barnstead EASYpure III, RF/UV) to remove any sand, stones, or other detritus from the outside of the sponge. Visible pebbles or organic detritus that were not removed through rinsing were removed with forceps. Samples were then cut into smaller segments (approximately 1 cm long) in a glass petri dish using a steel scalpel blade and wrapped in a clean piece of aluminium foil. All instruments (forceps, scalpel, and petri dish) were washed with warm water and soap and rinsed three times with analytical grade water between handling each sample. Sponge samples were then frozen at -80°C for 48 hours to enhance lyophilisation (using a VirTis lyophilizer).
In total 45 samples were used (3 × sites, 3 × species at each site, 5 × replicates). The samples were processed in batches, based on site, at different times over two days. Forceps were used to place smaller sponge fragments into a clean 20 mL glass scintillation vial (which had been rinsed three times with analytical grade water to eliminate external MPs contaminating the samples) and weighed. Based on a preliminary trial of this methodology, we determined that smaller fragments were more easily digested. Furthermore, when vacuum filtered, bigger samples of spiculated sponges left more spicules and detritus on the filter, which made MP visualisation more difficult. Therefore, a smaller subsample between 0.03 g and 0.04 g (dry weight) was used, which was not completely homogenised to minimise handling and subsequent potential for contamination. Due to the difference in sponge density between the species, the dry mass of each sample varied and therefore all values were standardised to per gram of sponge tissue.
Each sample was handled individually, with minimal air exposure to mitigate potential contamination from airborne MPs. After being weighed, 10 mL of household bleach (6% sodium hypochlorite, NaCl) was added to each vial. All samples (including controls – see below) were agitated manually for 30 seconds and left for approximately 48 hours to digest, allowing for all sponge organic material to be completely digested before filtering and aid with MP identification (Lusher et al. Citation2020b). Samples were digested at ambient temperature to mitigate the risk of potentially discolouring or degrading weaker polymers (see Lusher et al. Citation2020b). Samples were agitated manually (not vigorously to avoid breaking up particles) for an additional 30 s after 24 hours and approximately 5 ml of additional bleach was added to any vials where the samples were taking longer to digest. All samples digested completely within 48 hours.
Bleach was prefiltered using a precombusted glass microfibre filter (0.7 μm pore size, Munktell MGF, Dia 47 mm) to remove potential plastic contaminants and stored in a glass bottle covered with aluminium foil. When all the samples were fully digested, each sample was filtered onto a precombusted glass microfibre filter (0.7 μm pore size, Munktell MGF, Dia 47 mm) using a glass vacuum filter. When the sample was filtered, the vial was rinsed with analytical grade water at least three times to remove any PMPs remaining in the vial and this water was filtered with the sample. Additionally, the inside of the funnel was rinsed three times to ensure MPs were retained on the filter. Filters were stored individually in a foil casing in a refrigerator (wet) until MP visualisation.
As we only used fluorescence microscopy to visually identify and quantify microplastics, rather than Raman spectroscopy or Fourier transform infrared (FTIR) spectroscopy for secondary verification (Fallon and Freeman Citation2021), consistent with the literature, we refer to the particles we found as potential microplastics (PMPs) not microplastics (MPs) and acknowledge that the lack of secondary verification may lead to samples being positively skewed (see Fallon and Freeman Citation2021).
PMP visualisation
Each filter was fixed onto a clean glass microscope slide using a few drops of analytical grade water. The filter was then scanned visually with a Leica fluorescent microscope (UV- 1A fluorescent setting) at 100X magnification. Images were acquired using a Leica DMC 4500 camera (Leica Microsystems, Switzerland) and PMPs were measured using the Leica Application Suite (Version 4.13.0 [Build: 310]). To minimise handling and the potential introduction of contaminants, once the filter was fixed centrally to the microscope slide, its position was not adjusted. This meant that only the central strip of the filter was analysed for PMPs, by scanning the filter in a sweeping motion from left to right, then right to left, beginning at the top of the slide, and moving down until the whole central section was surveyed and all PMPs were observed. All PMP images were referenced, providing a visual calibration for consistent colour classification. All filters were analysed by the same person to prevent observer effects.
PMPs were categorised as either fibres (generally at least twice as long as they were wide and uniform in shape) or fragments (angular or subangular, rounded, or subrounded) (after Lusher et al. Citation2020a). PMPs were measured along their longest axis (maximum Feret’s diameter) and categorised into five size groups: 10–50 µm, 51–100 µm, 101–500 µm, 501–1000 µm, and 1001–5000 µm, consistent with existing literature (e.g. Hidalgo-Ruz et al. Citation2012; Löder and Gerdts Citation2015; Covernton et al. Citation2019; Fallon and Freeman Citation2021). PMP visualisation was consistent with Fallon and Freeman (Citation2021), based on the fluorescent behaviour of plastic. These authors found that light coloured plastic particles fluoresce a bright electric blue under UV light and fluoresce much brighter than other materials such as sand grains (Fallon and Freeman Citation2021). Some plastics can fluoresce other colours (e.g. red plastic particles tend to fluoresce pink) and some plastics do not fluoresce. In this study, despite observing some PMPs of different colours (Supplemental Figure 1), to ensure consistency, only PMPs which fluoresced a bright electric blue were measured and counted (Supplemental Figure 2). Microplastic visual identification criteria from previous literature (Hidalgo-Ruz et al. Citation2012; Löder and Gerdts Citation2015; Lusher et al. Citation2020a) were considered when identifying PMPs.
Controls and mitigating contamination
Samples were processed in batches according to their site of origin (15 samples per site) over two days with three procedural blanks processed with each batch. The procedural blanks were processed the same way as the sponge samples, the vial was opened under the fume hood during the processing then filled with approximately 20 ml of household bleach, covered in foil, agitated, left for approximately 48 hours with the other samples, and then vacuum filtered. To investigate the presence of potential airborne contamination, five filters were left exposed to air in the fume hood while other samples were processed and then stored in an aluminium foil casing for later microscopic analysis. Additionally, three vials (one for each site) were processed with only analytical grade water from the lab wash bottle (which was the only plastic piece of equipment used during processing). These vials of water were treated and processed as samples without any bleach added. Several positive controls were used to provide references for the visual identification of potential environmental contaminants (Lusher et al. Citation2020b). Dryer lint (Supplemental Figure 3) was used as a positive control and allowed visualisation of some of the clothing fibres which may contaminate the samples. Other positive controls were created from Kimtech wipes, paper towels, masking tape (used for labelling), and shavings from lab coat fibres. Different plastics from household items, such as sponges and nylon rope fibres were also visualised under the fluorescent microscope to aid in PMP visualisation identification.
To reduce background contamination and exposure of samples to external PMPs, precautions were taken in accordance with previous studies (Hidalgo-Ruz et al. Citation2012; Brander et al. Citation2020; Fallon and Freeman Citation2021; Girard et al. Citation2021). All lab equipment used to manipulate the sponge samples was either metal or glass except for the lab wash bottle and samples were kept always covered in aluminium foil to minimise potential light degradation of the plastics. Lab coats (100% cotton) were always worn, and all clothing worn was made of natural materials. Workspaces (including the fume hood) were cleaned with cotton or paper towels before use and then wiped with dust-free wipes (Kimtech Science). All surfaces were cleaned before use and there was minimal human traffic in workspaces. Additionally, a UV fluorescent light was used in the microscope lab to help in the removal of PMPs from the microscope, surfaces, and tools before analysing filters. Analytical grade water (Barnstead EASYpure III, RF/UV) was used for washing and rinsing equipment. Gloves were not used in the process as their static nature could make them a vector for contamination, and they were not deemed necessary for the sample processing. All sample processing and manipulation including sample rinsing, portioning, weighing, and vacuum filtering, was done under a clean fume hood (EcoAir®) to reduce potential airborne PMP contamination.
Equipment was covered in foil when not in use and a foil cover was placed over the glass filtration funnel while it was filtering to avoid any potential airborne contamination. After the sample was filtered, the filter was immediately removed and placed inside a completely covered aluminium foil case. All filters were precombusted (450°C for 4 h) to remove any potential contaminants from processing and were stored in an aluminium foil tray with a foil cover. The bleach used to digest the sponges was prefiltered and kept in a glass bottle covered in foil.
Data analysis
To account for potential contamination during processing, the mean number of PMP fibres, PMP fragments, and PMP totals were calculated for each of the controls. The bleach control mean values were then subtracted from the PMP fibres, PMP fragments, and PMP totals of each sponge sample at each site (3 sites × 3 sponge species × 5 replicates = 45 samples). Only the bleach control mean values were used to account for experimental contamination as these procedural blanks were processed in the same way as the samples had been processed. All subsequent data analysis was performed using the adjusted PMP count values (subtracting the control values). The data was then standardised to per gram of sponge tissue to account for the portion of the sample filters that were not visually scanned. The total values for each sample, including controls, were proportionately decreased by the non-scanned filter area percentage (16.59%) to give an accurate PMP per gram of sponge tissue. All negative abundance values were changed to zero. To account for different sample weights, the adjusted PMP abundance values and the dry weight values were used to calculate the mean PMPs per gram for each sponge species at each site.
For the statistical analyses, although we categorised PMPs in to five categories, data was combined and categorised into PMPs over 100 µm and PMPs 100 µm and under. This was for two reasons: firstly, particles incorporated into sponges are generally smaller (Reiswig Citation1971; Fallon and Freeman Citation2021; Girard et al. Citation2021); and secondly, a study by Covernton et al. (Citation2019) suggested that visual identification of PMPs was less reliable at smaller sizes of <100 µm (although this did not consider visualisation using fluorescent microscopy). PMPs were also categorised into fragments and fibres.
All the statistical data analyses were performed in R version 3.1.3 (R Core Team Citation2013). Differences in sponge PMP concentration between sites and species were tested using univariate PERMANOVA on Euclidean distances (adonis, R package vegan, Oksanen et al. Citation2007), since the data did not meet the assumption of normality. Pairwise comparisons were corrected using the Benjamini-Hochberg Procedure, but uncorrected p-values are reported in the text.
All the plots were made using the ggplot2 R package (Wickham Citation2016) and Adobe Illustrator 2022.
Results
PMPs (both fragments and fibres) were present in all sponge samples in this study ( and ; ). The total PMP abundance was highest in sponge samples from Evans Bay, with Crella affinis (the only species to be sampled across all three sites) having the highest PMP abundance of all species of 1894 ± 396 PMPs per gram of tissue. Samples from Shark Bay had the lowest PMPs of 208 ± 131 PMPs per gram, which was found in Suberites australiensis (; ).
Figure 2. Example fluorescent microscopy images of some of the fibres (upper row) and fragments (lower row) of plastic found within sponge tissue from six different species in Wellington Harbour.
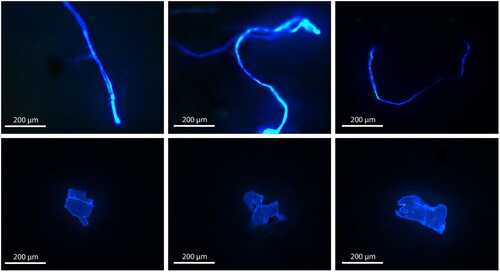
Figure 3. The total number of PMPs per gram of sponge tissue for six sponge species sampled across three sites (note that not all species were sampled at each site). The box size represents the upper and lower quartiles of the data. The middle line shows the median value and the symbol × shows the mean value. The whiskers indicate the variability of the data outside of the interquartile range. Individual data points are shown.
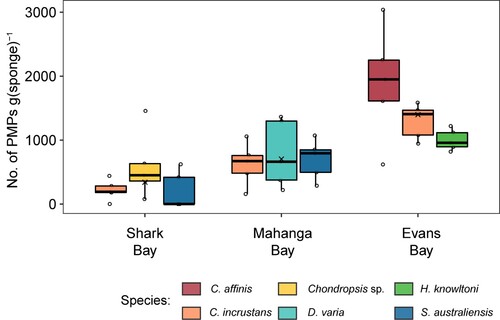
Table 1. The adjusted mean total PMP counts and the mean PMPs per gram (total, fibres, and fragments) values with standard error values for each sponge species at sampled in Wellington Harbour.
Comparing the total amount of PMPs (both fragments and fibres, all sizes), we found significant differences between sites (F = 22.2, p = 0.0001, 47% of the variance) and species (F = 2.7, p = 0.032, 14% of the variance) ( and ; Table S1). Pairwise comparisons found differences between all sites, with Evans Bay having the highest abundance of PMPs in sponges followed by Mahanga Bay and Shark Bay (p = 0.0001–0.014) (Table S1). One-way PERMANOVAs run independently for each site found significant differences in PMPs between species only at Evans Bay (F = 3.5, p = 0.0496, R2 = 0.37), where Crella affinis had the highest number of PMPs (; Table S1).
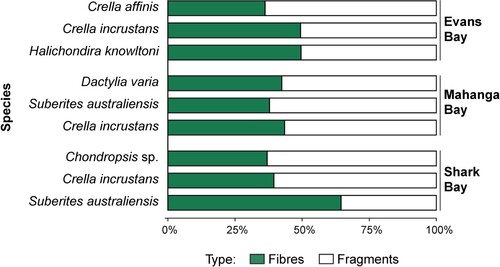
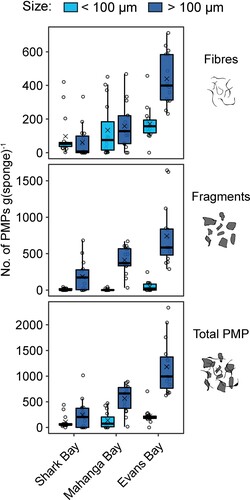
The number of PMP fragments was generally higher than the number of fibres, regardless of site (F = 4.07, p = 0.0049), except for Suberites australiensis at Shark Bay ( and ; Table S2). Comparing PMP fragments and fibres independently between sites and species, we only found differences between sites for fibres (F = 13.3, p = 0.0002, R2 = 0.41), while we found differences between sites (F = 20.8, p = 0.0001, R2 = 0.4) and species (F = 5.0, p = 0.0016, R2 = 0.24) for fragments (Tables S3 and S4). Pairwise comparisons found significantly higher PMP fibre abundance at Evans Bay compared to both Shark Bay (p = 0.0003), and Mahanga Bay (p = 0.005) (Table S3). Similarly, for PMP fragments, the highest abundance of PMPs were found at Evans Bay, followed by Mahanga Bay, and Shark Bay (Table S4). We also found a significant difference in PMP fragment abundance between species at Evans Bay (F = 5.4, p = 0.019, R2 = 0.47) and Shark Bay (F = 3.7, p = 0.049, R2 = 0.38) (; Table S4).
Figure 4. The number of PMP fibres, PMP fragments, and PMP totals per gram of sponge tissue pooled across six species at three different sites in the Wellington Harbour. The box size represents the upper and lower quartiles of the data. The middle line shows the median value and the symbol × shows the mean value. The whiskers indicate the variability of the data outside of the interquartile range. Individual data points are shown.
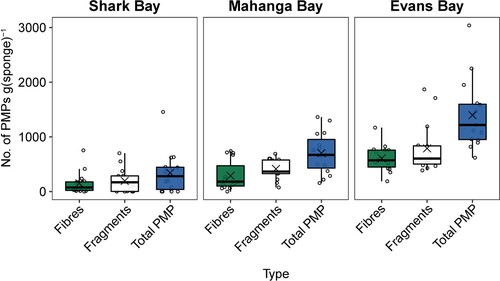
Figure 5. The proportion of PMP fibres (green) and fragments (white) for six sponge species across three sites in Wellington Harbour.
PMPs smaller than 100 µm were generally more abundant than PMPs larger than 100 µm, with some variation between sites (F = 16.03, p = 0.0009) (; Table S2). There was little variation in PMP abundance for particles larger than 100 µm either between site or species (Table S5). In contrast, for PMPs smaller than 100 µm there was a significant effect of site (F = 33.6, p = 0.0001, R2 = 0.53) and species (F = 4.5, p = 0.003, R2 = 0.18) (Table S6). Like other analyses, sponge PMP abundance for particles smaller than 100 µm differed between all sites (p = 0.0003–0.004). Comparing each site independently, we found significant differences in PMP abundance (<100 µm) only at Evans Bay (F = 5.7, p = 0.017, R2 = 0.49) (; Table S6).
Figure 6. Concentration of fibres, fragments, and total PMPs at three sites in Wellington Harbour pooled across six sponge speices, categorised into PMPs under and over 100 µm. The box size represents the upper and lower quartiles of the data. The middle line shows the median value and the symbol × shows the mean value. The whiskers indicate the variability of the data outside of the interquartile range. Individual data points are shown.
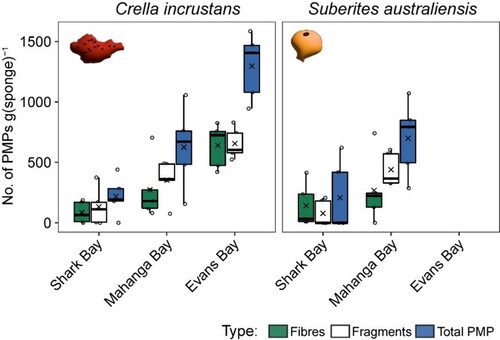
Crella incrustans was the only species sampled across all three sites and we found significant differences in total PMP abundance between sites (F = 21.7, p = 0.0006), with 78% of the variance being explained by site (; Table S2). Pairwise comparisons found significant differences between PMP abundance all sites (F = 7.2–80.5, p = 0.0003–0.013), with the largest difference between Shark Bay and Evans Bay (R2 = 0.82), and the smallest difference between Shark Bay and Mahanga Bay (R2 = 0.29) (Table S2). The highest PMP abundance was found at Evans Bay, followed by Mahanga Bay and Shark Bay (; Table S2). A similar pattern was found for Suberites australiensis, although this species was only sampled at two sites, Shark Bay and Mahanga Bay ()
Figure 7. The total PMP fibres and fragments per gram and the combined total PMPs per gram of sponge tissue for Crella incrustans and Suberites australiensis at three sites in Wellington Harbour. The box size represents the upper and lower quartiles of the data. The middle line shows the median value and the symbol × shows the mean value. The whiskers indicate the variability of the data outside of the interquartile range. Individual data points are shown.
Discussion
We found PMPs in all sponge samples we collected demonstrating for the first time, the potential for PMPs accumulation in southern hemisphere temperate sponges. We sampled six different sponge species across three sites (most sponge species were not sampled at each site), and provide evidence to support that site, rather than species identity, is generally a more important driver of PMP differences. This suggests that PMP accumulation in sponges might be driven more by external microplastic concentrations rather than sponge species identity (noting that we did not measure PMP concentration in the environment). However, further studies of same species across different sites, combined with sampling of ambient water will be needed to confirm these hypotheses.
Spatial variation in PMP accumulation in sponges
We found between 207.83 ± 131.30 and 1893.99 ± 396.52 PMP particles per gram (dry weight) of sponge. In an earlier study, Girard et al. (Citation2021) found that tropical demosponges incorporated between 91 and 612 microparticulate pollutants per gram of tissue (dry weight), although these authors regarded fibres as potential contaminants and therefore did not include them in their analyses. More recently, Soares et al. (Citation2022) compared museum and contemporary specimens of the tropical sponge Cinachyrella alloclada and found many less fragments than our study, although this likely reflects the different methods used. When considering only fragments, we found between 77.56 ± 47.68 and 1208.15 ± 267.23 PMP fragments per gram (dry weight), which is consistent with Girard et al. (Citation2021). In contrast, Fallon and Freeman (Citation2021) found between 6 ± 4 and 169 ± 71 PMP particles per gram (dry weight) in the tropical demosponges they sampled, while Karlsson et al. (Citation2017) found between 25 and 57 MP particles per gram (dry weight). These values are all much lower than in our study and likely represent location-specific differences in where sponges were sampled.
An earlier study of different sites in Wellington Harbour examined MP abundance in beach sediments, mussels, and surface water tows, but only found evidence of spatial variation in MP abundance in beach sediment surveys (Shannon Citation2020). Similarly, another study by Webb et al. (Citation2019) on MP abundance in the green lipped mussel Perna canaliculus in New Zealand (including a site in Wellington Harbour) found no spatial variation, although both the Webb et al. (Citation2019) and Shannon (Citation2020) studies had small sample sizes. In contrast, our study found significant spatial variation, with a significant difference in total PMPs per gram of sponge tissues across all sites, with Evans Bay showing the highest abundance of PMPs. A study on heavy metal pollution in the Wellington Harbour suggested that higher levels of pollutant accumulation in Evans Bay could be attributed to restricted tidal circulation in this area (Stoffers et al. Citation1986) and this may explain the significantly higher PMP numbers at Evans Bay. Evans Bay also had significantly higher PMPs under and over 100 µm and significantly higher PMP fibres and fragments than both other sites. PMP abundance was not significantly different between species at Evans Bay, supporting spatial variation in PMP abundance, rather than species identity being most important for MP uptake. Consistent with our results, Modica et al. (Citation2020) investigated the presence of MPs in sponge specimens from natural history museums and found that MP abundance was not species-specific and could not be explained by any higher taxon-significant relationship. Fallon and Freeman (Citation2021) also found that the amount and size of PMP particle uptake was independent of sponge species. In our study, Crella incrustans was the only species present at all three sites (N = 15) and its PMP abundance was found to be significantly higher in Evans Bay when compared to Shark and Mahanga Bay, which further supports the importance of site over species identity in determining MP abundance in sponges.
An estimated 80% of plastic in the marine environment comes from land-based sources (Andrady Citation2011; Ritchie and Roser Citation2018) suggesting that proximity to urban areas, and therefore wastewater and stormwater outlets may be a driver for MP spatial variation. The Evans Bay site is a more enclosed bay area than the other two sites, is closer to high density developed urban areas, and has over 10 stormwater pipe outlets within one kilometre of the site (). In contrast Shark Bay has one, and Mahanga Bay has two stormwater pipe outlets within one kilometre of our sample site. The proximity to these stormwater outlets may be able to explain the PMP variation between sites, although further research is needed.
PMP size and morphology
Ruffell et al. (Citation2021) found that, consistent with data from wastewater treatment plants in other countries, fragments were the dominant morphotype in wastewater treatment plants in Canterbury to the south of NZ. Another New Zealand study of MPs in green lipped mussels also found that the most common MPs were fragments (Webb et al. Citation2019). The results of our study are consistent with these findings, with fragments being the dominant morphotype at each site and in all species except Suberites australiensis at Shark Bay. Fallon and Freeman (Citation2021) suggested that larger fibres may be able to pass through the sponge ostia through phagocytosis as the fibre widths are very small (∼10 µm) or incorporated through endocytosis into the outer layer of the sponge. Modica et al. (Citation2020) also found long fibres (mean length 2.6 mm) in the sponge samples they analysed. As our samples were rinsed before analysis and fibre abundance numbers are above the control numbers, this would suggest that the larger fibres found in the samples were indeed incorporated into the sponge itself either through phagocytosis or endocytosis. Girard et al. (Citation2021) suggested that sponges uptake particles based on particle spatial variation without preference to particle material and therefore the differences in sizes and morphologies of PMPs within sponge samples may be an indicator of the particle variation in the surrounding seawater. Our results are consistent with this as the size and morphology of PMPs showed little variation between species at the same site suggesting that these sponges do not show PMP particle preference in terms of size or morphology and that uptake is based on particle spatial variation.
Evaluation of methods
Current microplastic sampling techniques in the marine environment have several limitations. The time and cost constraints associated with the collection, the methods of processing, and the analysis of samples act as a bottleneck to the quantification of microplastics in all environments and consequently the number of samples and replicates is generally low (Miller et al. Citation2017; Covernton et al. Citation2019). Our study used a much larger sample size than any other previous study on MP abundance in marine sponges and used comparable methodology to Fallon and Freeman (Citation2021) to facilitate direct comparisons. However, the use of fluorescent microscopy alone has several limitations. Firstly, it is not definitive in its identification of MPs and there is a possibility that non-plastic particles that happened to fluoresce a bright electric blue were included as PMPs. Moreover, it is extremely likely that many more MPs were not included as PMPs (see ) as some plastic types show weak fluorescence (such as darker coloured plastics and PVC), fluoresce different colours, or do not fluoresce at all (Fallon and Freeman Citation2021). However, fluorescent microscopy can identify lighter coloured plastics more easily whereas other visual identification methods often overlook lighter coloured, white, or clear MPs, particularly in smaller particles (<100 µm) (Lusher et al. Citation2020a). The presence of fluorescent properties of organic or mineral matter may hinder the accuracy of MP identification (Prata et al. Citation2022), however this is mitigated as organic matter was eliminated in our methodology by the digestion process before visualisation. Additionally, minerals such as sand grains are generally known to have dull fluorescent properties and therefore were not included as PMPs. Fluorescent microscopy requires less processing than vibrational spectroscopy techniques, such as Raman or FTIR spectroscopy, where the density separation and particle isolation methods may present more opportunities for contamination, MP particle destruction, and require much longer processing times (Möller et al. Citation2020; Lusher et al. Citation2020b; Girard et al. Citation2021; Bai et al. Citation2022; Kiran et al. Citation2022).
Future steps
Sponges play integral roles in many ecosystems and are as ubiquitous in the marine environment as microplastics (Bell Citation2008; Zalasiewicz et al. Citation2016; Bell et al. Citation2020). Although our research indicates that sponges act as quantitative bioindicators of microplastic or microparticulate pollution, there is very little known about the effect that microplastics may have on sponges directly. It is important to establish the extent of the threat that microplastics may pose on different marine organisms, particularly particle feeders whose food is often the same size as plastic particles, and future research should be conducted to elucidate the effect of MPs on the biological functions of sponges. In our study we did not take water samples in the areas surrounding the sponges, which should be included in further studies to assess the variation in the supply of microplastics to sponges. Finally, further research should be conducted to determine whether PMP particle uptake in sponges can be determined by species-specific characteristics, such as ostia or oscula size, and whether sponges exhibit particle preference or if particle uptake is solely dependent on MP spatial variation.
Supplementary Tables
Download MS Word (42.2 KB)Supplemental figures
Download MS Word (247.8 KB)Acknowledgements
All authors contributed to the study conception and design. Material preparation and data collection were performed by Rachel Parry. Fieldwork and data analysis were conducted by Valerio Micaroni and Francesca Strano. The first draft of the manuscript was written by Rachel Parry and James Bell and all authors commented on previous versions of the manuscript. All authors read and approved the final manuscript. No ethics approval was required for this study. All samples were collected under permit from the Ministry of Primary Industries.
Disclosure statement
No potential conflict of interest was reported by the author(s).
Data availability
All data are available on request.
Additional information
Funding
References
- Andrady AL. 2011. Microplastics in the marine environment. Marine Pollution Bulletin. 62:1596–1605. doi:10.1016/j.marpolbul.2011.05.030.
- Andrady AL. 2017. The plastic in microplastics: a review. Marine Pollution Bulletin. 119(1):12–22. doi:10.1016/j.marpolbul.2017.01.082.
- Andrady AL, Rajapakse N. 2019. Additives and chemicals in plastics. Handbook of Environmental Chemistry. 78:1–17. doi:10.1007/698_2016_124/TABLES/4.
- Auta HS, Emenike CU, Fauziah SH. 2017. Distribution and importance of microplastics in the marine environment: a review of the sources, fate, effects, and potential solutions. Environment International. 102:165–176. doi:10.1016/J.ENVINT.2017.02.013.
- Bai CL, Liu LY, Hu Y, Zeng EY, Guo Y. 2022. Microplastics: a review of analytical methods, occurrence and characteristics in food, and potential toxicities to biota. Science of the Total Environment. 806. doi:10.1016/j.scitotenv.2021.150263
- Batista D, Muricy G, Rocha RC, Miekeley NF. 2014. Marine sponges with contrasting life histories can be complementary biomonitors of heavy metal pollution in coastal ecosystems. Environmental Science and Pollution Research. 21(9):5785–5794. doi:10.1007/S11356-014-2530-7.
- Bell JJ. 2008. The functional roles of marine sponges. Estuarine, Coastal and Shelf Science. 79(3):341–353. doi:10.1016/J.ECSS.2008.05.002.
- Bell JJ, McGrath E, Kandler NM, Marlow J, Beepat SS, Bachtiar R, Shaffer MR, Mortimer C, Micaroni V, Mobilia V, et al. 2020. Interocean patterns in shallow water sponge assemblage structure and function. Biological Reviews. 95(6):1720–1758. doi:10.1111/BRV.12637.
- Booth JD. 1984. Movements of packhorse rock lobsters (Jasus verreauxi) tagged along the eastern coast of the north island, New Zealand. New Zealand Journal of Marine and Freshwater Research. 18(3):275–281. doi:10.1080/00288330.1984.9516049.
- Brander SM, Renick VC, Foley MM, Steele C, Woo M, Lusher A, Carr S, Helm P, Box C, Cherniak S, et al. 2020. Sampling and quality assurance and quality control: a guide for scientists investigating the occurrence of microplastics across matrices. Applied Spectroscopy. 74(9):1099–1125. doi:10.1177/0003702820945713.
- Brennecke D, Duarte B, Paiva F, Caçador I, Canning-Clode J. 2016. Microplastics as vector for heavy metal contamination from the marine environment. Estuarine, Coastal and Shelf Science. 178:189–195. doi:10.1016/j.ecss.2015.12.003.
- Bridson JH, Patel M, Lewis A, Gaw S, Parker K. 2020. Microplastic contamination in Auckland (New Zealand) beach sediments. Marine Pollution Bulletin. 151. doi:10.1016/j.marpolbul.2019.110867
- Celis-Hernández O, Ávila E, Ward RD, Rodríguez-Santiago MA, Aguirre-Téllez JA. 2021. Microplastic distribution in urban vs pristine mangroves: using marine sponges as bioindicators of environmental pollution. Environmental Pollution. 284:117391. doi:10.1016/J.ENVPOL.2021.117391.
- Covernton GA, Pearce CM, Gurney-Smith HJ, Chastain SG, Ross PS, Dower JF, Dudas SE. 2019. Size and shape matter: a preliminary analysis of microplastic sampling technique in seawater studies with implications for ecological risk assessment. Science of the Total Environment. 667:124–132. doi:10.1016/J.SCITOTENV.2019.02.346.
- de Bhowmick G, Sarmah AK, Dubey B. 2021. Microplastics in the NZ environment: current status and future directions. Case Studies in Chemical and Environmental Engineering. 3:100076. doi:10.1016/J.CSCEE.2020.100076.
- de Marchi L, Renzi M, Anselmi S, Pretti C, Guazzelli E, Martinelli E, Cuccaro A, Oliva M, Magri M, Bulleri F. 2022. Polyethylene microplastics reduce filtration and respiration rates in the Mediterranean sponge Petrosia ficiformis. Environmental Research. 211:113094. doi:10.1016/J.ENVRES.2022.113094.
- Dickinson WW, Dunbar GB, McLeod H. 1996. Heavy metal history from cores in Wellington Harbour, New Zealand. Environmental Geology. 27(1):59–69. doi:10.1007/BF00770603.
- Fallon BR, Freeman CJ. 2021. Plastics in Porifera: the occurrence of potential microplastics in marine sponges and seawater from Bocas del Toro, Panamá. PeerJ. 9:e11638. doi:10.7717/PEERJ.11638/SUPP-5.
- Fossi MC, Marsili L, Baini M, Giannetti M, Coppola D, Guerranti C, Caliani I, Minutoli R, Lauriano G, Finoia MG, et al. 2016. Fin whales and microplastics: The Mediterranean Sea and the Sea of Cortez scenarios. Environmental Pollution. 209:68–78. doi:10.1016/J.ENVPOL.2015.11.022.
- Gago J, Galgani F, Maes T, Thompson RC. 2016. Microplastics in seawater: recommendations from the marine strategy framework directive implementation process. Frontiers in Marine Science. 3:219. doi:10.3389/FMARS.2016.00219/BIBTEX.
- Gambarini V, Pantos O, Kingsbury JM, Weaver L, Handley KM, Lear G. 2021. Phylogenetic distribution of plastic-degrading microorganisms. Msystems. 6:1. doi:10.1128/MSYSTEMS.01112-20/SUPPL_FILE/REVIEWER-COMMENTS.PDF.
- Girard EB, Fuchs A, Kaliwoda M, Lasut M, Ploetz E, Schmahl WW, Wörheide G. 2021. Sponges as bioindicators for microparticulate pollutants? Environmental Pollution. 268. doi:10.1016/j.envpol.2020.115851
- Helson JG, Gardner JPA. 2004. Contrasting patterns of mussel abundance at neighbouring sites: does recruitment limitation explain the absence of mussels on Cook Strait (New Zealand) shores? Journal of Experimental Marine Biology and Ecology. 312(2):285–298. doi:10.1016/j.jembe.2004.07.006.
- Hidalgo-Ruz V, Gutow L, Thompson RC, Thiel M. 2012. Microplastics in the marine environment: a review of the methods used for identification and quantification. Environmental Science and Technology. 46(6):3060–3075. doi:10.1021/es2031505.
- Isobe A, Iwasaki S, Uchida K, Tokai T. 2019. Abundance of non-conservative microplastics in the upper ocean from 1957 to 2066. Nature Communications. 10:1. doi:10.1038/S41467-019-08316-9.
- Karlsson TM, Vethaak AD, Almroth BC, Ariese F, van Velzen M, Hassellöv M, Leslie HA. 2017. Screening for microplastics in sediment, water, marine invertebrates and fish: method development and microplastic accumulation. Marine Pollution Bulletin. 122(1–2):403–408. doi:10.1016/J.MARPOLBUL.2017.06.081.
- Kiran BR, Kopperi H, Venkata Mohan S. 2022. Micro/nano-plastics occurrence, identification, risk analysis and mitigation: challenges and perspectives. Reviews in Environmental Science and Biotechnology. 21(1):169–203. doi:10.1007/S11157-021-09609-6/TABLES/3.
- Kokalj AJ, Hartmann NB, Drobne D, Potthoff A, Kühnel D. 2021. Quality of nanoplastics and microplastics ecotoxicity studies: refining quality criteria for nanomaterial studies. Journal of Hazardous Materials. 415:125751. doi:10.1016/J.JHAZMAT.2021.125751.
- Kurniawan SB, Abdullah SRS, Imron MF, Ismail N. 2021. Current state of marine plastic pollution and its technology for more eminent evidence: a review. Journal of Cleaner Production. 278:123537. doi:10.1016/J.JCLEPRO.2020.123537.
- Löder MGJ, Gerdts G. 2015. Methodology used for the detection and identification of microplastics – a critical appraisal. Marine Anthropogenic Litter. 201–227. doi:10.1007/978-3-319-16510-3_8/FIGURES/7.
- Lusher AL, Bråte ILN, Munno K, Hurley RR, Welden NA. 2020a. Is it or isn’t it: the importance of visual classification in microplastic characterization. Applied Spectroscopy. 74(9):1139–1153. doi:10.1177/0003702820930733.
- Lusher AL, Munno K, Hermabessiere L, Carr S. 2020b. Isolation and extraction of microplastics from environmental samples: an evaluation of practical approaches and recommendations for further harmonization. Applied Spectroscopy. 74(9):1049–1065. doi:10.1177/0003702820938993.
- Markic A, Niemand C, Bridson JH, Mazouni-Gaertner N, Gaertner JC, Eriksen M, Bowen M. 2018. Double trouble in the South Pacific subtropical gyre: increased plastic ingestion by fish in the oceanic accumulation zone. Marine Pollution Bulletin. 136:547–564. doi:10.1016/J.MARPOLBUL.2018.09.031.
- Miller ME, Kroon FJ, Motti CA. 2017. Recovering microplastics from marine samples: a review of current practices. Marine Pollution Bulletin. 123(1–2):6–18. doi:10.1016/J.MARPOLBUL.2017.08.058.
- Modica L, Lanuza P, García-Castrillo G. 2020. Surrounded by microplastic, since when? Testing the feasibility of exploring past levels of plastic microfibre pollution using natural history museum collections. Marine Pollution Bulletin. 151:110846. doi:10.1016/J.MARPOLBUL.2019.110846.
- Möller JN, Löder MGJ, Laforsch C. 2020. Finding microplastics in soils: a review of analytical methods. Environmental Science and Technology. 54(4):2078–2090. doi:10.1021/ACS.EST.9B04618/SUPPL_FILE/ES9B04618_SI_001.PDF.
- Mora-Teddy AK, Matthaei CD. 2020. Microplastic pollution in urban streams across New Zealand: concentrations, composition and implications. New Zealand Journal of Marine and Freshwater Research. 54(2):233–250. doi:10.1080/00288330.2019.1703015/.
- Oksanen J, Kindt R, Legendre P, O’Hara B, Stevens MHH, Oksanen MJ, Suggests MASS. 2007. The vegan package. Community Ecology Package. 10(631-637):719.
- Oliver MD. 2011. Wellington Harbour subtidal sediment quality monitoring : results from the 2011 survey. Greater Wellington Regional Council. ISBN 9781927217344.
- Perea-Blazquez A, Davy SK, Bell JJ. 2012. Estimates of particulate organic carbon flowing from the pelagic environment to the benthos through sponge assemblages. PLoS One. 7(1):e29569.
- Prata JC, Castro JL, da Costa JP, Cerqueira M, Duarte AC, Rocha-Santos T. 2022. Airborne microplastics. In: Handbook of microplastics in the environment. p. 177–201. doi:10.1007/978-3-030-39041-9_37
- Prokić MD, Radovanović TB, Gavrić JP, Faggio C. 2019. Ecotoxicological effects of microplastics: examination of biomarkers, current state and future perspectives. TrAC – Trends in Analytical Chemistry. 111:37–46. doi:10.1016/j.trac.2018.12.001.
- R Core Team. 2013. R: a language and environment for statistical computing.
- Reiswig HM. 1971. Particle feeding in natural populations of three marine demosponges. The Biological Bulletin. 141(3):568–591. doi:10.2307/1540270.
- Richardson CR, Burritt DJ, Allan BJ, Lamare MD. 2021. Microplastic ingestion induces asymmetry and oxidative stress in larvae of the sea urchin Pseudechinus huttoni. Marine Pollution Bulletin. 168:112369.
- Ritchie H, Roser M. 2018. Plastic pollution. Published online at OurWorldInData.org. https://ourworldindata.org/plastic-pollution [Online Resource].
- Ruffell H, Pantos O, Northcott G, Gaw S. 2021. Wastewater treatment plant effluents in New Zealand are a significant source of microplastics to the environment. New Zealand Journal of Marine and Freshwater Research. doi:10.1080/00288330.2021.1988647.
- Saliu F, Biale G, Raguso C, La Nasa J, Degano I, Seveso D, Galli P, Lasagni M, Modugno F. 2022. Detection of plastic particles in marine sponges by a combined infrared micro-spectroscopy and pyrolysis-gas chromatography-mass spectrometry approach. Science of The Total Environment. 819:152965. doi:10.1016/J.SCITOTENV.2022.152965.
- Shannon C. 2020. Spatial & temporal patterns of microplastic pollution in Wellington, New Zealand, and the Southern Ocean. MSc thesis. Victoria University of Wellington.
- Soares GM, Barros F, Lanna E, da Silva MVS, Cavalcanti FF. 2022. Sponges as libraries: increase in microplastics in Cinachyrella alloclada after 36 years. Marine Pollution Bulletin. 185:114339.
- Stephenson G, Milne JR, Sorensen P. 2008. Wellington harbour marine sediment quality investigation. Environmental monitoring and investigations. Wellington, New Zealand: Greater Wellington Regional Council.
- Stoffers P, Glasby GP, Wilson CJ, Davis KR, Walter P. 1986. Heavy metal pollution in Wellington harbour. New Zealand Journal of Marine and Freshwater Research. 20(3):495–512. doi:10.1080/00288330.1986.9516169.
- Sutton R, Mason SA, Stanek SK, Willis-Norton E, Wren IF, Box C. 2016. Microplastic contamination in the San Francisco Bay, California, USA. Marine Pollution Bulletin. 109(1):230–235. doi:10.1016/J.MARPOLBUL.2016.05.077.
- Tiseo I. 2022. Global plastic production 1950–2020 | Statista. Statista. https://www.statista.com/statistics/282732/global-production-of-plastics-since-1950/.
- Wear RG, Gardner JPA. 2001. Biological effects of the toxic algal bloom of February and March 1998 on the benthos of Wellington Harbour, New Zealand. Marine Ecology Progress Series. 218:63–76. doi:10.3354/MEPS218063.
- Webb S, Gaw S, Marsden ID, McRae NK. 2020. Biomarker responses in New Zealand green-lipped mussels Perna canaliculus exposed to microplastics and triclosan. Ecotoxicology and Environmental Safety. 201:110871. doi:10.1016/J.ECOENV.2020.110871.
- Webb S, Ruffell H, Marsden I, Pantos O, Gaw S. 2019. Microplastics in the New Zealand green lipped mussel Perna canaliculus. Marine Pollution Bulletin. 149:110641. doi:10.1016/J.MARPOLBUL.2019.110641.
- Wickham H. 2016. Ggplot2: Elegant graphics for data analysis. New York: Springer-Verlag. ISBN 978-3-319-24277-4, https://ggplot2.tidyverse.org.
- Zalasiewicz J, Waters CN, Ivar do Sul JA, Corcoran PL, Barnosky AD, Cearreta A, Edgeworth M, Gałuszka A, Jeandel C, Leinfelder R, et al. 2016. The geological cycle of plastics and their use as a stratigraphic indicator of the Anthropocene. Anthropocene. 13:4–17. doi:10.1016/J.ANCENE.2016.01.002.