
ABSTRACT
The compact city is globally acknowledged as the most adequate urban model to encourage sustainable urban development. Its validity is often assumed, despite the lack of clarity on what such compactness entails. The knowledge gap is even wider regarding how different drivers and pressures influence the development of more compact cities. Therefore, the authors analyse indirect and underlying processes (drivers) and more direct events, actions, and processes (pressures) affecting compact city development. Since compact city driving forces are extensively influenced by local situations, their research focused on district-level case studies within the compact city of Barcelona Municipality. Mixed methods were used, and the authors used both qualitative and quantitative data. The results revealed that drivers and pressures can both support and counteract compact city qualities and therefore any intervention has to be tailored to local conditions. In particular, the results of the in-depth analysis of local pressures and their progression over time foster an understanding of context-related nuances, thereby shifting attention from taken-for-granted compact city qualities to the driving forces that produce beneficial compactness. The authors conclude that the diversity of drivers and pressures requires the involvement of a multiplicity of stakeholders and actors in urban planning, implementation, and management.
Introduction
The concept of the compact city is globally acknowledged in both research and policy as the preferred urban pattern to be applied to present and future cities (EU Citation2007; European Commission Citation2011; Hofstad Citation2012; UN-Habitat Citation2012). Nevertheless, the concept is too often taken for granted and its definition remains unclear and non-uniform (Churchman Citation1999; Burton Citation2002; Neuman Citation2005). This not only affects the understanding of compact city qualities (Boyko & Cooper Citation2011), but also becomes even more significant when the different driving forces behind compact city development are examined (Holman et al. Citation2015). In response to this vagueness, in this paper we explore urban driving forces, divided into indirect/underlying processes (drivers) and more direct events, actions, and processes (pressures), and their diverse consequences for compact city development. Despite previous research on development drivers (Christiansen & Loftsgarden Citation2011; Zondag & Borsboom Citationn.d.), it remains uncertain how such drivers impinge on compact cities, and what degree of influence and types of pressure they exert. Therefore, the objectives of this paper are:
To identify drivers that indirectly encourage compact city patterns
To understand how such drivers are linked to pressures with a direct influence on such urban development.
In relation to the extensive debate on the pros and cons of compact cities (Neuman Citation2005; Boyko & Cooper Citation2011; Holman et al. Citation2015), and since the focus is on urban driving forces not urban qualities, we assume that compact city development is mainly beneficial but we acknowledge that there are also many problematic aspects.
Literature review
From its origins, the compact city as a concept has been referred to as an ideal model of city (Dantzig & Saaty Citation1973). It has become an established concept through an extensive body of scientific literature (Jenks et al. Citation1996; Churchman Citation1999; Dieleman & Wegener Citation2004; Boyko & Cooper Citation2011; Westerink et al. Citation2013) and there is a clear predominance of positive views on the compact city (Moliní & Salgado Citation2012). According to Hofstad (Citation2012, 2), the compact city has ‘emerged as the preferred response to the goal of sustainable development’ in recent decades. Still, the features of a compact city are not univocally defined in the literature (Neuman Citation2005). In this paper, we adopt a wide understanding of urban compactness, in which intensity and diversity in land use and functions are seen potentially to lead to improved mobility, resource use, social equity, social diversity, economy, and green spaces (Boyko & Cooper Citation2011).
By contrast, the academic literature on compact city driving forces is relatively limited. Although there are articles on driving forces leading to urban sprawl (e.g. Salvati & Sabbi Citation2014; Marraccini et al. Citation2015), the literature on driving forces linked to urban compactness is scarce. Furthermore, driving forces are typically discussed in quite general and unspecific terms referring to macro-scale processes, such as urbanization pressures, climate and climate change, energy scarcity, economic growth, and growing or declining populations (OECD Citation2012; Li et al. Citation2017; Pili et al. Citation2017). The compact city is thus typically idealized and dogmatized (Holman et al. Citation2015), but without exploring the driving forces supporting its implementation. Such idealization is also favoured by the fact that the concept is heavily endorsed by international institutions such as the UN, the EU, and the OECD, all of which promote compact city policies (European Commission Citation2011; OECD Citation2012; UN-Habitat Citation2012).
However, some authors adopt a more explicit city-scale perspective to analyse compact city driving forces. Metzger et al. (Citation2015) highlight that such forces are exerted by the public administrative sector and by the private entrepreneurial field. At the institutional level, local politicians are considered the most relevant driving force, for two reasons. First, local politicians aspire to obtain tax revenues from a creative class that is searching for ‘a vibrant city life of small shops and cafés’ (Tunström & Bradley Citation2015, 82). Second, they associate the efficiency of concentrated infrastructure with economies of scale. This institutional perspective on compact city driving forces is shared by Dijkink & Knippenberg (Citation2001), who highlight the role of Dutch institutions in promoting compact city policies to limit welfare-state expenditures by creating a mix of welfare state cities and entrepreneurial cities. Metzger et al. (Citation2015) consider that the main driving force in the private sector is developers, who are willing to maximize their profits by constructing high-rise and dense buildings in attractive areas. This understanding is shared by Brueckner (Citation2011).
The above-mentioned perspective mainly relates to the supply side, represented by institutions and developers. However, an important feature of urban driving forces is that they act from both the supply and demand sides, sometimes simultaneously (Gray Citation2007). From the demand perspective, Vilà (Citation2014) examines the role of neighbourhood associations in promoting social equity in Barcelona, and Barrios & Rodriguez (Citation2008) explore home buyers’ preferences for multifamily dwellings in Spanish large cities. Walks (Citation2015) connects compact city development with gentrification and considers affluent populations as a key driving force. By outcompeting other social tiers, the demand of the high-income population for central locations contributes not only to densification, but also to the privatization of such areas. Morikawa (Citation2011) and Rosenthal & Strange (Citation2004) clearly adopt an economic point of view, in their analyses of the relationship between service industry productivity and urban population density. In this sense, the service industry acts as a compact city driving force by demanding population agglomeration. From an urban green structure position, Artmann (Citation2013) shows how different sociodemographic conditions (population size, household size, living space, population age, and number of private cars) can be linked to soil sealing.
Although above-mentioned examples are relevant and valuable, the current literature on compact city driving forces is not sufficiently consolidated, which led us to formulate the two research questions presented in the Introduction. Since it is not possible to extract a reliable list of the driving forces from the literature, knowledge development needs to be supported by empirical research based on inductive and pragmatic approaches.
Analytical framework and research questions
An analytical framework has been developed with inspiration from the driving forces, pressures, states, impacts, responses (DPSIR) model, that was originally introduced by the European Environment Agency (European Environment Agency Citation1999) and is a causal chain model inspired by earlier similar models used by, for example, the OECD (Hammond et al. Citation1995) and the United Nations (UN Citation1996). Although DPSIR has not been exempt from criticism (Niemeijer & De Groot Citation2008), it has been found useful for exploring casual relationships between driving forces and land use change (Tscherning et al. Citation2012). Since land use change is a core issue in compact city development, the DPSIR model provides a sound basis for structuring the wide array of driving forces as dynamic drivers and pressures that impact on static compact city qualities. This is vital in order to avoid ending up with a set of non-specific driving forces, as has often been the case in previous studies.
The analytical efforts presented in this paper focus on the drivers and pressures in the DPSIR model. Since the focus of the study is not on compact city qualities – the states and impacts in the DPSIR model – the drivers and pressures are merely linked indirectly to compact city qualities in the form of a rationale (). The responses of the DPSIR model are not applied to the analysis.
Table 1. Links between drivers and pressures relating to Barcelona as a compact city, formulated as dynamic quantitative proxy indicators capturing evolution over time, with the rationale for a respective pressure provided in terms of effects on compact city development
Taking into account the diversity of definitions of the term ‘driving forces’ in literature citing the DPSIR model (European Environment Agency Citation1999; Dávila Cabanillas Citation2007; Kristensen Citationn.d.), the most suitable definition for our research is the one adopted by the United Nations, which considers drivers are ‘indirect’ or ‘underlying’ driving forces related ‘to fundamental processes in society’ (United Nations Environment Programme Citation2007, 22), whereas pressures are referred to as more direct and therefore have more tangible impacts (UN Citation2014). Applied in this way, the analytical framework is consistent with the objectives of this paper, as it allows us to respond to the following research questions:
Which drivers affect compact city development?
Which associated pressures affect compact city development?
What has been the recent evolution of the drivers and pressures?
What are the desired future trends in drivers and pressures?
Methods
Drawing on the United Nations Environment Programme (UNEP) (United Nations Environment Programme Citation2007) and Cronshaw & McCullock (Citation2008), the indirect character of driving forces requires a localized and inductive case study approach to allow for collection of data and analysis. The local scale plays an essential role, for two reasons. First, the insufficient depth of literature on compact city driving forces hinders the extraction of drivers and pressures from literature by means of a deductive or theoretical process. Second, our literature review shows that local contexts have a remarkable influence on drivers and pressures. In consequence, if the few comprehensive papers that deal with the compact city drivers and/or pressures are used to categorize drivers or pressures, the results would be weakly substantiated and potentially biased. This would also be the case if a list of drivers and pressures were constructed on the basis of papers in which a partial perspective on specific issues is adopted. Therefore, inductive analysis and extraction of concepts from local case studies is fundamental. Understanding compact city drivers and pressures from empirical case study provides a higher degree of solidity and consistency, thereby acknowledging that using the same research process with reference to a different context could provide a different result.
Methodological steps
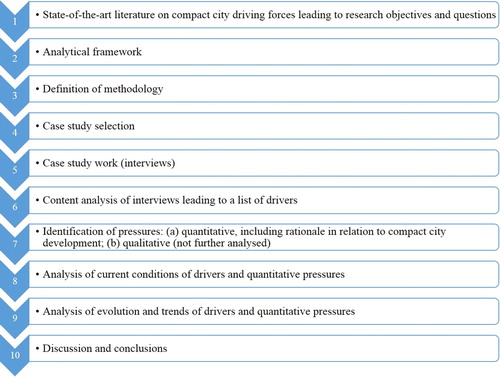
Since local contexts can be expected to present specific types of drivers and pressures, the overall approach was inductive and based on interviews. Based on the premise described above, consistency was prioritized over universalization, and the research structure and methodological steps were defined with this in mind (). The initial steps comprised the review of the literature (the state-of-the-art literature on compact city driving forces leading to limits and scope of research), development of the analytical framework, and definition of method. As a next step, Barcelona, a prototype of the European Mediterranean compact city, was identified as a case study, following the rationale explained in the next subsection (‘Barcelona as a case study’). The analysis of the case material was divided into four parts, respectively linked to the four research questions: (1) content analysis of interviews, which led to a list of drivers; (2) identification of pressures; (3) analysis of the recent evolution of drivers and pressures based on statistical data; and (4) analysis of the desired future trends of drivers and pressures.
Fig. 1. Research structure
Barcelona as a case study
Barcelona is considered a typical example of a European Mediterranean city historically associated with a compact urban development (Busquets Citation2005). The exemplary character of Barcelona planning within the compact city debate is evident. For example, Bohigas (Citation2005) (cited by Capel Citation2006, 1, translation from Spanish) has identified the principal strengths of the Barcelona planning model as the ‘reconstruction of the city instead of its expansion’ and its ‘compactness and urban continuity opposed to suburbanization’ (our translation). However, such ideas refer to Barcelona Municipality, since at the metropolitan scale Barcelona has clearly been affected by urban sprawl (Muñoz Citation2004; Garcia-López & Muñiz Olivera Citation2007) undermining its reputation as a compact city.
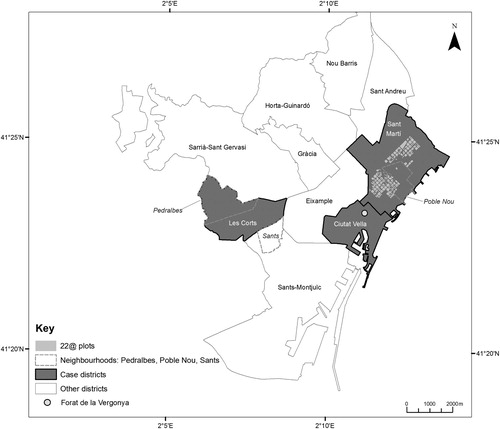
With regard to different scales and types of planning (e.g. metropolitan or strategic planning), the Barcelona model has been embroiled in a critical discussion concerning its validity (Marshall Citation2000). Since the purpose of this article is to avoid general and unspecific perceptions of urban driving forces, the local scale is both crucial and ideal. Dempsey & Jenks (Citation2010, 120) argue that ‘discussions of the compact city may no longer be appropriate’ and instead focus on a ‘city of compact neighbourhoods’. We focus on three districts in Barcelona Municipality, which in different ways represent Barcelona as a compact city: Ciutat Vella, the historical dense city centre; Les Corts, an ordinary part of the city that was densified mainly during the second half of the 20th century; and Sant Martí, which is currently being reconstructed and densified as part of Barcelona’s rebirth as smart city based on the knowledge economy ().
Fig. 2. The three case study districts in Barcelona and other locations (based on GIS layers from Barcelona Municipality (Ajuntament de Barcelona Citationn.d.b) and the Spanish National Centre of Geographic Information (Centro Nacional de Información Geográfica Citationn.d.)
The selected cases were not intended to be exhaustive but to provide diversified local-based insights into a complex phenomenon. The case districts served two main purposes in relation to the research design. First, during the interviews, referring to specific localities was helpful for ensuring that the conversations were more directed and specific; some of the interviewees were linked to one of the case areas in different ways. Second, the analysis of both the recent evolution and desired trends in compact city pressures (i.e. in the value of the proxy indicators) in three different districts facilitated an understanding of how drivers are manifested differently in different localities within the same city.
Ciutat Vella, the oldest part of Barcelona, has been characterized by a degraded housing stock for many decades. In the 1990s, it accommodated a wave of immigrants, attracted by low rents paid for abandoned or soon-to-be demolished flats. As highlighted by Scarnato (Citation2006, 170) ‘between 1988 and 2002, 2.147 [2147] buildings of Ciutat Vella have been rehabilitated (49%) while less than 500 have been destroyed in order to give to the district around 10 ha of free public space’. However, the demolition work generated strong protests and community struggles, with the area of Forat de la Vergonya as a symbol of civil resistance against speculation and top-down decision-making processes (Anguelovski Citation2014). Due to its historically dense and mixed-use character, we considered Ciutat Vella a perfect case study for compact city analysis.
Les Corts, in the north-west part of Barcelona Municipality, was originally a separate village (Ajuntament de Barcelona Citation2000), but was later incorporated into the municipality, and as a result its mixed-use character was preserved in the old part of the city and its surroundings. Beside its historical nucleus Les Corts, the district includes the high-income neighbourhood of Pedralbes and the Barcelona football stadium Camp Nou, and it is adjacent to the lower middle-class neighbourhood of Sants in Sant-Montjuïc District (Moreno Citation1993). Despite its reputation as an expensive area, Les Corts maintains a certain mix in terms of housing and population.
The district of Sant Martí contains historical areas, such as the Poble Nou housing neighbourhood and the industrial area 22@Barcelona, ‘Catalan Manchester’, which is undergoing conversion to a mixed-use technological district (Ajuntament de Barcelona Citation2011). The redevelopment of the 22@ area is a symbol of Barcelona’s branding as ‘smart city’ and an example of the clustering of advanced information and communications technology (ICT) companies and the promotion of an urban knowledge economy (Muñiz & Garcia-López Citation2010). However, as a result of the economic crisis in Spain, the development process has slowed down, potentially to the benefit of a more mixed and inclusive urban environment.
Interviews
The case study research started with a series of interviews to collect data to facilitate the extraction of a list of compact city drivers (indirect and/or underlying processes) from the qualitative information. In total, 26 in-depth, semi-structured interviews were held with local stakeholders who had different profiles (). The interviews were held in Barcelona between September 2014 and February 2016. The interviewees were selected to cover a diverse range of categories of urban actors in the social, institutional, professional, economic and academic sectors. They functioned as knowledgeable participants who had observed and experienced their city as a compact city for a long time, and they were asked to reflect on drivers and pressures based on those observations and experiences. The interviews were carried out in locations convenient for the interviewees, for example in their office, in their home, or in a public venue. Each interview took between 30 minutes and 1.5 hours.
Table 2. Profiles of interviewees
The interviewees were briefly provided with a definition of the compact city and were then asked the following questions, which were designed to approach the topic of drivers and pressures from multiple angles:
How can you obtain (or have obtained) compact city qualities? (actions)
Which subjects and/or actors act and/or interact to obtain such qualities? (actors)
Why do the actors perform such actions? (reason and/or motivation)
In case any quality is missing, how can you obtain it and what actors should intervene?
The interviews were recorded to enable precise analysis of the collected interview material.
Analysis of collected data
The first step in the analysis of the collected data was to code the rich material from the interviews and identify different types of drivers linked to compact city development. Additionally, the frequency with which different drivers were mentioned was noted, based on whether they were talked about in an interview (i.e. not by counting how many times they were mentioned within one interview). However, since that part of the study was qualitative and not grounded in statistics, all mentioned drivers were included in the subsequent analysis, regardless of their frequency.
As a second analytical step, two lists of pressures (more direct events, actions, and processes) were developed. Further content analysis and coding of the interviews revealed a list of more than 150 pressures described in a qualitative manner, but these are not discussed further in this paper, since many of them would be difficult to measure statistically and thus less useful for the purpose of the paper. However, they deserve to be analysed in depth and be presented in another paper. The focus of this paper is instead on a second list of pressures derived from the list of drivers, including particularly relevant issues found in the first list of qualitative pressures, but here defined in quantitative terms.
As the second list of pressures is quantifiable, it can also be seen as a list of proxy indicators for different types of drivers – indicators that may measure direct events, actions, or processes resulting from the more indirect drivers. The list of quantitative pressures (or indicators) was defined according to principles of measurability, the availability of data, and the usefulness of the data for capturing the pressures on Barcelona as a compact city through statistical parameters. They were also linked to purported compact city qualities (). Considering the complexity of the compact city concept, the definition of which is ambiguous, the list was not intended to be exhaustive but rather to explore issues emerging from the inductive analytical process.
The third step in the analysis was to establish the recent evolution of drivers and pressures based on the collected statistical data. A starting year was determined for each indicator, which varied from one indicator to another, given that data were only be available for specific time series (). Despite the different time series available for the selected indicators, having a starting year was key for understanding the conditions, already in place, in which the pressures act. Statistical data were then used to map the evolution of pressure, and implicitly the evolution of the driver ( and ). The data were accessed from various Internet sources provided by Barcelona Municipality, with the exception of water consumption data that were provided by the Fundación Aquae.
Table 3. Proxy indicators as quartiles at the starting year for the three districts, including evaluation of the situation at the starting year (Q1 = low, Q2 = medium low, Q3 = medium high, Q4 = high. Evaluation: positive ++, rather positive +, rather negative -, and negative --)
Table 4. Evolution of proxy indicators expressed through quantitative proxy indicators for the three case districts in Barcelona
Table 5. Comprehensive iconographic matrix of urban indicators
Since the metrics for different indicators did not use the same units, each quantitative value was translated into quartiles to place all indicators on a comparable scale regarding their starting values and evolution. The quartiles indicated the relative high or low positioning of a given indicator for a district in relation to all districts in Barcelona. The following codification was used for the classification of indicators values as quartiles: Q1 (low level), Q2 (medium-low level), Q3 (medium-high level), and Q4 (high level). Both a low level and a high level can be either positive or negative, depending on the positive (e.g. green areas per inhabitant) or negative (e.g. water consumption) significance of each indicator.
The fourth and final analytical step was aimed at exploring the desired trend of each quantitative indicator, taking into account the dynamic character of drivers and pressures. By comparing the initial value of indicators with their evolution, it became possible to provide recommendations for the future desirable trend of indicators (increasing, decreasing, or stabilizing) (). The desired trend depended on the initial status and evolution of each indicator in relation to the aspired compact city development. Since this perspective was an integral part of the analysis of gathered material, the approach is described in more detail in the subsection ‘Initial situation of compact city pressures and drivers’.
Empirical results and analysis
Qualitative study: indirect drivers affecting compact city development
The content analysis of the interviews provided the following categories of drivers, which the interviewees regarded as having positive consequences on the creation of Barcelona as a compact city: social culture; urban planning and policy; market economy; historical settlement processes; immigration; technology and economy of innovation; culture and heritage; ageing population; education; and environmental considerations and risks. The first two categories (social culture and urban planning and policy) were the most frequently mentioned categories in the interviews (22 and 18 times respectively), while the last category (environmental considerations and risks) was only mentioned once. Furthermore, economic crisis and tourism were considered as drivers having both positive and negative effects on the compact city. However, we decided to include them in our driving force analysis, despite acknowledging their ambivalent value. One of the mentioned drivers – technology and economy of innovation – was later omitted from the quantitative analysis because no up-to-date and reliable quantitative indicators were found.
Quantitative study: direct and locally specific pressures affecting compact city development
The second part of the analysis resulted in a list of dynamic pressures that that can be expressed as the evolution of quantitative proxy indicators and for which useful data were available (). The analysis focused specifically on the drivers list derived from the interviews (see the preceding subsection) in the sense that each pressure or indicator is linked to a specific driver. The rationale for each indicator in relation to its effect on compact city development is described in .
Initial situation of compact city pressures and drivers
The first step of the third analytical effort was the establishment of an initial situation in a given year, described using quartiles (explained in the subsection ‘Analysis of collected data’), as well as an evaluation of whether that situation was positive or negative in relation to the rationale described in . A summary of the data and evaluation of each indicator is presented in , which shows how the pressures, and implicitly the drivers, affect the three case districts. In the following subsections ‘Social culture’ to ‘Tourism’, which contain detailed descriptions of how the pressures and indicators link to the drivers, the value of the indicators is primarily described using quartiles (as explained in the subsection ‘Analysis of collected data’), and only showing numeric values where needed for clarity.
Social culture
Social culture is a multifaceted driver, represented by proxy indicators connected to concepts of diversity, wealth, gentrification, and social participation or demand. Ethnic diversity was measured through an entropy index used ‘for identifying spatial units that are completely homogenous (inhabited by only one population group, H2 = 0) or maximally diversified (all population groups are equal in size, H2 = 1)’ (Apparicio et al. Citation2014, 3), where H2 denotes the entropy index in the article by Apparicio et al. Within the three case districts, the initial value of this index, measured in 2004, was relatively low, especially in Les Corts (0.11; Q 1) (see for quartiles for all indicators) and Sant Martí (0.12; Q2). Ciutat Vella had a higher degree of diversification (0.38; Q4), which probably stemmed from its historical character, central localization, and tradition of hosting immigrants.
Wealth was measured through an income index, which measured the average disposable income per capita within households. Such an index is not merely a wealth indicator as it also tracks signs of gentrification when analysed over time. In our study, it was compared with the value for the entire municipality of Barcelona (Barcelona base value = 100). In 2010, two of the three districts, Ciutat Vella (75.2; Q1) and Sant Martí (85.4; Q3) were below the municipal value, while Les Corts, traditionally inhabited by the upper middle class, had a much higher value (140.7; Q4).
Social participation and demand was explored by means of municipal assistance in activities organized by local civic centres, for which data were available from 2014, as well as the district’s percentage of citizen complaints to the municipal government, with the starting year 2011. The former appears to have been relatively high in all three districts, especially in Ciutat Vella and Sant Martí (Q4), and to a lesser extent in Les Corts (Q3). By contrast, the district’s percentage of citizen complaints to the municipal government had a Q4 value in Sant Martí (14.1% of total complaints in Barcelona) and lower levels (Q2) in Ciutat Vella and Les Corts. Although social complaints may be perceived as a sign of problematic situations, they may also generate a positive outcome, in accordance with Vilà (Citation2014), who underlines the role of community action in shaping Barcelona’s neighbourhoods and improving its quality of life.
Social diversity was represented through the entropy index and the standard deviation (a measure of dispersal within a distribution) of purchasing prices for second-hand housing within the districts, thus excluding new constructions). Such standard deviations in second-hand housing prices within districts constitute another social diversity indicator (data available from 2011), and in this regard Les Corts remained in the top quartile (Q4), since the district had a mix of middle-class apartments with luxury single-family homes (in the Pedralbes neighbourhood) and compratively lower middle-class housing close to Sants, the working-class neighbourhood around Barcelona’s main train station. Sant Martí, too, was relatively highly ranked in the quartile distribution (Q3), while Ciutat Vella was positioned within the second quartile Q2.
Urban planning and policy
Among urban planning and policy indicators, the most representative indicators at district level were the presence of pedestrian priority areas and the availability of green areas (m2) per inhabitant. Walkability is a desired characteristic of the compact city (Talen & Koschinsky Citation2013). There were more pedestrian-friendly areas in Ciutat Vella (Q4, year 2010), as is common in historical centres, than in Les Corts (Q3) and Sant Martí (Q1). As expected, the historical centre had a medium-low (Q2, year 2010) level of green areas per inhabitant, while both Les Corts and Sant Martí had a relatively high level (Q4).
Market economy
Market economy was analysed through the floor area of economic activities in 2010. For historical reasons, having an industrial past and a technologically oriented present, Sant Martí was positioned in the top quartile (Q4), while Ciutat Vella and Les Corts had Q3 and Q2 values, respectively.
Historical settlement processes
From the interviews, it became apparent that the implementation of the compact city ideal might be easier in older urban areas than in newer ones, since cities were compact and dense historically. Also, historical areas tend to be more dense and diverse as a result of their emergent character (Lim & Kain Citation2016). For our case districts, statistics at the district level showed the percentage of dwellings built before 1960 and still existing in 2010. Ciutat Vella included a very high percentage of such dwellings (84.4%; Q4), while for Sant Martí the corresponding figure was 27.9% (Q2), affected by its more industrial and less residential tradition as well as transition to brownfield sites. Les Corts was within the bottom quartile (18.7%, Q1), due to its more recent history, with the exception of its small historical nucleus.
Immigration
Immigration was examined through the percentage of the non-Spanish population in each district, the immigration rate, the entropy index (already mentioned for driving force above and therefore omitted here), and the rental price for retail space. The latter was selected because the interviewees highlighted how immigrants took over a part of the local retail trade during the economic crisis, taking advantage of the opportunity to rent retail spaces at relatively low prices. As expected, the percentage of non-Spanish population in the starting year 2010 was much higher in Ciutat Vella (40.5%; Q4) than in Les Corts (11.1%; Q1) and Sant Martí (15.2%; Q3). The immigration rate, seen as the increase in population resulting from immigration, clearly related to the percentage of foreigners and confirmed our expectations for Ciutat Vella (Q4 in 2010) but not for Les Corts (Q3) and Sant Martí (Q2). The rental price for retail space (EUR per m2) was selected from 2007 as the initial year to obtain a five-year evolution of this indicator because prices for very recent years were not available. With regard to this indicator, the historical centre of Ciutat Vella, with a high tourism appeal, remained in quartile Q4, the upper middle class district of Les Corts in Q3, and the multifaceted Sant Martí, with the old Poble Nou neighbourhood and the recently renewed 22@ area, in Q2.
Culture and heritage
Culture and heritage are extremely complex urban issues. Since regeneration and renewal were underlined as prominent aspects in the interviews, the selected proxy indicator was related to the municipal programmed ‘Barcelona posa’t guapa’ (‘Barcelona become beautiful’) leading to the restoration of several building facades. Interestingly, among the three districts, Sant Martí had the highest number of restored facades in 2010 (24; Q3) compared with Ciutat Vella (16; Q1) and Les Corts (13; Q1). However, it should be borne in mind that the renewal process in the historical centre started much earlier than in Sant Martí (Scarnato Citation2006) and that this indicator only pertained to a specific public-led programme.
Ageing population
Ageing populations are a global phenomenon and they require ‘access to local services without the need of a car’ (OECD Citation2012, 43). From this perspective, ‘compact cities ideas … provide the promise of an approach for making cities more liveable for an ageing population’ (Sorensen Citation2010, 129). The ageing index, measured for year 2010 as the number of persons over the age of 65 years per 100 persons under the age of 15 years, showed a clear contrast between Les Corts (Q4) and the other two case districts, both of which were in the lowest quartile (Q1).
Education
From the interviews, education emerged as a key factor for social integration. At the early educational stages (i.e. pre-school) integration is usually easier: ‘facilitating social participation in preschool is a little easier than it is in elementary schools because teachers are less bound by mandatory curricula’ (Ramsey Citation2015, 158). The percentage of foreigners in pre-school in 2010 was quite significant in Ciutat Vella (30.9%; Q4), and much less significant in Les Corts (3.1%; Q1) and Sant Martí (6.4%; Q3).
Environmental considerations and risks
Shortage of environmental resources, such as water and oil, was identified in the interviews as a driver for change that reorients the attitudes of citizens towards a more responsible use of them. Previous research by Domene et al. (Citation2005) showed the critical importance of the sustainable use of water in the metropolitan area of Barcelona (Àrea Metropolitana de Barcelona). For our study, the only available data at the district scale was domestic water consumption in terms of litres per capita, measured from 2007 onwards. Ciutat Vella had a relatively low level of consumption (interval Q1 of the quartile distribution), while the other two districts both had higher levels of consumption: Les Corts (Q4) consumed even more than Sant Martí (Q2).
Economic crisis
Despite its ambiguous and often negative connotations, an economic crisis may have positive effects on cities. For instance, it was identified by the interviewees as an element of change that restructured public policies towards a more socially and economically sustainable approach in Barcelona. The interviews also revealed how an economic crisis may lead to housing that is more affordable, to social diversity, and to diversification of activities and retail managers’ profiles (e.g. local retail being sustained by immigrants). Besides the price for retail space and the income index, already discussed above with reference to other drivers, two more indicators were used: second-hand housing prices (EUR per m2) and economic effort (dwelling price related to family income), both examined in 2010. With regard to the former, Les Corts stood out as one of the most expensive districts (4.91 EUR/m2; Q4) in Barcelona, followed by Sant Martí (3.64 EUR/m2; Q3) and the less expensive Ciutat Vella (3.43 EUR/m2; Q2). The economic effort of households was highest in Les Corts (21.2; Q4), lower but still within the top quartile in Ciutat Vella (13.8; Q4), and medium-high in Sant Martí (12.5; Q3).
Tourism
In Barcelona, tourism has emerged as a problematic issue but also as a phenomenon with positive consequences, such as generating incomes and encouraging street cleaning. In 2010, Ciutat Vella had the highest number of hotel beds (18,575; Q4) of all Barcelona districts. Sant Martí had half the value of Ciutat Vella, but still maintained a high level (9679; Q4), while Les Corts had the lowest value of the three case districts (6022; Q3).
Evaluation of pressures
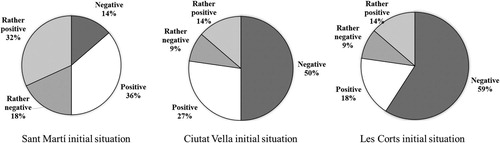
From the data presented in , it became possible to evaluate the situation at the starting year for the three case districts. The evaluation took into account that a low or high quartile could be positive or negative, depending on the positive or negative significate of the indicator in relation to the rationales described in . Comparison of the three districts indicated that Sant Martí had a far better initial situation than Ciutat Vella and Les Corts ().
Fig. 3. Initial situation of the three districts; percentages of positive, rather positive, negative, and rather negative starting points in relation to compact city development
Evolution of compact city pressures and drivers
Once the situation at the starting year was established for all indicators, the next step was to calculate their evolution and how the evolution leads to desired future trends. All indicators were examined over an ideal period of five years. The evolution of the proxy indicators was calculated in three different ways (). When the indicator was measured by a percentage (e.g. percentage of foreigners) or per thousand (e.g. immigration rate), the evolution was calculated with a difference of values (Diff.). If the indicator was represented by an absolute value (i.e. m2 of economic activity) or a simple ratio (e.g. economic effort), its evolution was calculated through its percentage variation in the specified period. A specific case was represented by the number of restored facades, the evolution of which was simply a cumulative sum of restorations because the indicator showed high yearly variations and, for this reason, a five-year difference or percentage variation would not be representative. In some cases, a longer period had to be used in order for the differences to be, identified and other cases a shorter period had to be used when data were lacking. Some indicators showed a more substantial variation through the years than did others ().
The desired future trends in compact city pressures and drivers
Establishing the evolution of the different pressures facilitated our understanding of how the evolution occurred in relation to desired trends. In this regard, desired trends should be seen exclusively as tentative recommendations for the future, not as definitive outlooks. The trends were defined by taking the following situations into account:
In some cases, indicators displayed a positive quality (i.e. in the entropy index, municipal assistance in local activities, pedestrian-priority areas, green areas per inhabitant, square metres of economic activity, percentage of dwellings built before 1960). Therefore, their increase or maintenance at a high level was always desirable.
In other cases, the indicators revealed a negative phenomenon (i.e. percentage of citizen complaints per district, water consumption, economic effort) that needed to be reduced.
Since a compact city should be based on a balanced urban model (Jenks et al. Citation1996), the desired trend aimed to balance the value of the district with the other city districts. For example, income indexes that are too high or too low can be signs of excessive social homogeneity (Taylor & Fry Citation2012).
It may be the case that an excessive or continuous change observed in the evolution of an indicator is not positive. For example, if retail or housing prices continue to decrease, it will not be positive for the economy (Bank for International Settlements Citation2005), and therefore such trends need to be stopped or inverted.
Regarding tourism, the interviewees considered the desired trend as positive for the economy but considered that when it was excessive it impinged on the daily lives of local residents, caused crowding, and resulted in an increase in illegally rented tourist apartments. Therefore, a further increase in the trend would not be accepted by inhabitants.
With the aim of improving the clarity of the findings, the numeric indicator values for the evaluation of the initial situation () were converted into shades (). This analytical approach was built on the comprehensive iconographic matrix of urban indicators developed by Franchini & Dal Cin (Citation2000), and led to the creation of a summarizing table in which the colour gradient ranges from white to dark grey denoted an initial positive, rather positive, rather negative, or negative situation (). For the evolution of pressures (), the indicators were represented as arrow symbols, indicating whether the evolution represented an increase, decrease, or unchanging situation (). The subsequent analysis of desired trends was illustrated in the same way with arrow symbols (), but in that case recommending whether an increase, decrease, or unchanging trend was preferred. For example, this meant that if the evolution represented an increase, a stable arrow symbol for the desired trend meant that it would be beneficial if the increase levelled off.
In the following subsections, the considerations linked to the elaboration of desired future trends are explained in more detail in relation to each pressure and indicator.
Social culture
The entropy index is seen as positive because it is an expression of social diversity in terms of country of origin, not of class. Therefore, it should be kept at high levels, as social diversity is a desired compact city quality (Jenks et al. Citation1996). In order to avoid social homogenization or segregation, the income index should not have too high or too low district values (Taylor & Fry Citation2012). However, we do not have sufficient data to confirm social class diversification, therefore this issue needs further research. The level of municipal assistance in local activities should always be aimed at increasing, as a sign of social participation. By contrast, the percentage of citizen complaints, although being an expression of social demand leading to potential improvement in the initial situation, may reflect problematic conditions. Hence, a high percentage of citizen complaints within a district is not positive. Lastly, the standard deviation for second-hand housing prices should be maintained at reasonably high level, to provide a district with different housing options.
Urban planning and policy
Both indicators should be kept at a high level for cities such as Barcelona, which are already relatively dense. Barcelona Municipality detected a lack of vacant land in the city but ideally was inclined towards an increase in green areas, if not quantitatively, then at least qualitatively (Barcelona City Council Citation2013). Such a qualitative dimension would take into account ‘connectivity (green corridors), the uniqueness of Barcelona’s green spaces (e.g. façades, rooftops), along with other characteristics typical of urban green spaces’ (Barcelona City Council Citation2013, 13).
Market economy
Following the content analysis of the interviews and supported by literature relating to the concepts of development and vitality (e.g. Zhou Citation2012), market economy is considered an expression of development and vitality. In relation to the former, the interviewees considered that speculation was a pressure stemming from the market economy driver and leading to building densification. Nevertheless, since the housing market and affordability have been affected by a serious housing market crisis in recent years, such aspects are examined in the subsection ‘Economic crisis’. With regard to vitality, Zhou (Citation2012) argues that economic vitality is an essential component of urban vitality. Nevertheless, compact cities have to avoid single-use developments (i.e. developments exclusively for business use or residential use). Therefore, a reflection on the residential or non-residential orientation of the case districts in Barcelona is worthy of special attention. Data from Barcelona City Council showed that c.50% of cadastral units were used for housing in each of the three districts in 2010 (51.7% in Ciutat Vella; 47.4% in Les Corts; 56.3% in Sant Martí). In order to have a balanced model, economic activity needs to be maintained at a relatively high level. As the evolution has been positive, the desired trend aims at a situation of stabilization in Ciutat Vella and Sant Martí, both of which were already highly positioned in 2010 (Q3 and Q4), and an increase in Les Corts, which was initially in a medium-low quartile (Q2).
Historical settlement processes
According to the interviewees, it was easier to find elements of compact and mixed-use developments in the historical centre than in the non-historical areas of cities such as Barcelona and in areas with a distinctive historical past. The only available indicator in the case is the presence of buildings constructed before 1960. The indicator’s evolution may produce minimum changes, associated with the development of new buildings on vacant land or brownfield sites, but the percentage of old buildings is not likely to decrease significantly. The desired trend is the maintenance of old buildings as a general rule, especially those of historical significance. This process can be directly linked to the indicator used for culture and heritage (i.e. the number of restored facades).
Immigration
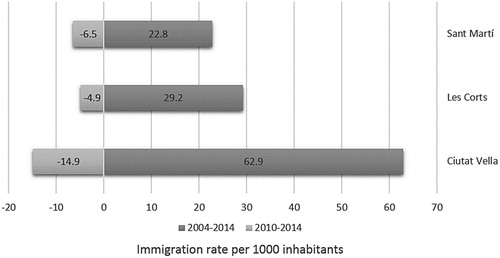
The achievement of a balanced number (i.e. neither too high nor too low) of immigrants is recommendable. In 2014, the end year of the evolution period related to the percentage of foreign nationals, Ciutat Vella still had a high proportion of immigrants (42.4%), which was triple the average proportion for Barcelona (16.3%). By contrast, the proportions were lower than average for the city in Sant Martí (15.0%) and Les Corts (10.8%). However, evolution of the immigration rate over 5 year was quite different compared with 10 years (), as the most recent years were affected by the Spanish economic crisis. The difference is especially notable in the case of Ciutat Vella. The purpose of this paper is not to establish what might be an optimal share of immigrants, as this would need significant further research. Nevertheless, if social and ethnic diversity are considered qualities of compact cities, social homogenization and segregation should be avoided. Moreover, according to the OECD (Citation2014), the human capital of immigrants exerts a positive influence on economic growth.
Fig. 4. Immigration rate per 1000 inhabitants; difference in a period of 5 years and in a period of 10 years (based on data accessed from Ajuntament de Barcelona Citationn.d.c)
The entropy index should ideally be high as a measure of diversification and should be maintained at high levels in the future. According to Fieldhouse & Cutts (Citation2010), although diversity can generate difficulties in sharing social norms, it will eventually have a positive impact on community cohesion. In relation to the rental price of retail space, and considering that relatively low prices have already favoured an increase in shops managed by immigrants in the cast districts of Barcelona, it should probably be maintained as it is because excessively low prices will not be profitable if they have a negative impact on the property industry, banks, and loan concessions (Bank for International Settlements Citation2005). An exception is Ciutat Vella, where it might be acceptable for exceedingly high rental prices to fall in the future.
Culture and heritage
The desired trend for restoring the facades of buildings is linked with ‘historical settlement process’, and therefore the indicator for ‘culture and heritage’ has to be maintained as always positive.
Ageing population
According to the OECD (Citation2012), an ageing population is a key trend associated with the need for compact cities, as elderly populations require accessibility to local facilities within walking distance. Nevertheless, the trend also generates problematic effects on municipal revenue, economic growth, and public spending (OECD Citation2015), and an excessively or too rapidly ageing population would be difficult to manage. Therefore, a balanced pattern of ages is the desired trend for the future.
Education
The goal for non-Spanish children at pre-school is for balanced numbers (i.e. neither too high nor too low), in order to avoid social segregation. While acknowledging that social diversity in pre-schools has a short-term positive impact on cognitive development and a long-term influence on the promotion of social equity (Reid & Kagan Citation2015), previous research has shown that racial and ethnic diversity should be considered a quality in pre-schools (Reid Citation2016).
Environmental considerations and risks
This is an example of a negative indicator with respect to water consumption and a decrease in the indicator is preferable, unless it is already as low as in Ciutat Vella, where stabilization is desirable to avoid affecting the quality of life of the inhabitants. Although other environmental indicators related to emissions, waste generation, and energy consumption were not available at the district level, we assume that a continuous decrease in emissions, waste generation, and energy consumption is desirable.
Economic crisis
Second-hand housing prices decreased during the period 2010–2014, especially in Les Corts (-15%). However, prices may still be too high in that district since, according to more recent statistics (Idealista Citation2016), prices have recovered ().
Table 6. Second-hand housing purchase prices in the third trimester of 2016, with variation referred to maximum price (Source: Idealista Citation2016, 29)
Since the recovery of housing prices can simultaneously be beneficial for the economy and less positive for families, such a trend should be compared with the economic effort to purchase new housing (average selling price of new dwellings related to average household income per year). Based on the most recent data (i.e. from 2013), Barcelona City Council’s district report sheds a light on the issue (Ajuntament de Barcelona Citationn.d.a). In Les Corts, the effort required in 2013 (7.2 years of the average household income in the district needed to buy a dwelling) was lower compared with the average value for Barcelona as a whole (9.9 years). In Ciutat Vella, the combination of a medium-low income level and an increase in new housing prices produced a higher economic effort (12.8 years) than the average value for Barcelona. In Sant Martí, the value was equivalent to 11.3 years of family income. Such values could mean that in Les Corts, families could still afford an increase in prices, while in the other two districts the effort is still too high.
Tourism
In all three case districts, there was a high or fairly high number of hotel beds in 2010 and the numbers continued to increase between 2010 and 2014. Considering the ambiguously positive and negative value of tourism for compact city qualities, the recommendation for the future is a stabilization or decrease, although this may not be easy to achieve considering Barcelona’s strong orientation towards tourism. However, in 2017, Barcelona City Council approved a plan to establish a cap on the amount of tourist accommodation in the city (LaGrave Citation2017).
Conclusions
The principal purpose of this paper has been to shed light on the indirect drivers and direct pressures that influence the development of a compact city at the local scale, focusing on Barcelona as case study and three districts in particular. First, our analysis has revealed a high level of complexity regarding both drivers and pressures, since they belong to a wide range of categories and result from the occurrence of diverse processes at multiple levels. Moreover, we have shown how drivers and pressures can both support and counteract urban compactness (in its wide meaning), and therefore any intervention has to be carefully tailored according to local conditions and evolution and/or trends.
Second, the importance assigned to the local scale, represented by the district level in this paper, facilitated our focused and in-depth analysis of local pressures. Such local character allowed for an understanding of nuances and avoided banalization and superficiality. For instance, the interviewees from the three districts highlighted certain aspects of compact cities, such as social diversity and equity, yet such qualities are normally downplayed in the literature in favour of physical or built-environment related qualities of compact cities, such as mobility.
Third, the choice of three different districts as case studies enabled us to underline their main strengths (e.g. social diversity in Ciutat Vella, a functioning housing market in Les Corts, and balanced ethnic diversity in Sant Martí) and their main weaknesses (e.g. low incomes in Ciutat Vella, scarce pedestrian priority areas in Les Corts, and low citizen satisfaction in Sant Martí), which were derived from the indicators in extremely high (Q4) or low (Q1) positions (). The selected three case districts have also shown the importance of understanding the localized progression of such pressures over time (i.e. from recent history to the near future). An improved understanding of and strategizing in relation to locally relevant pressures (and counter-pressures) that impact on aspired compact city development patterns thus become key activities, that would enable the attention on taken-for-granted compact city qualities to be shifted to the driving forces that lead to such compactness. Such a concrete analysis of pressures at the local scale may thus provide decision-makers with a better orientation of local policies. In this sense, the approach taken in this article is strategically important for local stakeholders involved in urban planning, governance, and management.
Fourth, we have observed how the diversity of drivers and pressures, as well as the heterogeneous definition of a compact city, requires a multiplicity of stakeholders and actors to be involved in the planning, implementation, and management of a compact city. Such a vision promotes a broad interpretation of planning, which should not exclusively be in the hands of conventional planning practitioners (e.g. architects, engineers) but should also include a variety of urban stakeholders.
Fifth, and finally, from a scholarly point of view, it is mandatory to acknowledge the limits of our study, as its progression relied on the availability of district-scale proxy indicators. Since local-scale indicators are not exhaustive, they should be taken as a result of the selective choice of drivers performed by the interviewees. In order to achieve a more complete analysis of drivers and pressures, further research is recommended, including a qualitative study of pressures to fill in the gaps left by quantitative analysis. Nevertheless, although it is not possible to generalize from the results, it is still helpful to compare them with similar situations or studies in other cities, as certain aspects are likely to transcend the local dimension. For example, certain features, such as the presence of tourism, are more present in Ciutat Vella as the historical core of the city. However, the tourism question has assumed citywide proportions and has become central in recent planning and policy decisions in Barcelona. A more proactive stance vis-à-vis this pressure would have been instrumental to avoid the current negative consequences of this type of ‘compactness’. Such lessons seem to be valuable also for cities in earlier stages of their itineraries towards a tourist-based economy.
ORCID
Marco Adelfio http://orcid.org/0000-0003-1865-9471
Jaan-Henrik Kain http://orcid.org/0000-0001-8838-099X
References
- Ajuntament de Barcelona. 2000. El nucli antic: Les Corts Velles. Barcelona: Ajuntament de Barcelona.
- Ajuntament de Barcelona. 2011. 22@ Barcelona: 10 anys de renovaciò urbana/10 Years of Urban Renewal. Barcelona: Ajuntament de Barcelona.
- Ajuntament de Barcelona. n.d.a. Observatori de districtes. Barcelona: Ajuntament de Barcelona. http://www.bcn.cat/estadistica/catala/documents/districtes/index.htm (accessed 30 March 2016).
- Ajuntament de Barcelona. n.d.b. Cartobcn. http://w20.bcn.cat/cartobcn/ (accessed 30 March 2016).
- Ajuntament de Barcelona. n.d.c. Estadísyica. http://estadistica.bcn.cat/ (accessed 30 March 2016).
- Anguelovski, I. 2014. Neighbourhood as Refuge: Community Reconstruction, Place Remaking, and Environmental Justice in the City. Cambridge, MA: MIT Press.
- Apparicio, P., Martori, J.C., Pearson, A.L., Fournier, É. & Apparicio, D. 2014. An open-source software for calculating indices of urban residential segregation. Social Science Computer Review 32(1), 117–128.
- Artmann, M. 2013. Driving forces of urban soil sealing and constraints of its management – the Cases of Leipzig and Munich (Germany). Journal of Settlements and Spatial Planning 4(2), 143–152.
- Bank for International Settlements. 2005. Real Estate Indicators and Financial Stability. BIS Papers No. 21. https://www.bis.org/publ/bppdf/bispap21.pdf (accessed November 2018).
- Barcelona City Council. 2013. Indicators 21: Local Sustainability Indicators in Barcelona (Data from 2012). Barcelona: Barcelona City Council.
- Barrios, J.A. & Rodriguez, J.E. 2008. Housing demand in Spain according to dwelling type: Microeconometric evidence. Regional Science and Urban Economics 38(4), 363–377.
- Bohigas, O. 2005 El model Barcelona segons Horacio Capel. Avui, 8 May 2005, 21.
- Boyko, C.T. & Cooper, R. 2011. Clarifying and re-conceptualising density. Progress in Planning 76(1), 1–61.
- Brueckner, J.K. 2011. Lectures on Urban Economics. Cambridge, MA: MIT Press.
- Burton, E. 2000. The compact city: Just or just compact? A preliminary analysis. Urban Studies 37(11), 1969–2006.
- Burton, E. 2002. Measuring urban compactness in UK towns and cities. Environment and Planning B: Planning and Design 2002, 29(1), 219–250.
- Busquets, J. 2005. Barcelona: The Urban Evolution of a Compact City. Rovereto: Nicolodi & Cambridge, MA: Harvard University, Graduate School of Design.
- Capel, H. 2006. De nuevo el modelo Barcelona y el debate sobre el urbanismo barcelonés. Universidad de Barcelona (eds.) Biblio 3W. Revista Bibliográfica de Geografía y Ciencias Sociales 9(629). http://www.ub.edu/geocrit/b3w-629.htm (accessed November 2018).
- Centro Nacional de Información Geográfica. n.d. Centro des Cargas. (accessed November 2018).
- Christiansen, P. & Loftsgarden, T. 2011. Drivers Behind Urban Sprawl in Europe. TØI Report 1136. https://www.toi.no/getfile.php/1317329/Publikasjoner/T%C3%98I%20rapporter/2011/1136-2011/1136-2011-el.pdf (accessed October 2018).
- Churchman, A. 1999. Disentangling the concept of density. Journal of Planning Literature 13(4), 389–411.
- Cronshaw, S. & McCulloch, A. 2008. Reinstating the Lewinian vision: From force field analysis to organization field assessment. Organization Development Journal 26(4), 89–103.
- Dantzig, G. & Saaty T. 1973. Compact City: Plan for a Liveable Urban Environment. San Francisco: W. H. Freeman.
- Dávila Cabanillas, N. 2007. La aplicación del modelo DPSIR al área funcional de Gernika-Markina (Bizkaia): Un ensayo metodológico de análisis territorial. https://old.reunionesdeestudiosregionales.org/cdromleon2007/htdocs/pdf/p1.pdf (accessed November 2018).
- Dempsey, N. & Jenks, M. 2010. The future of the compact city. Built Environment 36(1), 116–121.
- Dieleman, F. & Wegener, M. 2004. Compact city and urban sprawl. Built Environment 30(4), 308–323.
- Dijkink, G. & Knippenberg, H. 2001. The Territorial Factor: Political Geography in a Globalising World. Amsterdam: Vossiuspers UvA [Amsterdam University Press].
- Domene, E., Saurí, D. & Parés, M. 2005. Urbanization and sustainable resource use: The case of garden watering in the metropolitan region of Barcelona. Urban Geography 26(6), 520–535.
- EU. 2007. Leipzig Charter on Sustainable European Cities. Final draft (2 May 2007). http://ec.europa.eu/regional_policy/archive/themes/urban/leipzig_charter.pdf (accessed November 2018).
- European Commission. 2011. Cities of Tomorrow – Challenges, Visions, Ways Forward. Luxembourg: Publications Office of the European Union.
- European Environment Agency. 1999. Environmental Indicators: Typology and Overview. EEA Technical report No 25/1999. Copenhagen: European Environment Agency-
- Fieldhouse, E. & Cutts. D. 2010. Does diversity damage social capital? A comparative study of neighbourhood diversity and social capital in the US and Britain. Canadian Journal of Political Science–Revue Canadienne de Science Politique 43(2), 289–318.
- Franchini, T. & Dal Cin, A. 2000. Indicadores urbanos y sostenibilidad: Hacia un umbral sostenible del uso del suelo. Ciudad y Territorio 32(123), 41–55.
- Garcia-López, M.A. & Muñiz Olivera, I. 2007. ¿Policentrismo o dispersión? Una aproximación desde la nueva economía urbana. Investigaciones Regionales 11, 25–43.
- Gray, R.N. 2007. Residential Intensification and the Wellington Urban Development Strategy. Wellington: Wellington City Council.
- Hammond, A., Adriaanse, A., Rodenburg, E., Bryant, D. & Woodward, R. 1995. Environmental Indicators: A Systematic Approach to Measuring and Reporting on Environmental Policy Performance in the Context of Sustainable Development. Washington DC: World Resources Institute.
- Hofstad, H. 2012. Compact city development: High ideals and emerging practices. European Journal of Spatial Development. Refereed article No. 49. http://archive.nordregio.se/Global/EJSD/Refereed%20articles/refereed49.pdf (accessed October 2018).
- Holman, N., Mace, A., Paccoud, A. & Sundaresan, J. 2015. Coordinating density: Working through conviction, suspicion and pragmatism. Progress in Planning 101 (October 2015), 1–38.
- Idealista. 2016. Evolución del precio de la vivienda de segunda mano. Tercer Trimestre 2016. http://www.idealista.com/informes-precio-vivienda (accessed July 2017).
- Jenks, M., Burton, E. & Williams, K. (eds.) 1996. The Compact City: A Sustainable Urban Form? London: Spon.
- Kristensen, P. n.d. The DPSIR Framework. https://wwz.ifremer.fr/dce/content/download/69291/913220/file/DPSIR.pdf (accessed November 2018).
- Lagrave, K. 2017. Barcelona Approves New Law to Limit Tourist Numbers. http://www.cntraveler.com/story/barcelona-approves-new-law-to-limit-tourist-numbers (accessed 3 March 2017).
- Li, H., Peng, J., Yanxu, L. & Yi’na, H. 2017. Urbanization impact on landscape patterns in Beijing City, China: A spatial heterogeneity perspective. Ecological Indicators 82, 50–60.
- Lim, H.K. & Kain, J.H. 2016. Compact cities are complex, intense and diverse but: Can we design such emergent urban properties? Urban Planning 1(1), 95–113.
- Marraccini, E., Debolini, M., Moulery, M., Abrantes, P., Bouchier, A., Chéry, J.-P., Sanz Sanz, E., Sabbatini, T. & Napoleone, C. 2015. Common features and different trajectories of land cover changes in six Western Mediterranean urban regions. Applied Geography 62, 347–356.
- Marshall, T. 2000. Urban planning and governance: Is there a Barcelona model? International Planning Studies 5, 299–319.
- Metzger, J., Allmendinger P. & Oosterlynck, S. 2015. Planning Against the Political: Democratic Deficits in European Territorial Governance. London: Routledge.
- Moliní, F. & Salgado, M. 2012. Los impactos ambientales de la ciudad de baja densidad en relación con los de la ciudad compacta. Universidad de Barcelona. (eds.) Biblio 3W. Revista Bibliográfica de Geografía y Ciencias Sociales 17 (958). http://www.ub.edu/geocrit/b3w-958.htm (accessed 24 January 2018).
- Moreno, L. 1993. Social Exchange and Welfare Development. Madrid: CSIC.
- Morikawa, M. 2011. Economies of density and productivity in service industries: An analysis of personal service industries based on establishment-level data. Review of Economics and Statistics 93(1), 179–192.
- Muñiz, I. & Garcia-López, M.A. 2010. The polycentric knowledge economy in Barcelona. Urban Geography 31(6), 774–799.
- Muñoz, F. 2004. UrBANALització: La producció residencial de baixa densitat a la provincia de Barcelona, 1985-2001. PhD thesis. Department of Geography, Universitat Autònoma de Barcelona. Barcelona: Universitat Autònoma de Barcelona.
- Niemeijer, D. & De Groot, R. 2008. Framing environmental indicators: Moving from causal chains to causal networks. Environment, Development and Sustainability 10(1): 89–106.
- Neuman, M. 2005. The compact city fallacy. Journal of Planning Education and Research 25, 11–26.
- OECD. 2012. Compact City Policies, A Comparative Assessment, OECD Green Growth Studies. Paris: OECD Publishing.
- OECD. 2014. Is Migration Good for the Economy? OECD Migration Policy Debates (MPD No. 2, May 2014). http://www.oecd.org/els/mig/OECD%20Migration%20Policy%20Debates%20Numero%202.pdf (accessed October 2018).
- OECD. 2015. Ageing in Cities. Paris: OECD Publishing.
- Oelefse, M. 2003. Social justice, social integration, and the ccompact city: Lessons from the inner city, Johannesburg. Harrison, P., Huchzermeyer. M. & Mayekiso. M. (eds.) Confronting Fragmentation: Housing and Urban Development in a Democratizing Society, 88–108. Landsdown: UCT Press.
- Pili, S., Grigoriadis, E., Carlucci, M., Clemente, M. & Salvati, L. 2017. Towards sustainable growth? A multi-criteria assessment of (changing) urban forms. Ecological Indicators 76, 71–80.
- Ramsey, P.G. 2015. Teaching and Learning in a Diverse World: Multicultural Education for Young Children. 4th ed. New York: Teachers College Press.
- Rani, W.M. 2015. Compact urban form for sociability in urban neighbourhoods. International Journal of Social Science and Humanity 5(10), 822–826.
- Reid, J. 2016. Racial/ethnic diversity and language development in the pre-school classroom. Frankenberg, E., Garces, L. & Hopkins, M. (eds.) Integration Matters: Research-based Strategies to Advance Equity, 39–55. New York: Teachers College Press.
- Reid, J.L. & Kagan, S.L. 2015. A Better Start: Why Classroom Diversity Matters in Early Education. https://files.eric.ed.gov/fulltext/ED571023.pdf (accessed November 2018).
- Rosenthal, S.S. & Strange W. 2004. Evidence on the nature and sources of agglomeration economies. Vernon Henderson, J. & Thisse, J.-F. (eds.) Handbook of Regional and Urban Economics. Vol. 4: Cities and Geography, 2119–2171. Amsterdam: Elsevier.
- Saaty, T.L. 2013. Compact City: The Next Urban Evolution in Response to Climate Change. Pittsburg, PA: RWS Publications.
- Salvati, L. & Sabbi, A. 2014. Identifying urban diffusion in compact cities through a comparative multivariate procedure. The Annals of Regional Science 53, 557–575.
- Scarnato, A. 2006. Multiple exposures or new cultural values? European historical centres and recent immigration fluxes. Monclús, J. & Guardia, M. (eds.) Culture, Urbanism and Planning, 165–178. London: Routledge.
- Sorensen, A. 2010. Urban sustainability and compact city ideas in Japan. Healey, P. & Upton, R. (eds.) Crossing Borders: International Exchange and Planning Practices, 117–140. Abingdon and New York: Routledge.
- Talen, E. & Koschinsky, J. 2013. The walkable neighborhood: A literature review. International Journal of Sustainable Land Use and Urban Planning 1(1), 42–63.
- Taylor, P. & Fry, R. 2012. The Rise of Residential Segregation by Income. Pew Research Center Report. http://www.pewresearch.org/wp-content/uploads/sites/3/2012/08/Rise-of-Residential-Income-Segregation-2012.2.pdf (accessed October 2018).
- Tillie, N., Aarts, M., Marijnissen, M., Stenhuijs, S., Borsboom, J., Rietveld, E., Doepel, D., Visschers, J. & Lap, S. 2012. Rotterdam: People Make the Inner City. Rotterdam: Mediacenter Rotterdam.
- Tscherning, K., Helming, K., Krippner, B., Sieber, S. & Gomez y Paloma, S. 2012. Does research applying the DPSIR framework support decision making? Land Use Policy 29, 102–110.
- Tunström, M. & Bradley, K. 2015. Opposing the postpolitical Swedish urban discourse. Metzger, J., Allmendinger, P. & Oosterlynck, S. (eds.) Planning Against the Political: Democratic Deficits in European Territorial Governance, 69–84. Abingdon: Routledge.
- UN. 1996. Indicators of Sustainable Development: Framework and Methodologies. New York: UNCSD.
- UN. 2014. Global Biodiversity Outlook 4: A Mid-term Assessment of Progress Towards the Implementation of the Strategic Plan for Biodiversity 2011–2020. Secretariat of the Convention on Biological Diversity. ISBN- 92-9225-540-1. https://www.cbd.int/gbo/gbo4/publication/gbo4-en-hr.pdf (accessed October 2018).
- UN-Habitat. 2012. Urban Patterns for a Green Economy: Leveraging Density. https://unhabitat.org/wp-content/uploads/2014/06/Leveraging-Density-Urban-Patterns-for-a-Green-Economy.pdf (accessed 18 October 2018).
- UNESCO. 2016. Culture Urban Future. Paris. United Nations Educational, Scientific and Cultural Organization.
- United Nations Environment Programme. 2007. Global Environment Outlook: Environment for Development, GEO 4. https://na.unep.net/atlas/datlas/sites/default/files/GEO-4_Report_Full_en.pdf (accessed October 2018).
- Vilà, G. 2014. From residents to citizens: The emergence of neighbourhood movements in Spain. Gallent, N. & Ciaffi, D. (eds.) Community Action and Planning: Contexts, Drivers and Outcomes, 59–75. Bristol: Policy Press.
- Walks, A. 2015. The Urban Political Economy and Ecology of Automobility. New York: Routledge.
- Westerink, J., Haase, D., Bauer, A., Ravetz, J., Jarrige, F. & Aalbers, C.B.E.M. 2013. Dealing with sustainability trade-offs of the compact city in peri-urban planning across European city regions. European Planning Studies 21(3), 473–497.
- Zhou, J. 2012. Urban Vitality in Dutch and Chinese New Towns: A Comparative Study between Almere and Tongzhou. Architecture and the Built Environment 2012:3. PhD thesis. Delft: Urbanism Department, Faculty of Architecture, Delft University.
- Zondag, B. & Borsboom, J. n.d. Driving Forces of Land-use Change. http://www.significance.nl/papers/2009-ERSA-Driving-forces-of-land-use-change.pdf (accessed November 2018).