
Abstract
The Kilowatt Reactor Using Stirling TechnologY (KRUSTY) was a prototypic nuclear-powered test of a 5-kW(thermal) Kilopower space reactor. This paper presents results from the KRUSTY warm critical experiments, which were completed prior to the final system test. The first set of criticals comprised cold or zero-power criticals; i.e., the core was not heated by fission power. These were followed by three warm criticals, where fission power heated the core to 200°C, 300°C, and 450°C, respectively. These criticals provided the data, confidence, and regulatory framework that were needed to proceed with the KRUSTY nuclear system test. The criticals also provided valuable data for the benchmarking of codes applicable to all nuclear systems. Finally, a comparison of KRUSTY results to pretest predictions is provided, and overall, the models matched the experimental results very closely.
I. INTRODUCTION
The Kilowatt Reactor Using Stirling TechnologY (KRUSTY) was designed to be representative of a 5-kW(thermal) KilopowerCitation1 space reactor. KRUSTY was designed, developed, manufactured, and tested for <$20 million, with final testing completed in March 2018 at the Nevada National Security Site (NNSS).
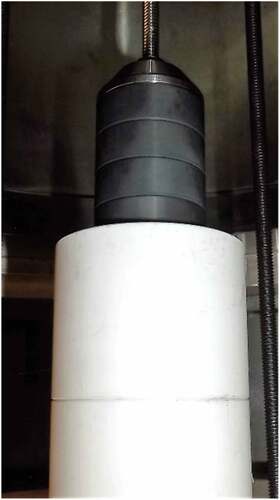
The KRUSTY design is described in papers by Gibson et al.Citation2 and Poston et al.Citation3 The reactor design is remarkably simple: A solid cylindrical core of UMo is cooled by Na heat pipes, surrounded by a BeO neutron reflector. The UMo core is approximately the size of a paper towel roll: 11-cm diameter and 25-cm height. Metal rings clamp the heat pipes to the fuel via a shrink fit. Reactivity control is provided by moving the reflector on a lift table device. The heat pipes transfer the power to Stirling converters, although for the warm critical experiments the temperature is not high enough to thermally couple the power conversion to the reactor. and show photographs of the KRUSTY core during assembly.
Fig. 1. Partially assembled configuration for the component criticals. The first (of three) HEU UMo core segments rests on top of the lower BeO axial reflector. The central cylinder aids assembly and alignment and is later removed.
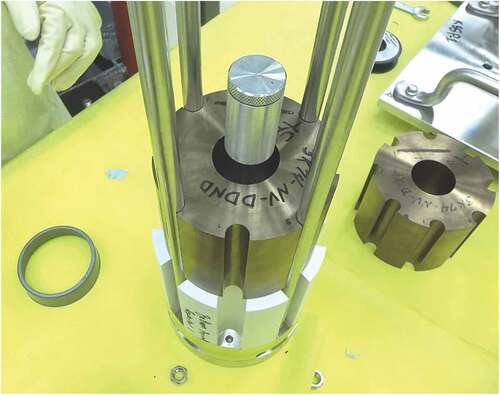
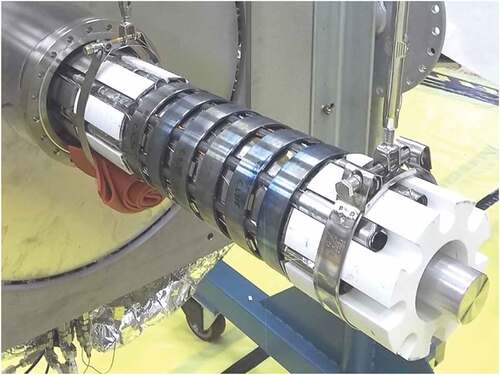
Fig. 2. The assembled KRUSTY reactor core ready to be enclosed within the vacuum vessel. Six Haynes 230 rings are clamping the Na heat pipes to the HEU UMo core, with white BeO axial reflectors on both ends. A temporary fixture to aid assembly (soon to be removed) protrudes from the bottom and surrounds each reflector. The vacuum flange is on the far left.
The primary goal of KRUSTY was to demonstrate the nuclear-powered operation of a flightlike space reactor. Several technical goals were prioritized to make the test as prototypic as possible,Citation3 and testing was focused on demonstrating reactor behavior and providing data to validate models.
II. KRUSTY TESTING PHASES
There were several testing phases during the 3-year KRUSTY project. In year one, mechanical prototyping and testing were performed in tandem with system design. In year two, electrically heated testing (EHT) was performed on various components and system mock-ups, which were used to inform the final design and component procurement. Year three started with a full electrical test of the final KRUSTY design using depleted uranium (DU) fuel. Next, the system was sent to the NNSS Device Assembly Facility (DAF) to be mated with highly enriched uranium (HEU) fuel, which was manufactured and shipped from the Y-12 National Security Complex (Y-12). KRUSTY was then assembled and installed on the COMET lift table, which is operated by the Nuclear Criticality Experiments Research Center (NCERC). The nuclear testing campaign at NCERC lasted from November 2017 to March 2018. An accompanying paper in this special issue documents the full nuclear system test.Citation4
III. ELECTRICALLY HEATED TESTING
The KRUSTY EHT campaign was conducted at the National Aeronautics and Space Administration (NASA) Glenn Research Center (GRC). Initially, EHT was performed at the component level followed by testing of a system mock-up that used a Type 316 stainless steel (SS316) substitute for the core/fuel. Finally, a DU core was delivered to GRC from Y-12 for full system EHT.
At the heart of this testing was a graphite heater designed and developed by the NASA Marshall Space Flight Center. This heater was designed to be inserted into a central cylindrical hole in the fuel. The central hole is the location of the boron carbide (B4C) rod for the flight system, but for testing with DU or with HEU but no radial reflector, the use of the heater did not create a criticality issue.
Electrically heated testing was essential to the success of KRUSTY for several reasons:
EHT was used to work out kinks in component and system design and give insights on how to improve performance.
The EHT unit was essential for developing an assembly process that could be performed simply within the confines of the DAF. The testing at GRC included the integration of personnel from Nevada to give input and get hands-on experience in operations they might perform.
EHT was used to flush out control instrumentation, signals, and processing and also to determine the best locations for positioning thermocouples (TCs). As a result, the console displays, data storage, and operational commands were fully functional and tested thoroughly before the nuclear testing.
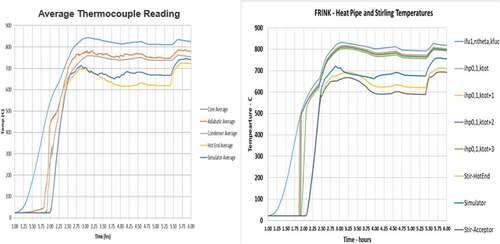
EHT provided valuable data for benchmarking the system modeling tools. This was important to adequately predict system performance and ultimately create the test plan. Especially important was thermal benchmarking of the Fission Reactor Integrated Nuclear Kinetics (FRINK) transient modeling tool.Citation5 FRINK was used to make the pretest temperature predictions that provided the data for go/no-go authorization to proceed from the regulator [U.S. Department of Energy (DOE)].
In addition to the pretest prediction, the hardware and results of the EHT were very important to gaining confidence and trust from the regulator. DOE officials and staff responsible for KRUSTY authorization traveled to GRC to get a hands-on view of the system and the equipment and procedures used for testing.
One example comparison of test results to the benchmarked KRUSTY model is shown in .
Fig. 3. Sample thermal benchmarking case from EHT results.
IV. ZERO-POWER (COLD) CRITICALS
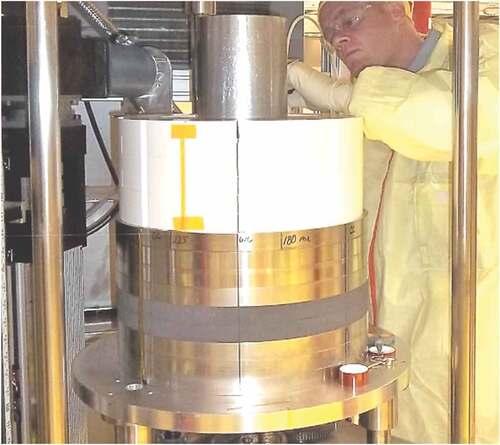
The zero-power criticals were the first nuclear testing of KRUSTY, although zero-power criticals are far different from nuclear-powered testing. Zero power implies that there is no significant heating of the fuel and power levels are so low that the fuel does not become significantly radioactive. There were two distinct sets of zero-power cold criticals: the component criticals and the KRUSTY criticals. The component criticals removed the heat pipes, core clamps, insulation, and vacuum vessel to provide cleaner data for criticality benchmarking. The second set of zero-power criticals evaluated the fully assembled KRUSTY configuration, which was subsequently used for the full system test. Note that KRUSTY was not specifically designed to be a highly precise benchmarking experiment; i.e., there was enough uncertainty in fuel and reflector position to potentially cause 10 ¢ to 20 ¢ of uncertainty in integral keff. However, the relative perturbations in reactivity between configurations are likely accurate to a few cents. The primary goal of these criticals was to get an accurate correlation of system reactivity versus BeO stack height and platen position. shows a photograph of the COMET platen loaded with shielding and BeO.
Fig. 4. The lower shielding and radial reflector being installed on the COMET platen, which consists of stacked 1-in.-thick rings of SS304 (shiny), B4C (dark gray), and BeO (white). Yellow tape holds TC wires.
In total, 91 criticality measurements were taken. In each case, the platen was raised to make the reactor slightly supercritical (keff > 1), and the rate of power increase was measured to provide a relatively accurate calculation of the reactivity (within 1 ¢ or 2 ¢). Soon after these measurements were recorded, they were compared to predictions from the MCNP neutronics code.Citation6 The MCNP model was tweaked (by adjusting gap tolerances, densities, unspecified impurities) to best represent the entire suite of criticality results. The updated model was then used to determine what thickness of BeO radial reflector to load onto COMET for the warm criticals and the final reactor test. Note that the initial, unadjusted MCNP model predicted the first critical very well (within 30 ¢) using ENDF/B7.1 data. Apart from the integral keff, the model predicted each incremental reactivity change (e.g., adding or subtracting BeO) within a few cents.
Several criticals were performed to determine the worth of an internal B4C rod, which is the proposed reactivity control for a flight system. Boron carbide “pucks” (~95% enriched in 10B) were incrementally stacked onto a mock control rod assembly, which was manually inserted into the core though a penetration in the lower vacuum vessel. shows four 1.27-cm enriched B4C pucks stacked on top of the lower axial reflector plugs. Above the B4C stack is the SS316 conical, thin-walled washer and the centering rod. The reactivity worth of the B4C ranged from ~3 ¢/mm near the bottom of the core to ~6 ¢/mm near the axial center of the core. These results also agreed very well with the MCNP model.
Fig. 5. B4C (dark gray) pucks stacked on top of BeO (white) axial reflector pieces.
A description of the component criticals is detailed in CitationRef. 7, and the cold KRUSTY criticals are documented in CitationRef. 8.
V. 15 ¢ RUN
The warm criticals were the first nuclear-powered tests; i.e., fission heat was used to warm up the reactor. The nuclear-heated or warm criticals began in the same manner as the cold criticals. The platen was raised to make KRUSTY slightly supercritical, and the rate of power increase was used to determine reactivity via the Inhour equation. For the warm criticals, the difference was that the power was allowed to increase unabated until sensible power heated the fuel and provided reactivity feedback. The controls were then left untouched to monitor the temperature and power as the passive transient proceeded.
For the 15 ¢ warm critical, or “15 ¢ run,” the platen was lifted to place the BeO radial reflector in a position where the reactor was 15 ¢ supercritical, or keff ~ 1.001. In practice, the COMET operator set the platen to the position where the rise in the reactor power indicated 15 ¢ of excess reactivity. For KRUSTY, a reactor period of ~50 s indicates an excess reactivity of 15 ¢; the reactor period is the time over which the reactor power increases by a factor of e (2.718). The 15 ¢ run test is also referred to as the 15 ¢ “free” run, which indicates that reactor control was never moved beyond the initial reactivity insertion.
shows the log plot of the power during the 15 ¢ run.
Fig. 6. Neutron detector current during 15 ¢ run.
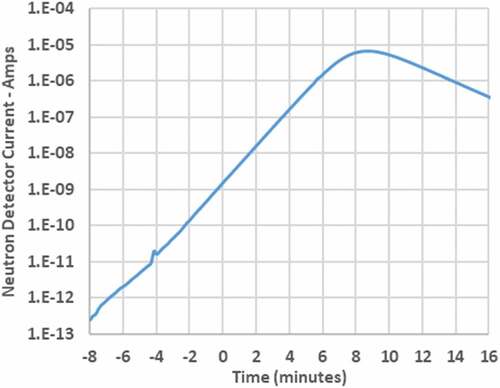
The timescale starts at T = –8 min when the platen was put in a position that was predicted to be 15 ¢ supercritical. After a few minutes, it was determined that the slope of power (neutron detector current) was slightly low, so at –4 min the platen was lifted to increase reactivity/slope, after which the slope indeed indicated ~15 ¢ of excess reactivity (actually 15.7 ¢). At 6 min the slope of power started to decrease as the fuel warmed up and provided negative reactivity feedback as a result of the expansion of the fuel (allowing more neutrons to leak out of the core). At 8.5 min the power began to decrease, or turn over, once the reactivity was negative, or keff < 1.
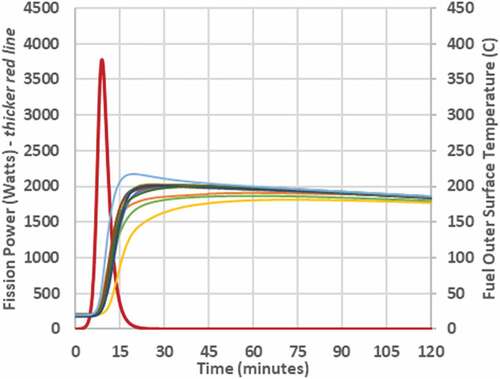
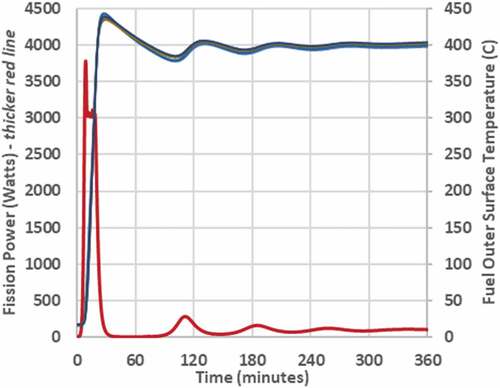
The fission power and fuel TC temperature readings from the 15 ¢ run are shown in .
Fig. 7. Power and temperature data from 15 ¢ run.
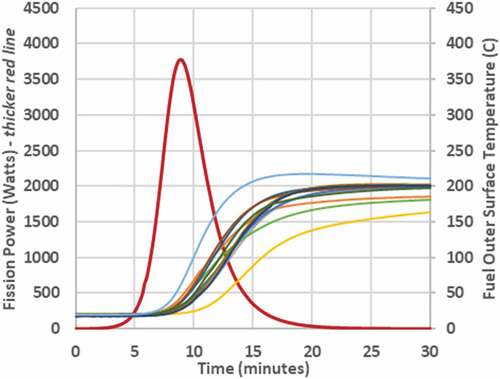
The fission power that is plotted in , and all graphs in this paper, is actually the normalized neutron detector reading. The neutron detector is a 3He detector, for which the readout is amps. The flux at the neutron detector location is almost directly proportional to the flux/fission in the core. Movement of the platen, which affects neutron leakage from the core, might have a measureable impact, but the platen did not move during this transient (i.e., after the 15 ¢ was inserted). Changes in system temperature will also have a minor effect on leakage, but nothing significant. Given that the red curve represents fission rate, the integral of that curve can then be normalized to the number of joules needed to heat the fuel to the measured temperature (based on the fuel specific heat and mega-electron-volts per fission). Second-order effects such as heat leakage from the core and the time-dependent nature of decay power affect this normalization, but the initial guess based on adiabatic heatup and constant decay power was very close based on subsequent benchmarking efforts.
The peak power reached during the 15 ¢ run was ~3.75 kW(thermal). This was within the expected range but was a bit higher than the predicted value of 3.45 kW(thermal). This is likely because the actual insertion was 15.7 ¢, as indicated by the measured reactor period (ramp rate), which would explain this difference.
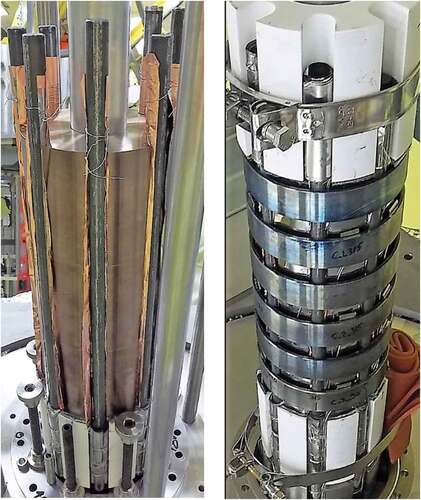
The core temperature rise for the 15 ¢ run was also well within the predicted range; however, the TC readings were not in sync. It appears that some TCs had better thermal bonding than others and that only one TC was well bonded (the blue line in , which reached ~220°C). As the subsequent tests went to high temperatures, the thermal bonding appeared to get much better, which is to be expected since the TCs are spring-loaded against the fuel (not physically attached). It was decided not to weld or braze the TCs directly to the fuel to avoid potential fuel damage, but unfortunately, this caused significant lag in most of the core temperature TCs. shows the KRUSTY core with and without the clamping rings. Silver TC wires can be seen running down the core behind the rings, as well as the edges of the rectangular springs that pressed the TCs against the thin layer of Mo that surrounded the fuel.
Fig. 8. KRUSTY core assembly: (a) heat pipes fitted within the slots in the HEU UMo fuel and (b) core after the installation of the Haynes 230 rings that clamp the heat pipes to the fuel (via interference fit). White BeO axial reflectors are seen on top and bottom. Some parts in the photographs are part of the temporary assembly fixture, which is later removed.
During the 15 ¢ run, the TC lag created unease in the control room because the neutron detectors indicated that the power ramp was decreasing but the core was apparently not warming up. Most of the TCs plotted in do not start to heat significantly until ~9 min, while the power is already >1 kW at 6 min. Even the “good” TC (blue line) had a modest amount of lag; it started to heat significantly at ~7.5 min, which is about 1.5 min delayed. Unfortunately, the good TC was not one of the nine fuel TCs being displayed on the control room console at the time. Thus, based on all of the TCs being viewed in real time, it was disconcerting that the fuel temperature did not increase significantly until after the power had peaked and turned over. Fortunately, the power had indeed turned over as expected, and because of the simple nature of the system, all parties decided to continue because there was no credible scenario for the core to overheat.
plots the 15 ¢ run on a longer timescale. After an hour or so, all the TCs were close to equilibrium because radiation heat transfer across the poorly bonded gaps eventually brought the temperatures together. It was important to run this and the other warm criticals long enough to monitor long-term temperature drop (indicating passive power loss). This provided data to benchmark the heat loss paths within the modeling tools in conjunction with the final system test.
Fig. 9. Extended power and temperature data from 15 ¢ run.
VI. 30 ¢ RUN
Next, the 30 ¢ run (warm critical) was performed. The initial reactivity insertion was again ~15 ¢, but after the power peaked and began to drop, the operator incremented reactivity (lifted the platen) until a total of 30 ¢ had been inserted. Each nuclear-powered test started the same way, with a 15 ¢ free run, to ensure that the configuration had not changed since the last test and that nothing else might be going wrong. This approach was appreciated by the DOE regulator as it provided another metric to evaluate safety as testing proceeded; i.e., if the transient was not following the expected path, then COMET could be immediately scrammed.
After the power had turned over, the platen was raised (reactivity inserted) at a rate to keep the power constant at ~3 kW(thermal), i.e., actually to the neutron detector reading that corresponded to 3 kW(thermal). This transient is plotted in .
Fig. 10. Power and temperature data from 30 ¢ run.
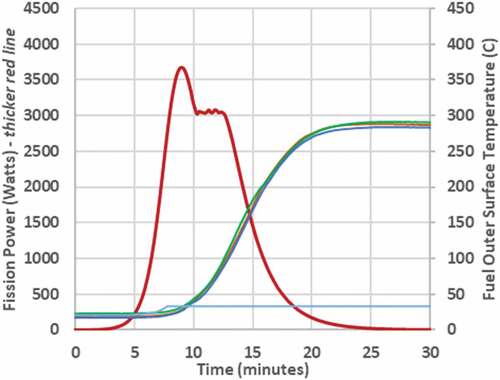
The power in rises to a peak similar to the 15 ¢ run but is slightly lower, ~3.65 kW, because the actual insertion is indicated to be 15.5 ¢ as opposed to 15.7 ¢. The point at which the operator inserts additional reactivity to keep power constant can be clearly seen starting at 10 min and ending at ~12.5 min. At that time the platen was at a position predicted to have inserted 30 ¢ (note that posttest modeling indicates an actual insertion of 29.9 ¢, so the prediction was very good).
In the 30 ¢ run, the TC readings are a bit more uniform than the 15 ¢ run, but there is still clearly a lag in TC response time; i.e., the fuel should start heating significantly when the power becomes >1 kW(thermal) (at ~6 min), but the TCs do not respond until ~9 min. Note that just as in the 15 ¢ run, the good (blue) TC starts to rise much earlier, but then it quickly flatlines at ~30°C. The reason for this was the loss of the “NASA rack,” i.e., the computers and hardware that were recording that specific TC value (and other test data). The same problem was experienced during the Demonstration Using Flattop Fissions (DUFF) testing,Citation9 when data acquisition was lost just after a relatively high power was reached. The DUFF computer rack was very poorly shielded, and it is speculated that a single-event upset (SEU) might have caused the problem.
Despite this lesson learned from DUFF, the same problem was encountered once again. The KRUSTY design and configuration had initially been designed to provide robust rack shielding, but several compounding factors ultimately reduced the level of shielding by at least two orders of magnitude. The largest contributor was the last-minute need to move the rack from its initial intended location, behind a second concrete wall, to a location behind only one concrete wall, with a direct 1-scatter view of KRUSTY. A rather inefficient rack shield had been designed, which likely would have been adequate behind the second wall but apparently was not adequate behind the first wall (assuming that SEU or radiation was indeed the culprit). Other contributors that diminished shielding, as discussed in CitationRef. 3, were a shield material change from SS316 to Type 304 stainless steel (SS304) (less neutron absorption), the late addition of the shim pan (a leakage gap next to the fuel), the difficulty of changing BeO in the shim pan (a larger gap than intended), and rather low density B4C shielding (well below specification).
Despite all of this, there was really no significant impact because in one respect we did learn the lesson from DUFF; i.e., we provided redundancy in measurement. We hardwired as many fuel TCs as we could through ports that led directly to the COMET control room instead of relying solely on the NASA rack (which was recording the good TC as mentioned above). Somewhat surprisingly, the NASA rack returned to operation and started recording data ~3 h after it tripped, near the end of the 30 ¢ run.
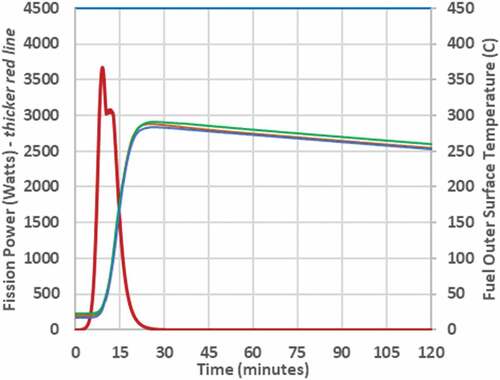
The long-term temperature drop in indicates the heat loss from the fuel is ~30 W, which was very useful data to benchmark the heat transfer mechanisms from the fuel, in particular, the effectiveness of the multilayer insulation. If this case was allowed to run for tens of hours, the fuel would have eventually cooled enough to produce positive reactivity. Then, the power would have risen to ultimately match the heat loss, and the core would have coasted at ~30 W and ~200°C. Instead, it was decided to demonstrate this passive, load-following behavior in the 60 ¢ run because the period of oscillation would be much shorter.
Fig. 11. Extended power and temperature data from 30 ¢ run.
VII. 60 ¢ RUN
The final warm critical was conducted in the same fashion as the 30 ¢ run except that the operator continued to raise the platen until 60 ¢ was inserted. This test was crucial to the success of the KRUSTY campaign. First, it confirmed the passive dynamic response predicted for the system. Second, it provided the authorization basis to proceed with the full system test. The latter was a novel approach to providing the safety basis for a nuclear test. The ability to adequately model the dynamic performance of KRUSTY existed only within the design team (using the code FRINK). Safety reviewers could rely on simplified nuclear calculations (due to the neutronic simplicity of KRUSTY), but an independent transient system model would have taken substantial time and effort. Thus, it was proposed that the design team would predict the peak TC reading for the 60 ¢ run, and if the result was within 10% of the prediction, then the final test could proceed; otherwise, KRUSTY would not be given authorization for the final full-system test. An official predicted value of 447°C (720 K) was submitted the day before the test.
Prior to the 60 ¢ run, a few quick changes were made to the NASA rack shield configuration but nothing significant because the data from the NASA rack were not of great importance (just as for the 30 ¢ run). However, significant shield changes were made between the 60 ¢ run and the full nuclear system test because all of the ex-core TCs and the power conversion data would be essential. Basically, the computer was removed from the rack and placed on the floor, and an igloo was made of concrete blocks surrounding the computer, leaving enough gaps to prevent computer overheat.
The power and fuel temperatures from the 60 ¢ run are shown in .
Fig. 12. Power and temperature data from 60 ¢ run.
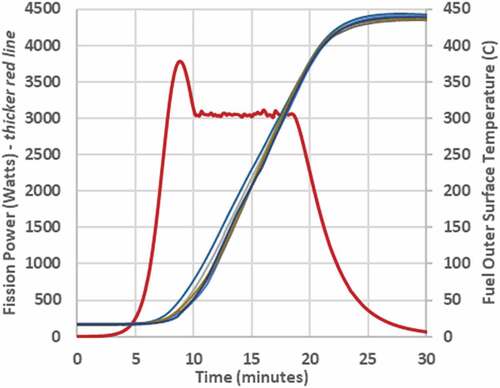
The power in rose to a peak similar to the other warm criticals, corresponding to a 15.5 ¢ insertion. As with the 30 ¢ run, the operator began to insert additional reactivity at 10 min to keep power at ~3 kW(thermal). In this case reactivity was inserted to a predicted value of 60 ¢, which occurs at 18 min in . Posttest modeling indicates an actual insertion of 58.5 ¢, which is not as well predicted as the 30 ¢ run but is not surprising because there were not as much zero-power critical data to help predict this magnitude of insertion.
The key value in is the peak TC reading. The peak recorded temperature was 446°C, which is only 1°C from the safety basis prediction, so it is clearly within 10%. In the best scenario, this prediction might have had an uncertainty of ±2% (or 9°C), so nailing it within 1°C was sheer luck. Regardless, it checked the box for proceeding with the full system test.
plots the 60 ¢ run on a much longer timescale, which in this case is 6 h, to let the transient fully evolve. The results in provided the first validation that KRUSTY, and all similar Kilopower reactors, would provide stable operation and provide a power level equal to the power drawn from the core.
Fig. 13. Power and temperature data from 6-h, 60 ¢ run.
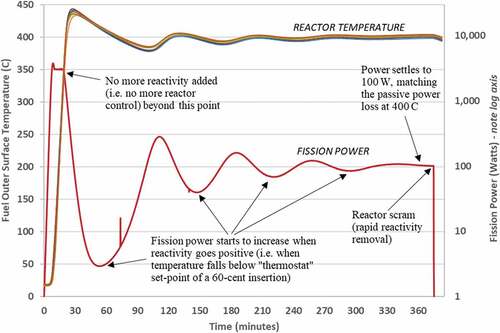
replots the data in with the power on a log scale (and in larger format) to better show this dynamic. The passive response of the reactor is the same as a household thermostat: If the temperature gets too cold, the power/heat kicks on, and vice versa. In the reactor, the temperature setpoint is determined by the level of reactivity insertion (platen position) and the passive temperature feedback of the reactor (expansion and cross sections). In this case, the reactor thermostat was set at ~400°C, so every time the temperature went above ~400°C, the power decreased, and every time the temperature dropped below ~400°C, the power increased (technically, there are other small second-order effects). Via dampened oscillations, the fission power settled to match the power passively drawn from the reactor at 400°C, or ~100 W.
Fig. 14. Power and temperature data from the 6-h, 60 ¢ run.
There was one other noteworthy event during the 60 ¢ run. At ~300 min the turbopump that was providing a relatively hard vacuum (1 × 10⁻⁴ Torr) failed. There was a live microphone in the test chamber, and a disconcerting noise made it very evident something “bad” was happening. It did not take long to notice the pressure rise in the chamber, so it quickly became clear that the turbopump was failing, but it was decided to continue the run because the power and temperature were virtually unchanged. The pressure settled at ~5 × 10⁻³ Torr, which was the vacuum that could be maintained by the roughing pumps; fortunately, this was still a decent enough vacuum to prevent substantial conduction and convection. The reason for the turbopump failure is not 100% certain, but there is a good chance it was once again a SEU occurring on the aforementioned NASA rack, this time with the turbopump controller. Strangely though, the failure occurred when KRUSTY was at only 100 W and there had already been more than 30 min of prior operation at ~3000 W, which would have provided the controller a substantially higher flux and fluence (far more than a few hours at ~100 W). But, the nature of SEU is exactly that; i.e., a single neutron (or other radiation) can cause a failure regardless of flux or fluence. This again reinforces that any electronic system near a reactor that is absolutely required should not only be well shielded but also have control redundancy and/or a quick reboot cycle.
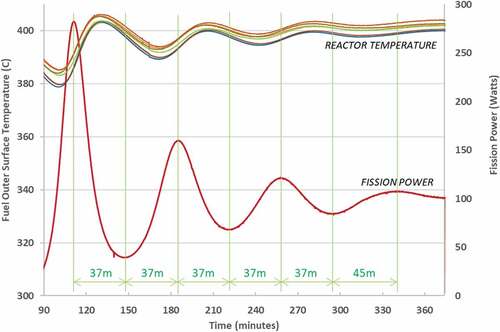
The effect of the turbopump failure on the reactor is not readily evident looking at the data in ; however, more careful analysis does indicate that heat transfer from the system was slightly increased. The clear indicator is the oscillation time of power and temperature. takes a closer look at the transient and demarks each one-half oscillation. The period of the first three full oscillations was constant at 74 min up until the ~295-min point: 37 min for power to move from minimum to maximum and 37 min to move from maximum to minimum. The turbopump failed at 296 min. There is no distinguishable step change at that point, but the time for the power to increase from minimum to maximum increased from 37 to 45 min. This can be explained by additional heat removal caused by the reduced vacuum over this period. The reactor heatup was suppressed over this period, so negative reactivity feedback did not kick in as fast as it did for the previous oscillations; thus, the power continued to increase for a longer period. Future modeling might determine how much this reduction in vacuum increased heat removal, but it was likely on the order of a few watts. For the 60 ¢ run, the impact was minor but noticeable, but for the full-power system test, a few watts is negligible because of the much higher power. In the end, the loss of the turbopump altered system performance slightly, but it did produce a nice academic scenario to compare with transient models.
Fig. 15. Period of oscillation for the 6-h, 60 ¢ run.
VIII. COMPARISON TO DESIGN (PRETEST) MODELING
One of the major selling points of the Kilopower program and the KRUSTY reactor is that reactor dynamics are so simple that modeling can be sufficient to predict performance. To test that assumption, an entire paper was dedicated to publishing the predicted performance of KRUSTY months prior to actual operation.Citation10 There was certainly risk to the project in doing this, but the upside of matching previously published predictions would make a compelling case that Kilopower was ready to proceed to a flight demonstration.
The predictions of system steady-state and transient performance were calculated by FRINK (CitationRef. 5). FRINK uses a coarse-mesh, finite difference method to produce a coupled thermal-neutronic solution via point kinetics using neutronic parameters calculated by MCNP.
For the 15 ¢ run, and from CitationRef. 10 can be directly compared to in this paper. The shape of the curves is nearly identical. The peak predicted power was 3.45 kW versus the peak observed power of 3.75 kW, and as previously noted, this is because the reactor period indicated a 15.7 ¢ insertion versus the 15.0 ¢ used in the prediction. The peak predicted temperature was 215°C (488 K), and the peak observed temperature was 220°C. This is very close regardless, but when the model was rerun to insert 15.7 ¢, it predicted a peak temperature within 1°C, so the prediction was remarkably good. The accuracy of this prediction is attributable to the simplicity of the transient. The total reactivity insertion (15.7 ¢) was well characterized, so the reactor response was essentially dictated by only two parameters: the thermal mass and the fuel temperature reactivity feedback. The thermal mass (mass times specific heat) was well known based on historical data. The fuel reactivity feedback was almost entirely determined by fuel expansion because of the fast neutron spectrum, which was well known based on historical data and data obtained at GRC from KRUSTY fuel samples.
For the 60 ¢ run, and from CitationRef. 10 can be directly compared to in this paper. The shape of the power and temperature profiles once again matched very well. The observed ramp increase of power indicated a 15.7 ¢ initial insertion, so the actual power peak was again 3.75 kW, which is higher than the predicted 3.45 kW (which assumed a 15 ¢ insertion). The peak temperature seen in in CitationRef. 10 was 467°C (740 K), which is 20°C higher than the aforementioned “formal” pretest prediction of 447°C. This is because the formal prediction was reduced by 20°C due to the loss of the good TC. In it can be seen that the good TC (blue curve) measured a peak temperature 20°C higher than the rest of the TCs because it was thermally well bonded to the fuel. However, the good TC was not available for the 60 ¢ run, so the formal prediction was lowered to match the predicted peak of the working TCs. When the FRINK model was benchmarked against the 15 ¢ and 30 ¢ runs, it was found that the working TCs measured temperatures similar to the model’s prediction for the ring clamps (as opposed to the fuel itself). Therefore, when the updated model was used to predict for the 60 ¢ run, the officially reported prediction of 447°C was based on the model’s output for the ring clamps, which was ultimately correct and matched the actual peak TC output within 1°C.
Overall, the ability to accurately predict the nuclear performance of KRUSTY is rooted in the simplicity of the design. Performance is simplified because there are minimal phenomena and components (i.e., no cooling loop, grid structure, moderator, heterogeneity), and the fast neutron spectrum eliminates potential uncertainties associated with the nuclear cross-section data. System dynamics are simplified because they are dictated by one dominant feedback coefficient, coupled with one dominant/passive heat transfer path. The reactivity feedback is determined almost entirely by fuel thermal expansion (due to the compact, fast spectrum physics), and this feedback is very predictable and uniform. Heat transfer (and the associated time dynamic constant) is simple because it is driven by conduction and the core is effectively an isothermal lump due to heat pipe cooling and low power density. Note that reactor predictions are more complex when the heat pipes operate near their performance limits, but the dynamics are very predictable when the heat pipes operate with sufficient thermal margin (i.e., when they act effectively as an infinite conductor).Citation4
IX. CONCLUSIONS
The KRUSTY warm criticals were successful, and the passive, self-regulating dynamics of the KRUSTY reactor were demonstrated. Even more so, both the static, kinetic, and dynamic results were remarkably close to the pretest modeling, which underscores that this kind of reactor can be designed without significant uncertainty in how it will actually operate. This is extremely important for Kilopower systems with powers ≫5 kW(thermal), which will generally preclude the opportunity for inexpensive testing as was done for KRUSTY. The key of the Kilopower program is that all reactor designs will have the same basic physics and heat transfer as KRUSTY, and thus, they should all operate in the same manner. If the physics can be kept simple, i.e., a compact, fast spectrum reactor, then even at much higher powers, the same passive, load-following response should remain, even with a different power conversion system or even gas cooling of the reactor.locations.
Acknowledgments
We would like to thank the entire Kilopower team for its commitment to realizing the first demonstration of space fission power technology in over 50 years. We would also like to thank NASA’s Space Technology Mission Directorate and Game Changing Development Program as well as the DOE National Nuclear Security Administration’s Nuclear Criticality Safety Program for their sponsorship and vision in seeing the Kilopower technology through to the conclusion of its first groundbreaking step toward abundant, affordable power for space missions to the solar system’s most challenging and interesting locations.
References
- P. R. McCLURE et al., “Kilopower Project: The KRUSTY Fission Power Experiment and Potential Missions,” Nucl. Technol., 206, S1 (2020); https://doi.org/10.1080/00295450.2020.1722554.
- M. A. GIBSON et al., “Heat Transport and Power Conversion of the Kilopower Reactor Test,” Nucl. Technol., 206, S31 (2020); https://doi.org/10.1080/00295450.2019.1709364.
- D. I. POSTON et al., “KRUSTY Reactor Design,” Nucl. Technol., 206, S13 (2020); https://doi.org/10.1080/00295450.2020.1725382.
- D. I. POSTON et al., “Results of the KRUSTY Nuclear System Test,” Nucl. Technol., 206, S89 (2020); https://doi.org/10.1080/00295450.2020.1730673.
- D. I. POSTON et al., “FRINK—A Code to Evaluate Space Reactor Transients,” AIP Conf. Proc., 880, 449 (2007); https://doi.org/10.1063/1.2437485.
- D. B. PELOWITZ, “MCNP6 User’s Manual,” LA-CP-11-1708, Los Alamos National Laboratory.
- R. SANCHEZ et al., “Kilowatt Reactor Using Stirling TechnologY (KRUSTY) Component-Critical Experiments,” Nucl. Technol., 206, S56 (2020); https://doi.org/10.1080/00295450.2020.1722553.
- T. GROVE et al., “Kilowatt Reactor Using Stirling TechnologY (KRUSTY) Cold Critical Measurements,” Nucl. Technol., 206, S68 (2020); https://doi.org/10.1080/00295450.2020.1712950.
- D. I. POSTON et al., “Experimental Demonstration of a Heat Pipe–Stirling Engine Nuclear Reactor,” Nucl. Technol., 188, 3, 229 (2014); https://doi.org/10.13182/NT13-71.
- D. I. POSTON, “Predicted Performance of the KRUSTY Reactor,” Proc. Topl. Mtg. Nuclear and Emerging Technologies for Space (NETS-2018), Las Vegas, Nevada, February 26–March 1, 2018, American Nuclear Society (2018).