
 ?Mathematical formulae have been encoded as MathML and are displayed in this HTML version using MathJax in order to improve their display. Uncheck the box to turn MathJax off. This feature requires Javascript. Click on a formula to zoom.
Abstract
A method to determine the absolute activity of 137Cs in irradiated nuclear fuel is presented. Using a well-known point-like calibration source in combination with measurements of the gamma-ray intensity from the nuclear fuel and Monte Carlo calculations based on the nominal measurement geometry, the activity content can be determined without prior knowledge of the intrinsic detection efficiency of the gamma-ray detector. The presented method is tested using measurements of the 137Cs intensity from spent nuclear fuel of the pressurized water type at the central interim storage in Sweden. Using an assumption of homogeneous distribution of 137Cs throughout the fuel, we demonstrate a linear relationship between measured activity and the activity calculated by a state-of-the-art simulation code. For future studies, we suggest some factors that potentially can decrease the uncertainty in the correlation between measured and calculated activity.
I. INTRODUCTION—BACKGROUND AND PURPOSE
The aim of the Swedish model for the deep geological storage of used nuclear fuel is to protect humans, animals, and the environment that come in contact with the radioactive substances in the used fuel under the period of time, as the substances may constitute a risk. To ensure this, the storage is based on three barriers: the copper canister, the bentonite backfill, and the bedrock. Entire fuel assemblies will be dried and stored in copper canisters that will be hermetically sealed. There is a cast-iron insert with room for four nuclear fuel assemblies of the pressurized water reactor (PWR) type or 12 of the boiling water reactor type inside the copper canister. The sealed canisters will be stored at a circa 500-m depth in granite bedrock surrounded by bentonite clay. CitationReference 1 thoroughly describes the method that is planned to be used for deep geological storage in Sweden.
From both economic and environmental aspects, it is important that the copper canisters should be filled, i.e., no position in the canister should be left empty. It requires a well-optimized choice of fuel assemblies to avoid leaving a position empty as a consequence of the limitation on, e.g., the total decay heat for each canister. A key point for this optimizing process is to know the decay heat for each fuel assembly with high accuracy and low uncertainty.
Well-established simulation codes are often used to estimate the decay heat of a fuel assembly. From both licensing and commercial perspectives, a simulation-based method has to be supplemented by a measurement-based method. It is important that the radionuclide inventory and the total decay heat in each copper canister are correctly determined.
The measurement-based method proposed in this paper is one method that can be used in an ensemble of methods to verify key parameters calculated for nuclear fuel assemblies. Specifically, the content of the radionuclide 137Cs is measured and compared with the calculated content.
Cesium-137 is a suitable nuclide for the purpose of this paper, for the following reasons:
The activity content of 137Cs is in general proportional to the decay heat in a fuel assembly for a given cooling time above 10 years and burnup.Citation2
The 662-keV gamma radiation produced in decay of 137Cs is relatively easy to detect with standard equipment for gamma-ray spectroscopy.
The 30-year half-life of 137Cs is suitable since it is so long that the uncertainty in cooling time at a weekly scale is negligible.
The half-life is also such that the gamma intensity is relatively high both for long cooling times and for fuel assemblies with short irradiation time in the reactor core. High gamma intensity is an essential condition for a short measurement time while still allowing for good counting statistics.
This paper is structured as follows. After this introduction section, a method to experimentally determine the content of 137Cs is presented. Results from experimental measurements are then presented. A section on the calculated content of 137Cs follows. A comparison between measured and calculated activity is then presented, followed by conclusions and some identified topics for future work. All uncertainties given in this paper are with one-sigma confidence level unless otherwise indicated.
II. MEASUREMENT METHODOLOGY
The methodology described in this paper can be used for the quantitative determination of 137Cs activity in a fuel assembly. It is relatively fast and can be implemented using commercial off-the-shelf components in an industrial context with a high technology readiness level. The goal of this methodology is to reduce dependency from the source-detector geometry that requires different calibrations for different types of fuel assemblies and different detectors.
The absolute 137Cs activity for a fuel assembly is determined by the expression in EquationEq. (1
(1)
(1) ):
where is the absolute detection efficiency for fuel assembly
. The measured 137Cs intensity is denoted by
. A point source with well-known 137Cs activity is used for the absolute efficiency calibration of the measurement system; we used a source with a 3% uncertainty (1.96 sigma) as indicated in Sec. III.C. The absolute detection efficiency for fuel assembly
(
) can be rewritten using the detection efficiency for a point source
as the expression in EquationEq. (2)
(2)
(2) :
where is a source geometry factor that compensates for different source geometries between the fuel assembly and point sources. The kappa factor is estimated using the ratio of intensities in EquationEq. (3):
(3)
(3)
where is a count rate from fuel assembly of type
, and
is a count rate from a reference point source. The MC subscript indicates that these properties are estimated using a Monte Carlo–based calculation. The intensities in EquationEq. (3)
(3)
(3) are usually calculated in Monte Carlo codes as the rate per emitted photon. The definition in EquationEq. (3)
(3)
(3) implies that the activities in the reference source and the fuel assembly source must be equal in the Monte Carlo calculations, but the absolute values of activities cancel out in the ratio using a per-emitted-particle calculation. The same result would be achieved if both source activities were assumed to be 1.
The final expression to determine the absolute amount of 137Cs activity for a fuel assembly is given by EquationEq. (4)
(4)
(4) :
III. EXPERIMENTAL RESULTS
Twenty-five PWR fuel assemblies (15 × 15 and 17 × 17) have been measured using high-resolution gamma spectroscopy with the aim to experimentally test the methodology described previously. displays information about the measured fuel assemblies. All fuel assemblies in the study have been measured at the Central Interim Storage Facility for Spent Nuclear Fuel (Clab) in Sweden, which is owned and operated by The Swedish Nuclear Fuel and Waste Management Company (SKB), in two different measurement campaigns. Raw data from the measurements are available from CitationRef. 3.
TABLE I Parameters of the Measured Fuel Assemblies
III.A. Measured 137Cs Intensity
All fuel assemblies were scanned to determine the intensity for the whole axial length. CitationReference 4 contains details of the measurement arrangement. In the measurements, one corner of the fuel assembly pointed toward the collimator. Every fuel assembly is scanned on four corners (45, 135, 225, and 315 deg) according to the intrinsic coordinate system. The fuel assembly moves axially with constant speed both up and down in front of the collimator during the measurement. In total, eight energy spectra are obtained for each assembly.
Since the fuel is axially scanned with the collimator system, only one section of the fuel assembly is measured at the time. The activity of a fuel assembly is the integral of infinitesimal activities in sections of the assembly, as given by the expression in EquationEq. (5)(5)
(5) :
The activity can be expressed as the average activity modified by a form function that describes the scan time (i.e., space) dependence. By definition, the integral of the form function is one. EquationEquation (5)
(5)
(5) can be rewritten using the definition of the form function to the expression in EquationEq. (6)
(6)
(6) :
The expression in EquationEq. (7)(7)
(7) is obtained by combining EquationEqs. (1)
(1)
(1) , (Equation2
(2)
(2) ), and (Equation6
(6)
(6) ) (the total activity is determined using the average intensity and point source activity and kappa factors as defined previously):
with being the total measurement time. Combining the expression in EquationEqs. (1)
(1)
(1) , (Equation2
(2)
(2) ), and (Equation7
(7)
(7) ) gives the expression in EquationEq. (8
(8)
(8) ), which is used here to evaluate the axial gamma spectroscopy scans:
The absolute efficiency for a point source is measured using a 137Cs point source with well-known activity.
III.B. Source Geometry Factor
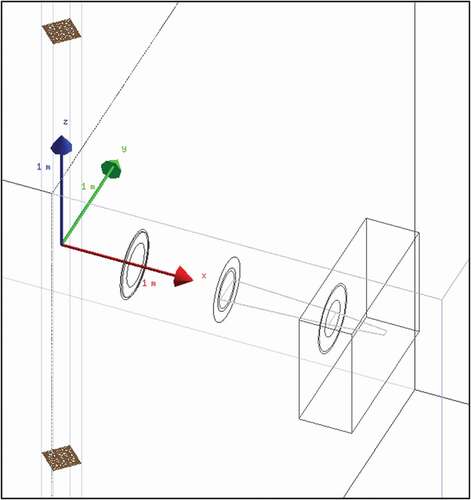
Monte Carlo simulations were used to determine source geometry factor for the fuel types included in this study. The Geant4 toolkitCitation5 was used to model the equipment used for gamma scanning at Clab in CitationRef. 6. The geometry of the model is displayed in . Two modes of calculation were used: (1) using a mono-energetic point source placed along the central line of the collimator slit and (2) using mono-energetic, isotropic, and homogeneous emission from fuel rods in a fuel assembly. In both modes, 662-keV gamma radiation was emitted and the flux of 662-keV gamma particles through the opening of the collimator slit toward the measurement room was calculated. In the second mode, the flux from each fuel rod was calculated separately for each of the following fuel assembly types: Westinghouse 17 × 17 and Kraftwerk Union 15 × 15 (PWR).
Fig. 1. Schematic illustration of the geometry used in the Geant4 model displaying a PWR 17 × 17 fuel assembly placed in the water pool along the blue z-axis. The conical collimator slit through the pool wall at the Clab is directed along the red x-axis. Reused with permission from CitationRef. 6.
III.C. Measured Activity of 137Cs
gives the measured intensity , the efficiency for the 137Cs point source
, the source geometry factor
, and the determined absolute amount of 137Cs activity for a fuel assembly
. Also, the variance
for the 137Cs activity is given in . The variance is determined by uncertainty propagation of EquationEq. (4)
(4)
(4) .
TABLE II In-Data and Results for the Measurement of 137Cs Activity
The variance of the intensity is related to the number of recorded net pulses, which are in the order of 105 to 106, which gives a variance for the intensity
in the order of 102 to 103 s−2.
The variance of the efficiency consists of two parts: the uncertainty of the 137Cs activity in the point source, which has an uncertainty of 3% (1.96 sigma),Citation7 and the uncertainty in the number of recorded net pulses in the calibration measurement. The variance for the efficiency is determined by uncertainty propagation of EquationEq. (1)
(1)
(1) (the activity and the efficiency are swapped), the variance for the efficiency
is about 3∙10−15 s−2∙Bq−2.
The variance for the source geometry factor consists of two parts [EquationEq. (3)
(3)
(3) ]. The uncertainty for both
and
are in the magnitude of 1% (CitationRef. 6). The variance for the source geometry factor is determined by uncertainty propagation of EquationEq. (3)
(3)
(3) . The variance for the source geometry factor
is about 6∙10−16aThe tU in the burnup column stands for metric tonne of U.
IV. CALCULATED ACTIVITY OF 137Cs
The computer code SNF (CitationRef. 8) is used to determine the activity of 137Cs by calculations for all assemblies in the study. The calculations are based on the comprehensive operation history and fuel data normally used in the production, i.e., core design, etc. The uncertainty in calculated 137Cs activity is set to 2%, which is an estimate based on the authors’ experience of SNF and what is reported by, e.g., CitationRef. 9.
V. COMPARISON BETWEEN MEASURED AND CALCULATED ACTIVITY OF 137Cs
The relationship between the measured and calculated 137Cs activity is very linear, as can be seen in (R2 = 0.99).
Fig. 2. Measured versus calculated 137Cs activity for PWR01 to PWR25.
If the measured 137Cs activities are multiplied by the constant 1.390, then the relative difference between the measured and calculated values is between 0.94 and 1.06, see . When analyzing the relative difference with regard to the scale/size, no clear trend between fuel containing burnable absorber and fuel that does not is apparent, see . There is also no obvious similarity between the scale/size of the relative difference and the cooling time as shown in .
TABLE III Calculated Activity of 137Cs for Fuel Assemblies PWR01 to PWR25
TABLE IV Relative Difference Between the Measured and Calculated 137Cs Activities*
There seems to be a minor correlation between the scale/size of the relative difference and the different reactors. The Ringhals nuclear power plant number 2 (R2) is a PWR with 15 × 15 fuel assemblies and numbers 3 (R3) and 4 (R4) are PWRs with 17 × 17 fuel assemblies. The relative difference for R2 is between 0.94 and 1.06, 0.95 and 1.02 for R3, and 0.94 and 1.03 for R4.
The uncertainty in the ratio of and
in is determined by uncertainty propagation of the two parameters. The uncertainty for the ratio is about 2.9%.
VI. CONCLUSIONS AND DISCUSSION
The conclusion of the study is that measuring the content of the radionuclide 137Cs for every single fuel assembly and comparing it with the calculated content can be used as a method to verify corresponding calculations of the 137Cs content. Distribution of the ratio is between 0.94 and 1.06 for all 25 fuel assemblies in the study, see . The ratio is within ±10% if the uncertainty of the ratio is considered for a confidence interval of 68% (). Given the distribution of ±10% for 68% confidence and with the measurement conditions used, the results from this study are deemed as satisfactory. The uncertainty in the ratio of
in is primarily dependent on the uncertainty in
the 137Cs activity in the point source (1.5% uncertainty)
the source geometry factor (1.4% uncertainty)
the computer code SNF (2% uncertainty).
Fig. 3. Ratio between calculated and measured 137Cs activity for PWR01 to PWR25. All the measured 137Cs activities are multiplied by the constant 1.390.
As described in Sec. III, the fuel assembly moves with constant speed in front of the collimator during the measurement. It is not known how big the uncertainty in the elevator speed is and if this uncertainty has any significant impact compared to the other uncertainties. However, the axial profiles of the measured gamma-ray intensities display a relatively quick rise to a plateau, see e.g., CitationRefs. 10 and Citation11, where the fuel is visible from the detector, indicating that the uncertainty from the elevator speed is not very significant. It’s not impossible to exclude an uncertainty connected to mechanical glitches that might have an impact depending on the distance to the detector during the measurement. As described in Sec. III.A, every fuel assembly is scanned on four corners. It is not unlikely to expect an offset with regard to the fact that the angles for the mechanical angular gear are set manually with bare eyes.
As elaborated in Sec. II, there should not be any bias if the absolute efficiency for fuel assembly (
) is correctly determined. Obviously,
is not correctly determined since a bias of 1.4 occurs between the calculated and measured content of the 137Cs activity, as indicated in .
The bias depends probably in the first hand on a deviation between the real measurement geometry and the modeling of the geometry used in the calculation of the source geometry factor . Two sources of lacking information have been identified as possible reasons for errors in the calculation of the factor:
The first is the lack of detailed information on the dimensions and material compositions of the mechanical structures in the measurement geometry. It can be noted that the bias is equal for both the 15 × 15 and 17 × 17 fuel assemblies, and it is equal for the two different measurement campaigns. The constant bias suggests a structural deviation between the source geometry factor and the real measurement geometry.
The second are the uncertainties in the distribution of 137Cs activity inside the uranium pellets of the spent fuel assemblies. In the calculation of the source geometry factor, a uniform activity distribution over the whole cross section of the fuel assembly was assumed, i.e., equal over all rods and equal within a rod. In reality, the activity distribution is probably not evenly distributed in the cross section of the uranium pellets and a radial gradient of activity across the fuel assembly might be present. Changes in the pellet geometry, due to, e.g., swelling during irradiation, also influence the activity distribution and self-attenuation of the radiation, see, e.g., CitationRefs. 11 and Citation12. The sensitivity of the kappa factors with regard to the 137Cs activity distribution is to be studied in future work.
In the construction of a measurement station to be used in the context of spent nuclear fuel assay, numerous improvements can be made compared to the system used in this study:
1. accurate drawings that decrease the deviation between the real measurement geometry and the modeled geometry with calculating the source geometry factor
2. better determined position of the fuel assembly in the measurement station (the distance between the fuel assembly and the detectors) should be well determined
3. fuel assembly and detectors should be fixed (to avoid movements of the fuel assembly or of the detectors during the measurement)
4. a calibration source with lower uncertainty and with a well-known distance to the detectors.
Some issues might be difficult to handle even in a newly designed measurement station, for example, fuel assembly bowing and fuel rod bowing (the source geometry factor as modeled here do not use information concerning bowing problems that occur in reality) and knowing the real distribution of 137Cs activity inside the uranium pellets.
Acknowledgments
The personnel at the Clab in Oskarshamn, Sweden, are acknowledged for their assistance in handling the spent nuclear fuel during the measurements. The high-purity germanium detector used during the measurements was kindly provided by the Directorate-General for Energy of the European Commission. SKB documents, e.g., CitationRefs. 6 and 7, will be submitted on request to [email protected].
The Monte Carlo calculations of the kappa factors were performed on resources provided by Swedish National Infrastructure for Computing (SNIC) through Uppsala Multidisciplinary Center for Advanced Computational Science (UPPMAX) and National Supercomputer Centre at Linköping University (NSC) under projects SNIC 2015/1-451 and SNIC 2016/1-275.
References
- “Design and Production of the KBS-3 Repository,” Technical Report TR-10-12, A. B. SVENSK KÄRNBRÄNSLEHANTERING (2010); http://www.skb.com/publication/2167363/TR-10-12.pdf ( current as of Oct. 20, 2020).
- P. JANSSON, “Studies of Nuclear Fuel by Means of Nuclear Spectroscopic Methods,” PhD Thesis, Acta Universitatis Upsaliensis, ISBN: 91-554-5315-5 (2002); http://urn.kb.se/resolve?urn=urn:nbn:se:uu:diva-2057 ( current as of Oct. 20, 2020).
- P. JANSSON et al., “Time Stamped List Mode Data from Gamma-Ray Spectroscopic Measurements on 47 Nuclear Fuel Assemblies Performed at Clab, Sweden, September 2016 through March 2019,” Data Brief, 31, 106039 (2020); https://doi.org/https://doi.org/10.1016/j.dib.2020.106039.
- P. JANSSON et al., “Gamma-Ray Spectroscopy Measurements of Decay Heat in Spent Nuclear Fuel,” Nucl. Sci. Eng., 141, 2, 129 (2002); https://doi.org/https://doi.org/10.13182/NSE02-A2272.
- S. AGOSTINELLI et al., “Geant4—A Simulation Toolkit,” Nucl. Instrum. Methods Phys. Res., Sect. A, 506, 3, 250 (2003); https://doi.org/https://doi.org/10.1016/S0168-9002(03)01368-8. ISSN 0168–9002.
- P. JANSSON, “Kappa Factors,” SKB Document ID 1878149, Version 1.0, SKB (Feb. 2020).
- “Calibration Certificate Cs-137 Source AH-6333,” SKB Document ID 1588486, Version 1.0, SKB (Feb. 2020).
- “SNF,” Version, SNF-1.6.6, Software: Studsvik Scandpower (2020); https://www.studsvik.com/sv/produkter-och-tjanster/produkter/snf/ ( current as of Oct. 20, 2020).
- S. BØRRESEN, “Spent Nuclear Fuel Analyses Based on In-Core Fuel Management Calculations,” Proc. PHYSOR 2004: The Physics of Fuel Cycles and Advanced Nuclear Systems: Global Developments, Chicago, Illinois, April 25–29, 2004, ISBN: 978-0-89448-683-8.
- P. JANSSON et al., “Axial and Azimuthal Gamma Scanning of Nuclear Fuel—Implications for Spent Fuel Characterization,” J. Nucl. Mater. Manage., 45, 1, 34 (2016).
- S. VACCARO et al., “PWR and BWR Spent Fuel Assembly Gamma Spectra Measurements,” J. Nucl. Instrum. Methods Phys. Res. Sect. A., 833, 208 (2016); https://doi.org/https://doi.org/10.1016/j.nima.2016.07.032.
- H. ATAK et al., “The Degradation of Gamma-Ray Mass Attenuation of UOX and MOX Fuel with Nuclear Burnup,” J. Progr. Nucl. Energy, 125, 103359 (2020); https://doi.org/https://doi.org/10.1016/j.pnucene.2020.103359.