
 ?Mathematical formulae have been encoded as MathML and are displayed in this HTML version using MathJax in order to improve their display. Uncheck the box to turn MathJax off. This feature requires Javascript. Click on a formula to zoom.
Abstract
The French Alternative Energies and Atomic Energy Commission and Orano have developed a modeling tool named the Simulation TOol Of RAdiolysis Gas Emission (STORAGE) for assessing gas generation of intermediate-level waste (ILW). The first version of this model was designed to estimate gas (more specifically hydrogen) production by radiolysis of organic and water-containing materials.
The code deals with different types of waste packages: metal drums, concrete drums, bitumen packages, and compacted waste containers. Diverse radioactive waste can be handled: spent fuel cladding, reprocessing sludge, contaminated technological waste (gloves, bags, bottles, etc.), ion exchange resin, etc.
The validity of the model was evaluated using a series of measurements performed on U,Pu–contaminated solid waste from the Orano plutonium laboratories at the MELOX facility. A benchmark study for compacted waste containers was also implemented; the results of STORAGE were compared with reference calculations performed by Orano Projets.
Future improvements of the STORAGE model are also presented.
I. INTRODUCTION
According to the National Radioactive Waste Management Agency, intermediate-level long-lived waste (ILW-LL) in France represents around 2.9% of the total volume of radioactive waste and contributes around 5% to total radioactivity. The long-term solution for this type of waste is underground disposal in a deep geological repository (CIGEO project).
Intermediate-level long-lived waste packages have a variety of sources: metallic fuel cladding, chemical sludge, resins, polymers, ferrous and nonferrous metals, etc. Their conditioning also varies. Technological waste produced during extraction, maintenance, or dismantling operations carried out in nuclear fuel cycle facilities can contain a significant fraction of organic materials, such as polyethylene (PE), polyvinyl chloride (PVC), polyurethane, etc., in contact with radioactive materials or high- emitters.
Some ILW-LL waste is compacted and then immobilized in a cement matrix. The primary package is designed to contain radioactivity at least during the reversible phase of long-term disposal. This makes it crucial to evaluate the behavior of primary packaging.
Due to safety considerations related to flammability and the risk of overpressure, the generation of molecular hydrogen (and other flammable gases) needs to be predicted throughout the life of the waste package, during its manufacture, interim storage, and transportation, and ultimately, its long-term disposal.
In order to address this need, in 2007 Orano and the French Alternative Energies and Atomic Energy Commission (CEA) initiated a major program (COSTO) to collect gas emission data for different kinds of models and industrial polymersCitation1 (see Sec. II.D.1) and to develop a tool called the Simulation TOol of RAdiolysis Gas Emission (STORAGE) for predicting radiolytic gas generation from nuclear waste packages. The first version of this model was designed to estimate gas (more specifically hydrogen) production by radiolysis of organic and water-containing materials. It is also possible to estimate the amount of hydrogen coming from the corrosion of metals by hydrogen chloride (HCl). The aim of this paper is to present the modeling strategy used to develop STORAGE and to define the tool’s field of application.
By proposing to perform applied calculations on nuclear waste packages, STORAGE has, at first sight, some similarities with the modeling tool Simplified Model of Gas Generation from radioactive waste (SMOGG) developed by AMEC Foster Wheeler for Radioactive Waste Management Limited.Footnotea This software assesses gas generation by different processes, such as corrosion, radiolysis, microbial processes, degradation of organic material, and radioactive decay. Although the scope of SMOGG is undoubtedly wider than STORAGE, it is not suitable for CEA and Orano ILW waste packages, which contain a significant fraction of organic materials. In this case, radiolysis gas generation assessed by SMOGG is too conservative because the tool does not use dose-dependent G-yields for polymers. Moreover, the model is too basic to adequately describe contamination by actinide and water radiolysis in cementitious encapsulant materials.
II. THE STORAGE CODE: GENERAL INFORMATION
STORAGE, a joint Orano and CEA software, aims to conservatively predict the hydrogen flow rate or the gas concentration (not only hydrogen but also carbon monoxide, carbon dioxide, methane, hydrogen chloride, etc.) for various waste packaging configurations. The only constraint is that the geometry is supposed to be cylindrical. An additional objective is to summarize the research and development (R&D) studies carried out at the CEA and to make these results available to researchers and engineers involved in waste management.
STORAGE involves packages already manufactured or in production, but is also a prospective tool for developing new types of waste packages.
The major challenge of STORAGE is to describe an object as complex as a package as simply as possible. This makes it necessary to model the diversity of nuclear waste, which may be heterogeneous or homogeneous, contain diverse materials (steel, concrete, glass, plastic, resin, etc.) in the form of thick pieces, film, powder, or sludge. In addition, the irradiation can be associated with -emitters in the case of contamination by plutonium oxide, for example, and/or with
emitters such as sludges or activated metals. Finally, the waste may or may not be immobilized in mortar.
II.A. Model Geometry
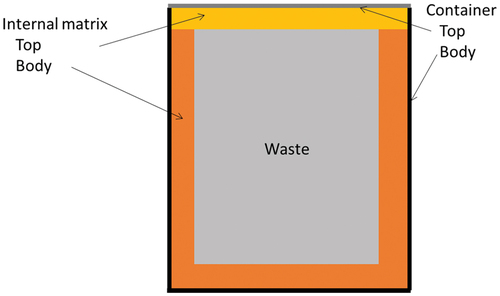
The different drums and containers used by Orano and CEA are defined in the package database associated with STORAGE. A simplified description of a package is used (see ). First, a cylindrical geometry is assumed, then the package is assumed to have three constituents: an external container, an internal matrix, and the volume occupied by waste. The following information is compiled in the database:
1. external and internal dimensions of the constituents (height, diameter, and thickness)
2. materials composing the matrix and the container
3. whether the package is closed, open, or equipped with a diffusive filter.
Fig. 1. Simplified description of a package used by STORAGE.
II.B. Radionuclide Inventory
The radionuclide inventory is provided by the user either by direct entry or from an XML data file. The rate of energy release as a function of time is calculated using CESAR code 5.3 (CitationRef. 2). The characteristics of the radioactive nuclides (half-lives, decay chains, and decay energies) are provided by the database JEFF 3.0.Footnoteb
II.C. Waste Inventory
The waste is defined based on a given database containing the chemical composition, density, and use of more than 100 organic and inorganic materials. Among the materials constituting the waste, a distinction is made between those containing radionuclides, called sources, and the rest of the materials, called nonsources.
II.C.1. Sources
More than 30 types of sources are available: actinide carbide or oxide, radioactive sludge, activated metals (iron, steel, zirconium, Zircaloy), and metal-irradiated fuel cladding. Some organic materials containing radionuclides, such as ion exchange resin, are also considered as sources. Obviously this list is not fixed and can be easily completed.
It is possible to define the particle size distribution of the sources when it has been measured. The geometry of the source is assumed to be either spherical, defined by an average radius or by a distribution, or planar, defined by a surface area and a thickness or undefined (in this case some calculation options are disabled).
II.C.2. Nonsources
The materials referenced in the database belong to different classes: pure inorganic materials (oxides, carbonate, nitrate, sulfate), metal (steel, aluminum, etc.), composite inorganic materials (cement, sludge), liquids (water or aqueous solution, organic solvent), model polymers (PE, polypropylene, PVC, polystyrene, etc.), industrial polymers (polyurethane or Hypalon® gloves, PVC or PE bags, ethylene-propylene rubber or Viton® seals, PVC booting or filter housings, etc.), and industrial organic constituents (paints, lubricants, etc.).
The database is used to define the waste composition and to facilitate searching for radiolytic yields in the Polymer under Radiolysis for the Study of Organic Leachate and Gases (PRELOG) database (see Sec. III).
II.D. Radiolysis Model
This section describes the way the radiolytic gas generation processes are implemented. The model assumes that gas production is proportional to the radiation energy absorbed by the material subject to radiolysis. The calculation of gas production by radiolysis uses the relation:
where
| = | = rate of radiolytic gas generation at | |
| = | = isotope present in the source s | |
| = | = waste constituent | |
| = | = radiation power of type | |
| = | = radiolytic yield for gas production from radiation type | |
| = | = temperature. |
In order to calculate ,
is evaluated using dosimetry codes or a simple approach based on a composite mixing law (see Sec. II.D.2). The dose-dependent yield
is defined using the PRELOG database.
II.D.1. Radiolytic Yields
The G-value, defined as the ratio of the number of gases created or destroyed to the deposited energy, measures radiolytic gas generation. Factors affecting radiolytic gas production include the material composition, the linear energy transfer (LET), the atmosphere (inert or oxidizing), the temperature, the dose rate, and the absorbed dose. Classically, the G-factors for and
radiation are often assumed to be the same, but are different from those for
radiation.
As mentioned previously, CEA and Orano were engaged in an R&D program whose objective was to improve knowledge on the radiolysis of the polymers present in their waste. Experimental studies were more specifically dedicated to the influence of dose and LET in an oxidizing atmosphere, and to a lesser extent, in an inert atmosphere. Data acquisition focused on a wide range of models or industrial polymers, such as saturated polyolefins, halogenated polymers, polyurethane, cellulose, etc. The data were compiled in a database named PRELOG.
-ray irradiation from 60Co or 137Cs sources was used to simulate
irradiation.Citation3 The degradation induced by
particles was simulated using swift heavy ions (GANIL, Caen).Citation4 For both types of radiation, dose-dependent gas yields were determined using a two-step procedure that is described in CitationRef. 4.
II.D.2. PRELOG Database
The PRELOG database was developed by a partnership between CEA and Orano. The objective was to collect published data related to polymer radiolysis and the results of the experimental program started in 2006 and conducted in CEA laboratories. Over 5000 G-values have been compiled. The data correspond to model polymers, formulated polymers, and industrial polymers. More recently, data relating to inorganic materials (cements, hydroxides, salts) and additives (plasticizer, stearate, etc.) have been added. Most of the data apply to hydrogen, but data for various gases—CH4, CO, CO2, HCl, and less often HF and SO2—and oxygen consumption can also be obtained.
The database is composed of the following tables:
1. Additive: This table collects data [Chemical Abstracts Service (CAS) number, chemical formula, molar mass, supplier, and so on] for the additives and inorganic materials. For additives used for polymer or cement, their functions are also precise: scavenger, plasticizer, etc.
2. Irradiation: This table contains irradiation conditions: source, type of particle, energy, stopping power, atmosphere, temperature, dose rate, etc.
3. Material: This table compiles the material definition of more than 900 materials: chemical composition (theoretical or measured), supplier, reference, and application for industrial materials. Some materials have also been pre-irradiated. Then dose and irradiation conditions are specified. For polymers, the chemical composition is defined using a subtable that contains the list and composition of monomers. Polymers are also attached to a family [for example, PE, PVC, poly(methyl methacrylate), etc.] using the subtable Polymer.
4. Yield: All the G-yield data are collected in this table.
5. Reference: This table contains information related to all the articles and reports compiled in the database. Currently, 380 documents are stored.
For simplicity, STORAGE uses a reduced database, and a specific interface was developed. The database query uses the following limited number of criteria:
1. type of polymer
2. inert (vacuum, helium, nitrogen, etc.) or oxidizing atmosphere (air, oxygen, etc.)
3. low LET (high-energy electrons,
particles,
Once data are chosen, additional information is displayed: type of irradiation, type of material (model, formulated or industrial), application for industrial materials (gloves, filter, etc.), and the reference. Dose-dependent yields are also available for numerous polymers.
II.E. Absorbed Energy
The global energy absorption is rather simple to estimate. For α and β radiation, it is assumed that all of the energy is absorbed within the package. For γ radiation, a fraction of the decay energy escapes from the package. This fraction depends mainly on the average density of the waste and on the package dimensions. It can be evaluated using simulation codes such as MCNPX,Footnotec TRIPOLI (CitationRef. 5), or PENELOPE (CitationRef. 6). Some tabulated values are also available through an additional Excel workbook.
Unfortunately, the global energy absorption is not sufficient to calculate a realistic rate of gas production. Indeed, waste is often composed of a mixture of materials that have different behaviors with respect to radiolysis. Estimating the energy absorbed by a particular material in the package is a major challenge. This quantity depends on the type of radiation and the composition and homogeneity of the waste. In some cases, for example, where materials are located outside a package containing radioactive sources, screening of the ionizing particles needs to be considered.
Frequently, the amount of energy absorbed by a material is taken to be proportional to the mass fraction of the materials. This approach is not always conservative because it underestimates the contribution of hydrogen-containing materials, such as polymers or hydrates. For α and β radiation, corrections based on Bragg’s rules are implemented in STORAGE to overcome this issue (see Sec. II.E.2).
In order to evaluate the rate of energy absorbed by the constituent , it is assumed that this quantity is proportional to the emitted power
:
where represents the fraction of energy absorbed by constituent
from
radiation of isotope
of the source
.
is expressed by the following formula:
where and
are the activity and mean energy from
radiation of isotope
, and
is a conversion factor.
STORAGE offers two possibilities to evaluate the parameters : external calculation and a homogenization module.
II.E.1. External Calculation
Through XML data formatting defined by STORAGE, the code can load dosimetry calculations implemented from external sources.
For radiation and for each source, constituent, and configuration, the quantities saved in the file are the ratio
where
is the weight of constituent
.
For radiation, the situation is more complicated because photon energy has to be considered. A generic energy grip is used: 0.015, 0.025, 0.0375, 0.0575, 0.085, 0.125, 0.225, 0.375, 0.575, 0.662, 0.85, 1.173, 1.25, 1.332, 1.75, 2.25, 2.75, 3.5, 5.0, 7.0, and 9.5 MeV. For each constituent, the quantities saved in the file are noted
; they depend on the source, the isotope, and the photon energy.
is calculated according to the formula:
where is a factor making it possible to take into account neighboring packages (
if the package is isolated), and
is the photon numbers of energy
emitted for each disintegration of isotope
.
II.E.2. Homogenization Module
In practice, a detailed description of the package interior is rarely possible. Nevertheless, based on available information it is concluded that the mixing inside the package is certainly not homogeneous. The waste can consist of different subassemblies with the same producer and conditioned in the same container, bag, or sleeves. The radiologic characteristics of the subassemblies can also vary. Although the waste remains imprecise, the user is able to exploit all the available information. To do so, STORAGE offers the possibility for the user to define as many constituents and sources as required and to define how the emitted energy of a source is deposited in a constituent. For each source/constituent pair, the user has to select a configuration from the following predefined list:
grain on surface
embedded grain
homogeneous mixture
heterogeneous mixture
no alpha irradiation
only gamma radiation.
The configurations Grain on surface and Embedded grain are used when the source is composed of fine particles distributed on the surface of the constituent (for example, plastic contaminated by PuO2 powder). The third configuration corresponds to spherical sources embedded in a matrix (for example, aggregates encapsulated in cement). This configuration is usually the default if the distribution of the sources and constituents is unknown, while the fourth configuration is restricted to mixtures of thick pieces (e.g., conditioning of activated metallic compounds).
The two remaining configurations describe shielding effects between the source and the constituent. For example, if the source is present in a plastic bag, it can be assumed that the constituents outside the bag are not irradiated by the particles emitted by the source. In this case, the configuration No alpha irradiation is selected. If the shielding of the
particles is efficient, the last configuration Only gamma radiation can be used.
STORAGE uses these configurations to estimate the deposited energy in the different materials.
For a given isotope of source
, the rate of absorbed energy of constituent
is given by the following formula:
where
| = | = a constituent of the spectrum of isotope | |
| = | = radiation type | |
| = | = emitted power | |
| = | = radiation energy | |
| = | = intensity of the |
This quantity depends on three parameters:
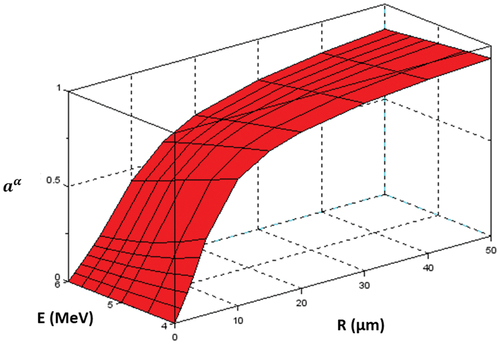
For particles,
has been calculated for the sources defined in STORAGE and for different energies using the code 3Dip (see Sec. II.F.1). shows an example of dependence of the calculated self-absorption coefficient on
-particle energy and source dimensions. The source is composed of spherical grains of PuO2.
Fig. 2. Variation of self-absorption coefficient with particle energy and PuO2 source radius.
Strictly speaking, the parameters ,
, and
depend on
and have to be calculated for each isotope
and each constituent of the spectrum. For simplicity, STORAGE calculates these parameters using the following mean radiation energy:
Then EquationEq. (1)(1)
(1) is rewritten as
where
and is the mean emerging
radiation energy from the source:
The parameters take the form
for
and
The calculation of parameters for the different radiation types and configurations are given in the following sections.
II.E.2.a. Particles
Except for the constituents for which the screening of particles is efficient (configuration Only gamma radiation), the fraction of
energy absorbed by a constituent is assumed to be proportional to its weight fraction
. However, a correction factor
is also used in order to account for the chemical composition of the constituent. The expression of the distribution coefficient is then
The correction factor is determined by assuming that in a mixture the energy absorbed by the constituent is proportional to its stopping power or LET. As particles lose their energy by interacting with matter, an average LET is calculated. For
radiation of initial energy
,
is expressed as
where is the range of
particles of energy
in constituent
, and
is the density of constituent
.
This results in the following expression of the correction factor:
where is the range of
particles of energy
in the mixture, and
is the density of the mixture.
For the configuration Only gamma radiation, by definition:
II.E.2.b. Rays
The fraction of energy absorbed by a constituent is assumed to be proportional to its weight fraction
:
The factor is assumed to be constant. It can be greater than 1 to consider the irradiation by the neighboring packages.
II.E.2.c. Particles
The evaluation of the parameter depends on the source-constituent configuration:
Grain on surface: For this configuration, it is considered that the sources are spherical and the contamination level of a material is proportional to its surface fraction. As the sources cover the surfaces, it is also considered that half of the released energy is deposited in the support. The other half of the energy is absorbed by the mixture, and the amount of energy deposited in a material composing the mixture is proportional to the volume it occupies. Finally,
2. Embedded grain: The assumptions are the same as for the preceding configuration. The only difference is that all of the released energy is assumed to be deposited in the support. Thus,
3. Homogeneous mixture: For this configuration, the corrective factor is formally identical for
and
4. Heterogeneous mixture: It is assumed that the amount of energy deposited in a material is proportional to the volume it occupies:
There is an exception to this rule if another constituent is in the Homogeneous mixture configuration with the source. In this case, this constituent
is assumed to be mixed with the source and
particles are absorbed by the constituent and the source.
irradiation of the constituent
is then assumed to be inefficient:
5. For the two remaining configurations, No alpha irradiation and Only gamma radiation, by definition:
II.F. Module
A specific numerical module (called the module) was also developed for the configurations Grain on surface and Embedded grain. The objective was to take into account the random distribution of sources within the waste and the depth dose profile of the
particles. This module is only of interest if dose-dependent G-values are available for the materials composing the waste.
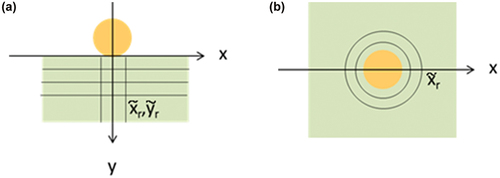
The configurations Grain on surface and Embedded grain require, respectively, one-dimensional and two-dimensional calculations (see ). The Embedded grain profile is radial and depends only on (distance from the sphere center) with the convention
at the grain surface. For Grain on surface, the profile is described using cylindrical coordinates
and
. The origin is the contact point between the sphere and the surface.
Fig. 3. Schematic representation of (a) Grain on surface and (b) Embedded grain configurations.
A simple mesh with a constant pitch of 0.5 µm is used for both geometries.
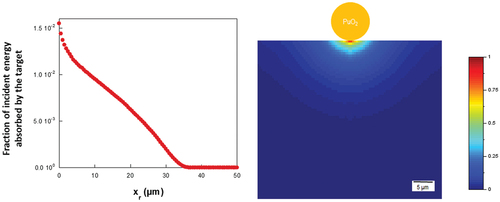
Since the local composition can change as a function of the time and dose, the simulation can be conducted with the code 3Dip. This code can evaluate at any time the dose profile and the total gas generation. In practice, this approach requires too much computing time if the number of materials or sources is greater than 10. Thus a simplified method was adopted by assuming that (1) the dose rate profile is independent of the time and (2) the profile for a given material can be calculated from a reference profile. Polyethylene with density 1 g·cm−Citation3 was chosen as a reference. The profiles for all the available sources in STORAGE and for different radius and energies have been calculated using the code 3Dip. Some examples are presented in for both configurations assuming a source of PuO2 that emits
particles with a mean energy of 5.5 MeV.
Fig. 4. Fraction of the incident energy absorbed by a PE target as a function of the depth for a spherical grain of PuO2 with a radius of 5 µm; α energy is 5.5 MeV.
As mentioned previously, it is assumed that the real profile of a material can be superimposed on the reference profile using a scale factor
. For an elementary volume marked by
[
for Grain on surface and
for Embedded grain], the absorbed energy rate profile is written as
where
| = | = radius of the source | |
| = | = density of the source | |
| = | = emitted power at time |
The reference profile depends on
.
The scale factor is determined by setting the range of particles in the constituent
,
, equal to the range
:
Finally, the rate of gas production from
radiation for a single grain of radius
is given by
where is the G-value of the constituent k for gas
production from
radiation, and
is the dose deposited at
in the elementary volume marked
:
where represents the mass of the elementary volume.
In the following sections, the 3Dip code and the Megrad module are presented briefly.
II.F.1. 3Dip Code
The objectives of this Monte Carlo program are (1) to calculate the fraction of the radiation energy absorbed by a source as a function of its composition, its density, its geometry, and its dimensions, and (2) to calculate the dose profiles at a depth in the target. For simplicity, only two simple geometries are used: spherical source and planar source. Moreover, the angular dispersion of particles is neglected. A preliminary study made it possible to check that this hypothesis has no impact on the global results of the simulation. Only the self-absorption calculation is briefly presented in the following.
First, the position in the source (marked by and the angle of emission
are randomly drawn (see insert in ). The energy of the α particles can also be sampled if necessary. Then the distance traveled by the particles in the source
is estimated by assuming a straight trajectory:
Fig. 5. Projected path curve of PuO2 calculated by SRIM.
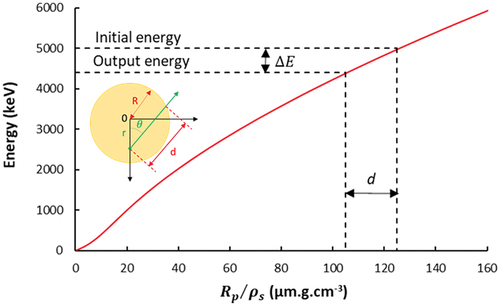
where is the grain radius.
The energy loss corresponding to the distance traveled in the source is determined from the projected path curve (see ) obtained using SRIM software.Footnoted,
Footnotee
Note: Atoms with an atomic number higher than 92 are replaced by uranium.
The coefficient (the average sum over
events) is calculated to a relative accuracy of 10−2:
If , the following approximate formula is used:
II.F.2. Megrad Module
This module was developed to calculate the contribution of sources in the configurations Embedded grain and Grain on surface by studying statistically the influence of the mass distribution on the different surfaces contaminated by the α source. Only the principles are presented here.
The total surface area is discretized in
identical elementary surface areas
The default value of
is 128. Each elementary surface area is associated with a material.
If the distribution of the α source is homogeneous, then the mass of source s, , on the elementary surface area
is simply
, with
varying between 1 and
.
The mass of the source is distributed randomly on the different elementary surface areas. For simplicity, the source here is assumed monodisperse with radius .
The number of grains on the elementary surface area is calculated using the relation:
where
| = | = mass of the source s deposited on the elementary surface area | |
| = | = volume of the spherical grain with | |
| = | = density of the source s. |
The model is based on assuming there is no interaction between two grains separated by a distance higher than , the range of
particles in constituent
. Their contributions are then additive. Conversely, when the grains are close to each other, some screening effects exist. Finally, a distinction is made between “Big grains” which could be considered as isolated sources and “Small grains” which will be modeled as a continuous layer covering the surface.
The maximum surface area contaminated by a population of Big grains is calculated assuming uniform triangular packing on the surface
where for the configuration Grain on surface (the grain is assumed to be in contact with only one surface) or
for the configuration Embedded grain (the grain is assumed to be between two surfaces).
The grains deposited on the surface are considered Big grains if
; if the opposite is true, the grains are considered Small grains. The threshold between Big grains and Small grains can be expressed as a function of surface density
. For example, for PE in the configuration Grain on surface with PuO2 as the source, critical surface density is 0.011 g·m−Citation2 for 1-µm grains, 1.1 g·m−Citation2 for 5-µm grains, and 37.7 g·m−Citation2 for 20-µm grains.
In the case of Big grains, the contribution of the surface area to the rate of gas
production is given by
where is given by EquationEq. (2)
(2)
(2) , and
is the constituent associated with the surface area
.
For Small grains, the corresponding is given by the following expression:
where
| = | = total mass of the source s | |
| = | = self-absorption coefficient of the grains with radius R | |
| = | = rate of energy emitted by the source s from | |
| = | = G-value of the constituent k for gas | |
| = | = mean dose deposited at |
The dose is estimated by assuming that the
energy is deposited in a layer of thickness equal to the range of α particles emitted by the source s,
:
The total rate of gas generation is the sum of all the elementary surface area contributions:
By performing several random draws, STORAGE determines the variation of . The final result is expressed as average, minimum, and maximum values.
To illustrate the relevance of this module, an example calculation assuming a mixture of PE and PVC is presented. The materials are composed of a 40-µm film and the radius of the grains is fixed at 2 µm. The calculations consider two levels of contamination: 0.02 g·m−Citation2 (Big grains) and 0.2 g·m−Citation2 (Small grains). gives the dose dependence of the G-value for both polymers.
TABLE I Hydrogen Yields of PE and PVC as a Function of the Dose
shows the time evolution of the hydrogen generation rate for two levels of contamination. The
is divided by the emitted energy rate
; this ratio is comparable to a G-value. As may be seen in the figure, the level of contamination influences the result mainly in the first decades.
Fig. 6. Time evolution of the apparent G-value, for different options: (black) without the
module, (red) 0.02 g·m−Citation2, (blue) 0.2 g·m−Citation2.
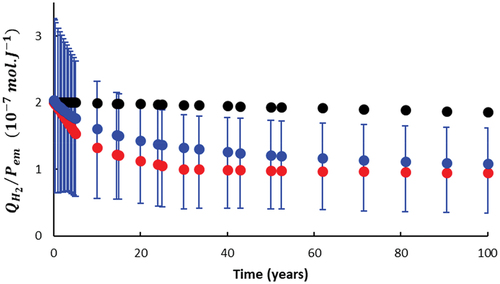
The error bars correspond to a calculation assuming random distribution of the contamination. The maximum and minimum values of the hydrogen rate were evaluated using 15 samplings. This simulation predicts significant data spread when the waste consists of materials with very different G-values. This assumption has been checked experimentally (see Sec. III.A).
Finally, the results of the calculation without the module are also presented. As may be seen in , in this case, the hydrogen rate decrease is very slow, confirming that the
-radiation dose can be significantly underestimated if the
module is not employed.
II.G. Gas Release
Once the gas production has been calculated, the rate of gas release is evaluated. Currently, STORAGE considers three simple situations:
closed package
open package
gas permeable package.
II.G.1. Closed Package
In this case, the rate of gas release is zero and the quantity of gas inside the packages,
is calculated by integrating the production rate:
For oxygen likely to be produced but also consumed, the previous expression becomes
where is the initial quantity of oxygen inside the package, and
and
are, respectively, the oxygen production and consumption rates.
Obviously, the quantity must remain positive. If it is negative, this means that the initial oxygen has been totally consumed. As a consequence,
.
II.G.2. Open Package
If no barrier can slow down gas diffusion, the rate of gas release is equal to the rate of gas production at any time:
II.G.3. Gas Permeable Package
Gases are assumed to pass through a hole or a porous filter, for example. Moreover, the outside transmission is assumed to be limited only by diffusion.
The differential equation for the inside partial pressure of gas ,
, is
where
| = | = diffusion coefficient of gas | |
| = | = exchange surface area between inside and outside | |
| = | = thickness | |
| = | = headspace volume. |
Graham’s law is used to evaluate the diffusion coefficient using hydrogen diffusion in air as a reference:
where
| = | = molar mass of gas | |
| = | = molar mass of hydrogen | |
| = | = hydrogen diffusion coefficient in air | |
| = | = ratio of the coefficient of hydrogen |
The quantity of gas inside the package
is calculated by integrating the production rate convoluted by the diffusive system response:
where is the characteristic time of the diffusive system for the gas
.
When steady state is reached (),
and
For oxygen, EquationEq. (3)(3)
(3) has the form
For the different configurations, using , the internal partial pressures and the gas composition can be easily evaluated.
II.H. Implementation Issues
Metric units are used to implement the calculation. For input and output management, some alternative units are also provided: g for masses; TBq, GBq, and KBq for activities; and years for time. LET and radiation energy are expressed for convenience, respectively, in MeV·µm−Citation1 and MeV. Particle range and grain radius are in µm.
STORAGE uses predefined time-step sizes that are small enough to not lose accuracy. An option is available to estimate the calculation errors by carrying out a calculation with twice as many time steps. Moreover, the user has the opportunity to complete the predefined time-step sizes.
STORAGE is developed in C++ with QT5.
III. QUALIFICATION AND VALIDATION
Before the use of STORAGE could be generalized, two preliminary procedures had to be undertaken. First the validity of STORAGE was tested by comparing experimental data to the results of calculation. This phase has been completed through the analysis of hydrogen generated by plastics contaminated by transuranic waste. Concerning the second phase, its objective was to check that the software can adequately reproduce the calculations performed by other numerical tools developed by Orano.
III.A. Transuranic Waste
Hydrogen generation of U,Pu-contaminated solid waste was measured to check the validity of the STORAGE modeling tool.Citation7 This work will be presented in detail in a dedicated paper. Only a summary is given here.
Twenty-one drums containing technological waste generated by glove-box operations from the Orano MELOX recycling plant (Marcoule, France). The materials were packaged in PVC sleeves placed in metallic drums (118 L). The waste contained a variable proportion of organic and metallic materials contaminated by PuO2 and UO2 as finely divided powder. The waste was categorized into four families:
organic waste containing mainly glove boxes, gloves, and bags
metallic waste containing metal parts made of molybdenum and depleted uranium wrapped in PVC bags
mixture of organic and metallic waste
filtering media derived from ventilation filters.
Hydrogen generation of these drums was measured for more than 1 year using a classical accumulation technique.
By means of available information for the different containers, a series of calculations using STORAGE was performed. The objective of this study was to predict as precisely as possible the production of hydrogen of these rather well characterized drums. Our approach was intended to be as realistic as possible and not necessarily conservative. presents the comparison between experimental and calculated hydrogen generation rates. The simulation and experimental results are clearly consistent. Moreover, we are pleased to note that the hydrogen emission calculated by STORAGE is also conservative for a majority of the measured drums.
Fig. 7. Experimental and modeled hydrogen production rate: ![]()
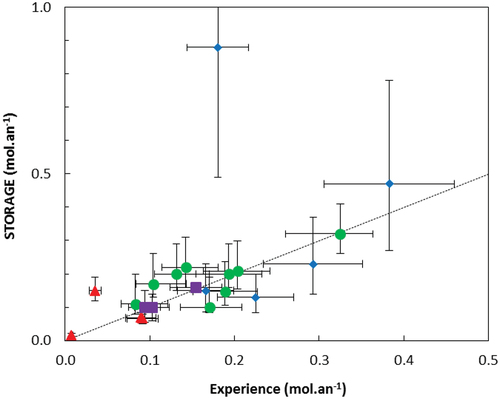
For one drum belonging to the Organic waste family, a large difference between the measurement and STORAGE is observed (blue diamond located in the upper side of the graph in ). As this drum is the oldest (it was packaged in 2004), it is assumed that its low hydrogen production is a consequence of its age. For old waste contaminated with PuO2, extensive dehydrogenation of plastics can be anticipated. Moreover, the degradation, which depends of the contact between the plastic and the grains, is certainly very localized and heterogeneous. Although numerous data of dose-dependent G-value are available in the PRELOG database, the data to describe this extreme situation are missing. As a consequence, it can be anticipated that the older the waste, the more conservative the STORAGE calculations will be.
A simple sensitivity analysis was also carried out for some drums containing waste composed of a mixture of organic materials and metals.Citation7 This analysis confirms that this type of waste is the most complicated to model because the final results are very sensitive to retained hypotheses. In this case, relatively good knowledge of the equipment constituting the waste is required.
III.B. Standard Compacted Waste Packages
For many years, Orano has been developing a reference procedure to calculate conservatively H2 and HCl generation in standard compacted waste packages (CSD-C or colis de déchets compactés). It is crucial to benchmark STORAGE with this reference.
The waste is composed of hulls and end pieces conditioned in cans, which are compacted. The resulting compacted disks are stacked in a standard stainless steel container. A CSD-C is usually filled with five to seven compacted discs. The package’s volume is close to 180 L, and its weight is approximately 700 kg. The average activity on the date of production is around 4.1 108 Bq/g of the package.
Besides hulls and end pieces, additional waste may be conditioned in a CSD-C, such as
hydrated zirconium molybdate [ZrO2(MoO3)2 3H2O]. This precipitate remains attached to hulls or is part of the “debris pot” that comes from dissolver rinsing
small quantities of organic materials in the form of Hypalon seals, paints, and stickers.
Hydrogen release is assumed to result from the radiolysis of water contained in zirconium molybdateCitation8 and organic materials, but also from the corrosion of the CSD-C inner metallic surfaces by HCl. This gas is generated by the radiolysis of chlorinated polymers, mainly Hypalon.
Absorbed energy rates for each type of radiation are calculated using the MCNP code and considering separately water, stickers, paints, and Hypalon seals. As stickers are placed on the disk lid before compaction, the screening of and
radiation is assumed to be complete. For
and
emissions, the calculations take account of the energies of the incident particles. For
particles, the emitted energy rate is absorbed by the waste constituents according to their mass percentage.
Concerning the total hydrogen production, global corrosion by HCl is considered using a conservative approach. HCl is assumed to induce corrosion of iron and stainless steel according to the following reaction:
As chlorine content is limited and the calculations are carried out over long periods (250 years), a decrease in the HCl generation rate can be predicted. A first-order integrated rate law is used to model chloride loss. The HCl production rate is then given by the relation
where
| = | = radiation power of type | |
| = | = initial G-value for HCl production | |
| = | = initial chlorine concentration (in mol·kg−Citation1). |
A detailed benchmark comparison between STORAGE and the results of previous calculations on standard CSD-C packages was carried out. Details of this study are confidential and beyond the scope of this publication. Only the main conclusions are provided.
The positive points for STORAGE that emerge from this comparison are as follows:
STORAGE allows more precise calculations since it uses the most recent databases. Moreover, the code facilitates updating calculations.
Evaluating the contribution of
The model of dechlorination was improved.
When the contribution of radiation is predominant, it is recommended to use an external calculation to evaluate the absorbed energy rate. In the case of CSD-C, with external calculations for
radiation, the results obtained by STORAGE are very close to those presented in the reference documents; the maximum difference is 4% for H2 and 15% for HCl.
IV. FURTHER WORK
As STORAGE estimations of hydrogen generation are consistent with previous calculations and with measurements performed on real packages, the use of this tool can be seriously considered for several nuclear waste packages that are among the most strategic for Orano and CEA.
In addition to constant improvements to the code to broaden its usership, new developments are planned to increase its scope, including the integration of new sources of gas generation such as long-term metallic corrosion and reaction with corrosive gas. A more accurate description of the radiolytic processes of the water contained in the cement matrix has also been undertaken.
Concerning gas release, additional models will be integrated to simulate release through a leak in both diffusion and permeation conditions or through a porous matrix as a function of the saturation conditions. Multibarrier diffusion is also relevant to some packages.
Long-term developments are as follows:
As the use of the tool is restricted to underground waste disposal, it could be interesting to model some other phases such as interim storage and the transport phases. This requires varying the environmental conditions: water availability (vapor or liquid), atmosphere (oxygen availability), and temperature.
The generation of hydrosoluble degradation products could also be incorporated in the STORAGE project. In addition to gas production, the software could implement the hydrolysis of cellulose and different radio-oxidized polymers.Citation9–11
It would be interesting to carry out new measurements on waste other than -rich waste, e.g., activated metallic waste with dominant
activities. Some experiments are being considered, but measurements of nuclear packages are rather complicated and time consuming. New data will not be available for some time.
V. CONCLUSION
Gas generation in ILW-LL waste is due to many processes. Among the waste packages handled by Orano and CEA, the most penalizing are those containing polymers as technological waste.
STORAGE was developed to enable the various situations encountered by producers to be taken into account when modeling the gas source term (especially hydrogen). Users have access to three dedicated databases:
packages database
materials database
G-value database named PRELOG.
The first database defines the dimensions and constituent materials of the container and the internal matrix. The density and composition of the materials are compiled in the second database. The data required are the type of package, activities, mass and possibly thickness of solids in the package, and start and end time of the computation.
The software proposes different options for a more or less detailed description of the waste. Different interactions of the radioactive sources and the materials can be defined to describe potential screening effects.
The mathematical model is of course a simplification of reality, and its acceptability can only be determined through testing against experimental data and comparisons with other numerical models. The first experimental test, which involved transuranic waste, was judged to be satisfactory. The benchmark with the reference calculation developed by Orano for CSD-C packages is consistent with the previous evaluation.
Acknowledgments
The authors acknowledge the society LITTERAL for implementing the code and their technical assistance in the development of STORAGE.
Disclosure Statement
No potential conflict of interest was reported by the authors.
Notes
e The Orano MELOX recycling plant (Marcoule, France) produces mixed-oxide fuel assemblies that are intended to supply light water reactors for electricity production.
References
- C. LAMOUROUX and F. COCHIN, “Study of Long Term Behavior of Intermediate Level Long Lived Waste Packages: An Overview of the R&D Approach and Results,” Procedia Chem., 7, 559 (2012); https://doi.org/10.1016/j.proche.2012.10.085.
- J. VIDAL et al., “CESAR: A Code for Nuclear Fuel and Waste Characterisation,” presented at the WM’06 Conf., Tucson, Arizona, February 26, 2006.
- M. FERRY et al., “Chemical Composition Effects of Methylene Containing Polymers on Gas Emission Under γ-Irradiation,” Nucl. Instrum. Methods Phys. Res., Sect. B, 334, 69 (2014); https://doi.org/10.1016/j.nimb.2014.05.007.
- M. FERRY et al., “Effect of Cumulated Dose on Hydrogen Emission from Polyethylene Irradiated Under Oxidative Atmosphere Using Gamma Rays and Ion Beams,” Radiat. Phys. Chem., 118, 124 (2016); https://doi.org/10.1016/j.radphyschem.2015.06.006.
- E. BRUN et al., “TRIPOLI-4®, CEA, EDF and AREVA Reference Monte Carlo Code,” Ann. Nucl. Energy, 82, 151 (2015); https://doi.org/10.1016/j.anucene.2014.07.053.
- J. SEMPAU et al., “An Algorithm for Monte Carlo Simulation of Coupled Electron-Photon Transport,” Nucl. Instrum. Methods Phys. Res., Sect. B, 132, 3, 377 (1997); https://doi.org/10.1016/S0168-583X(97.
- S. ESNOUF et al., “Hydrogen Generation from α Radiolysis of Organic Materials in Transuranic Waste. Comparison Between Experimental and Simulation Results,” Nucl. Technol., 208, 2, 347 (2022); https://doi.org/10.1080/00295450.2021.1896927.
- C. FOURDRIN et al., “Irradiation Effects in Hydrated Zirconium Molybdate,” J. Nucl. Mater., 426, 1, 38 (2012); https://doi.org/10.1016/j.jnucmat.2012.02.028.
- M. FERRY et al., “Alkaline Hydrolysis of Radio-Oxidized Aliphatic Polymers,” Radiat. Phys. Chem., 172, 108783 (2020); https://doi.org/10.1016/j.radphyschem.2020.108783.
- E. FROMENTIN et al., “Leaching of Radio-Oxidized Poly(ester Urethane): Water-Soluble Molecules Characterization,” Polym. Degrad. Stab., 128, 172 (2016); https://doi.org/10.1016/j.polymdegradstab.2016.03.007.
- J. COLOMBANI et al., “Leaching of Plasticized PVC: Effect of Irradiation,” J. Appl. Polym. Sci., 112, 3, 1372 (2009); https://doi.org/10.1002/app.29612.