
 ?Mathematical formulae have been encoded as MathML and are displayed in this HTML version using MathJax in order to improve their display. Uncheck the box to turn MathJax off. This feature requires Javascript. Click on a formula to zoom.
Abstract
Accident tolerant fuel (ATF) is expected to delay or prevent core damage by providing additional coping time under accidents involving loss of core cooling. The effect of extended coping time may vary depending on the plant response to accidents. Age-related component degradation that deteriorates plant performance over time could have an impact on the actual advantages of ATF. The potential safety benefits of two near-term ATF candidates, including Cr-coated Zr cladding and FeCrAl cladding, are assessed for a 2-in. loss-of-coolant accident with failed high-pressure safety injection using the dynamic event tree (DET) approach considering possible stress corrosion cracking of steam generator (SG) tubing under aging. The DET approach allows likelihood quantification of accident sequences leading to core damage, including stochastic variation of system response and human actions during accident mitigation.
The safety benefits of the selected ATF claddings in terms of additional coping time and the core damage frequency reduction rate under specified accident situations were quantitatively estimated. The results show that the deployment of the two selected ATF claddings is expected to lead to longer coping times and lower core damage frequency due to the wider safety margin to peak cladding temperature they provide. The safety advantages would be greater as SG tube degradation proceeds. Thus, the two ATF candidates would lead to less severe consequences in terms of likelihood of core damage and susceptibility to the SG tube degradation than UO2-Zr fuel.
I. INTRODUCTION
Since the Fukushima Daiichi accident occurred in 2011, there has been a growing need for the development of alternative nuclear reactor fuel systems with enhanced accident tolerance, referred to as accident tolerant fuels (ATFs). ATF is a nuclear fuel system that can endure active cooling loss in the reactor core for a longer time when compared to the conventional UO2 pellet fuel/zircaloy (Zr) cladding systems.Citation1 The various ATF concepts that have been proposed and developed by many countries generally can be categorized into near-term ATF and longer-term ATF based on their anticipated time of deployment.Citation2,Citation3 The near-term ATF includes coated Zr alloy cladding (e.g., Cr-coated Zr cladding), advanced steel cladding (e.g., FeCrAl cladding), and improved UO2 pellets (e.g., Cr2O3-doped UO2 pellets and Al2O3-doped UO2 pellets). Examples of the ATF concepts considered to be longer-term ATF are those with SiC cladding, uranium nitride pellets, and extruded metallic fuel.
In-depth study on the behavior of ATF candidates under possible accident situations plays an important role in the identification of their viability and future development direction. This research focuses on the evaluation of safety benefits of two near-term ATF candidates, namely Cr-coated Zr cladding and FeCrAl cladding, that are likely to be loaded in a reactor core within several years as minimal alterations are required to the current fuel system for their implementation.Citation4 In general, the ATF claddings are designed to decrease the rate and total amount of heat generated from cladding oxidation in high-temperature steam, lowering the rate of core temperature rise, delaying core degradation, reducing the threshold on the cooling, and consequently, providing the additional coping time required for accident mitigation.Citation5 The additional coping time leads to a reduction in core damage frequency (CDF), lowering the risks associated with reactor operation.
In recent years, extensive research has been conducted on simulations of plant response during accidents assuming the deployment of ATF candidates. The performance of ATF options, including Cr-coated Zr cladding and FeCrAl cladding, have been investigated during accidents such as loss-of-coolant accidents (LOCAs) and station blackouts.Citation6–13 These studies assessed the safety benefits of the selected ATF candidates by comparing the results of accident progression simulations, such as peak cladding temperature (PCT), coping time, and hydrogen generation, to those for the case of the currently used UO2-Zr fuel system. For a more detailed and comprehensive analysis of the ATF benefits, several worksCitation14–16 employed the dynamic event tree (DET) approach to model the dynamic response of the safety systems and operator actions during accidents. The DET approach allowed for the time-dependent probability quantification of accident sequences leading to core damage, considering the stochastic failure of systems and human actions to mitigate the accident.
The major safety advantages of the chosen ATF candidates over UO2-Zr during accidents involving core cooling loss identified from earlier studiesCitation6–16 can be summarized as follows:
Heat and hydrogen generation could be reduced due to improved cladding oxidation resistance.
The PCT limit would be increased due to enhanced material properties.
Additional coping time would be provided owing to a slower PCT rise and an increased PCT limit, allowing core damage to be delayed or prevented.
Overall, the CDF might be lowered.
The actual benefits resulting from additional coping time provided by ATFs are largely dependent on the response of the target plant under accident situations. For example, if there is a plant experiencing degraded performance of safety systems, transients would be faster so human operators would have a relatively shorter time for coping with the situation than when the safety systems can perform their intended functions without any loss of performance. Obviously, when there is a shorter coping time, the contribution of the extra coping time would be larger; in other words, ATF safety benefits in terms of the CDF reduction rate would be greater. In this respect, age-related component degradation that negatively affects the plant response over time could increase both reactor risks and ATF safety benefits by gradually adding a burden to safety systems and shortening the usable coping time of operators. Thus, it is necessary to consider component aging in the evaluation of ATF safety advantages for a more accurate and realistic assessment. In this study, steam generator (SG) tube aging was examined as an example of age-related component degradation.
Steam generators are essential components used in pressurized water reactors (PWRs) to transfer the heat generated in the reactor core to the secondary side to produce steam. The heat exchange takes place between the primary coolant flowing inside the SG tubes and the secondary coolant surrounding the tubes. SG tubes also play an integral safety role in separating the radioactive primary coolant and nonradioactive secondary coolant. Since the primary coolant is at a higher pressure than the secondary one, tube failures, such as leakage or rupture, can cause the contamination of the secondary loop, which may lead to radioactivity release into the environment.Citation17 To keep the radioactive coolant in the primary loop safely, SG tubes are required to be inspected periodically and repaired when needed.
According to operating experience, one of the most common degradation mechanisms found in SG tubes is stress corrosion cracking (SCC), which is described as the formation and propagation of cracks when susceptible material, a corrosive environment, and tensile stress are present. SG tubes suffering from this highly time-dependent degradation need to be repaired as required in order to prevent tube failures. The insertion of plugs into the degraded tubes is the most widely used corrective action since it is a permanent solution if done before the failure.Citation18 Both ends of the tube are blocked by plugs, so the reactor coolant is prevented from flowing inside the tube. The biggest problem of plugging is that it reduces the coolant flow and heat transfer area because the plugged tube is removed from service. This decrease would affect the plant response during accidents in a negative way, causing a reduction in coping time, and the impact would increase with time as more tubes are plugged. Hence, the plugged tube fraction can be considered as an indicator of SG tube degradation.
This study aims to evaluate the safety benefits of ATFs during accidents and how they change over SG operating time in consideration of SG tube degradation. A 2-in. LOCA without high-pressure safety injection (HPSI) was selected as the reference scenario to investigate the ATF safety benefits. Since the accident requires operators to take mitigatory actions within a certain amount of time to prevent core damage, the ATF benefits could be gauged as an increase in coping time. The gain in coping time is then used to yield a CDF reduction rate, taking account the likelihoods of accident sequences using the DET approach. The fuel systems under consideration in the study are two near-term ATF candidates, including Cr-coated Zr cladding and FeCrAl cladding, as well as the standard UO2-Zr fuel system. The safety benefits of these two ATF candidates are quantitatively assessed by comparing the additional coping times obtained for accident mitigation and CDF reduction rates considering SG tube degradation.
The rest of this paper is structured as follows. Section II deals with the prediction of SG tube degradation. Section III focuses on the evaluation of ATF safety benefits during a 2-in. LOCA with failed HPSI considering SG tube degradation. The ATF safety benefits regarding additional coping time and the CDF reduction rate are calculated and how the benefits change with the severity of SG tube degradation is assessed. Section IV provides the conclusions of this study.
II. ESTIMATION OF SG TUBE DEGRADATION
Before evaluating the ATF safety benefits in consideration of SG tube aging, the extent of tube degradation should be predicted first so that the degradation results can be incorporated into the assessment of ATF safety advantages. The age-related degradation of SG tubing can be predicted by tracking the tube integrity as a function of its operating time. This process is composed of selecting the target component and the aging mechanism for the analysis (Sec. II.A), defining the possible component states and identifying the states that could be regarded as the degraded states negatively affecting the plant response during accidents (Sec. II.B), constructing the component aging model to predict the magnitude of SG tube degradation with regard to its operating time (Sec. II.C), and implementing the constructed aging model to estimate the tube aging (Sec. II.D).
II.A. Selection of Target Component and Degradation Mechanism
Mill-annealed Alloy 600 (Alloy 600MA) SG tubing with the parameters shown in was selected as the reference component for this analysis. Operating experience has demonstrated that SG tubing made of Alloy 600MA is vulnerable to SCC, which accounts for 60% to 80% of all tube failures requiring repairs.Citation19 Particularly, axial SCC at the tube roll transition zone has been found to be the main contributor.Citation20,Citation21 Thus, axial SCC was assumed to be the main degradation mechanism compromising tube integrity in this study.
TABLE I SG Tube Parameters
The mechanism of SCC in Alloy 600MA has been explored in depth for a long time due to its importance to safety and frequent occurrence. The degradation process is normally divided into two stages: crack initiation and crack propagation. Despite much effort to develop a model to understand and predict SCC, there is no mechanistic model that accounts for the degradation behavior accurately due to the complexity and randomness involved in the process.Citation23 Instead, empirical models based on experimental data and operating experience are widely used for the prediction. This study approximated the crack initiation time using a set of temperature-dependent crack initiation time data.Citation24 Based on the data set, the logarithm of crack initiation time (hours) was estimated to follow a normal distribution with mean as 4.4764 and standard deviation as 0.5 at the operating temperature of 330°C.
The crack propagation model employed the Scott model,Citation25 which is a widely used empirical model estimating the crack growth rate for SCC dependent on the stress intensity factor around the crack tip, as seen in EquationEq. (1)(1)
(1) :
where
| = | crack dimension in the direction of crack growth | |
| = | crack growth amplitude | |
| = | crack tip stress intensity factor | |
| = | crack tip stress intensity factor threshold | |
| = | stress intensity factor exponent | |
| = | geometric factor | |
| = | crack tip stress. |
The crack tip stress induced by the pressure difference across the SG tubingCitation26 was calculated from
where is the tube mean radius and
is the tube wall thickness. The following equations were used to estimate the crack tip stressCitation27:
and
where
| = | = pressure burst | |
| = | = flow stress | |
| = | = ultimate tensile strength | |
| = | = yield strength. |
The crack growth parameters used for the calculations were assumed to follow uniform distributions, as shown in , and the geometric factor for the SG tubing was assumed to be a constant value of 0.93 (CitationRef. 22).
TABLE II SCC Crack Growth Parameters*
II.B. Definition of SG Tube States
The tubing/piping reliability, considering component failures due to age-related degradation, can be estimated using a state transition model that describes the continuous degradation process using multiple states from success to rupture.Citation29,Citation30 This model enables the prediction of component aging progression through the probabilistic estimation of each state at preset times. Assuming that repair of degraded tubes is only accomplished by plugging, the state transition model was set up including the plugging state, as shown in .
Fig. 1. State transition model for SG tube degradation (adapted from CitationRef. 31).
As shown in , the state transition model consists of four tube states, including the initial state, the crack state, the rupture state, and the plugging state. The initial state represents the state of a tube with no cracks. Once a crack initiates on the tube, it transitions to the crack state. As the crack grows, the tube in the crack state transitions to the rupture state when the depth of the crack eventually reaches the tube wall thickness. However, if the tube in the crack state is inspected and repaired before transitioning to the rupture state, it enters the plugging state. Since returning plugged tubes to service is not considered in this study, there is no transition from the plugging state to any other state.
Steam generator tubes in the rupture state and the plugging state could have a negative impact on plant safety. The number of SG tubes in these two states increases with time as they are the end states in the state transition model. SG tube rupture is one of the design-basis accidents for PWRs possibly causing core damage.Citation32 On the other hand, SG tubing in the plugging state is not considered as an initiating event (IE) leading to core damage, but as contributor to a decrease in coolant flow and heat transfer area. The degraded SG performance due to the reduced coolant flow and heat transfer area based on the plugged tube fraction keeps having an impact on the plant performance during normal operation and accident conditions. Thus, this study considers the plugged tube fraction to be an indicator of tube degradation.
II.C. Construction of SG Tube Aging Model
The SG tube aging model developed to predict the tube degradation over time consists of a SCC crack growth model and an inspection/repair model. The crack growth model, including the SCC initiation and propagation model, was used to estimate the size of cracks generated in SG tubes at each inspection cycle. To calculate the plugged tube fraction, it was combined with the inspection/repair model, which contains inspection frequency, sampling size, detection failure rate, and repair strategy.
The following assumptions were included in the tube aging model:
Only axial semielliptical cracks generating in the tube roll transition zone were considered for the crack growth model. The initial crack length was assumed to be 0.1 mm and the crack depth-to-length ratio was assumed to be 1:3 during crack growth.Citation22
Steam generators were assumed to be inspected by measuring the crack depth in the wall of the SG tubes at the end of each 2-year inspection cycle. Of the total number of tubes in each SG, 3%were assumed to be randomly sampled and inspected with a detection failure rate of 2% (CitationRefs. 22 and Citation33).
The inspected tubes were assumed to be plugged when the crack depth was larger than the repair limit, which is 40% of the tube wall thickness.Citation17 The repair was assumed to be done between the cycles.
The pressure difference ∆P in EquationEq. (2)
(2)
The calculation flowchart of tube state probability is displayed in . At the beginning of each cycle, the crack size was estimated by Monte Carlo simulation of the crack growth model. The crack initiation time was directly sampled from the probability distribution of the crack initiation time previously estimated, as described in Sec. II.A. For crack propagation, the crack growth rate was calculated by EquationEqs. (1)(1)
(1) through Equation(6)
(6)
(6) with the crack growth parameters sampled from uniform distributions with the characteristics shown in . If a tube that has a crack whose length is larger than 1.52 mm (equivalent to 40% of the tube wall thickness in depthCitation17) is randomly selected for inspection and the crack is successfully detected, the tube moves to the plugging state. If the crack length reaches 3.81 mm (equivalent to the tube wall thickness in depth), the tube transitions to the rupture state. In this way, the tube state at each cycle was decided and the process was repeated until the number of samples reached the target number. Finally, the state probabilities during each operating cycle were computed as the number of tubes in the states divided by the number of samples.
Fig. 2. State probability calculation flowchart.
II.D. SG Tube Degradation Results
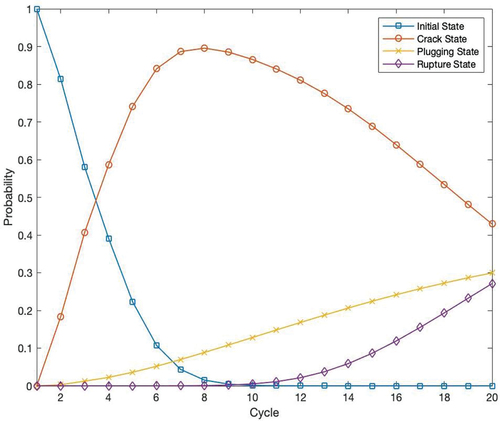
The SG tube state probabilities, including the plugging state probability, were estimated as a function of in-service SG cycles based on the procedure in . The number of cycles was 20, and the time interval for each cycle was assumed as 2 years. The number of samples for each cycle was 100 000. The tube degradation results without considering SG replacement are shown in . The initial state probability decreased with SG cycle, becoming zero after 11 cycles of use. It was evaluated that more than 40% of the tubes would have a crack on them after two cycles of use. The crack state probability increased until the number of tubes to be plugged and ruptured exceeded the number of tubes to be transitioned from the initial state to the crack state. The crack state probability decreased after reaching a maximum of 0.91 during the eighth cycle. The rupture state probability remained zero for the first seven cycles and started to increase from the eighth cycle, reaching 0.27 during the 20th cycle. The plugging state probability, which is of interest in this study, increased as the aging proceeded, reaching about 0.31 in the 20th cycle.
Fig. 3. SG tube state probability over cycle without SG replacement for Alloy 600MA.
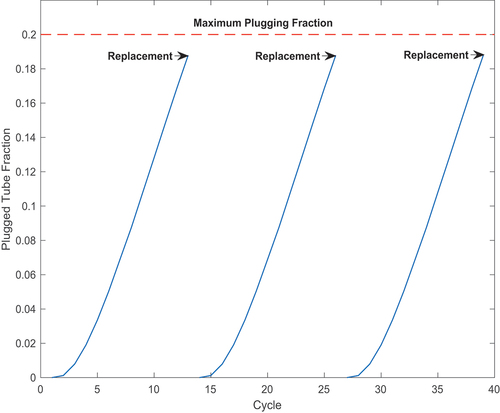
Given that the maximum fraction of plugged tubes should be limited to 15% to 25% to prevent a power reduction,Citation34 the maximum plugging fraction limit for this analysis was set to 20% and the SGs were assumed to be replaced before the fraction reaches the limit. The plugged tube fraction reached the limit during the 14th cycle; therefore, the SG replacement was evaluated to occur after 13 cycles of use. displays the tube degradation results considering SG replacement.
Fig. 4. Plugged tube fraction over cycle with SG replacement for Alloy 600MA.
III. ATF BENEFITS EVALUATION
The performance of the two selected ATF claddings (see Sec. I) during an accident related to active core cooling loss (Sec. III.A) was analyzed by simulating reactor system response (Sec. III.B) using the DET approach (Sec. III.C). The anticipated safety benefits from the deployment of the ATF claddings were evaluated, and the impact of SG tube degradation on the benefits was estimated (Sec. III.D).
III.A. Accident Scenario Description
As indicated in Sec. I, a 2-in. LOCA with failed HPSI was selected as the reference scenario to illustrate the ATF safety benefits considering SG tube degradation impact. shows a simplified event tree for a 2-in. LOCA. In this accident, the reactor coolant system (RCS) depressurizes slowly due to the small break size, so core uncovery may occur before the pressure decreases below the set points that allow the emergency core cooling systems (ECCS), such as the safety injection tank (SIT) and low-pressure safety injection (LPSI), to provide additional coolant to the reactor core.Citation35
Fig. 5. Simplified event tree for a 2-in. LOCA.
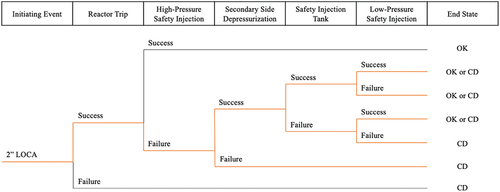
To lower the RCS pressure rapidly to the injection pressures of the ECCS, operators should perform secondary-side depressurization by manually opening an atmospheric dump valve (ADV) installed on the steam line connected to the SG (CitationRef. 36). Given that the secondary-side depressurization should be taken early enough so that the ECCS can inject water into the RCS and prevent core damage, the coping time, which is the maximum operator allowable time to initiate the action after the reactor trip, is an important factor in determining accident risks.
The coping time changes depending on the accident sequence, based on the ECCS availability due to possible different injection set point pressures. For example, a longer coping time is expected when the SIT is available than when only the LPSI is available because the SIT system can start injection at a higher RCS pressure than the LPSI system can. The degree of SG tube degradation is also a factor that affects the coping time. The SGs mainly provide cooling to the reactor core until the ECCS operates, so the coping time becomes shorter as the severity of SG tube degradation increases due to reduced SG cooling ability. Thus, after the occurrence of a 2-in. LOCA with failed HPSI followed by the successful reactor trip, the accident may evolve differently depending on how long SGs have been operating, how fast operators perform the secondary-side depressurization by opening the ADV, whether the SIT is available to operate upon demand or not, and whether LPSI is available to operate upon demand or not.
III.B. Simulation Modeling
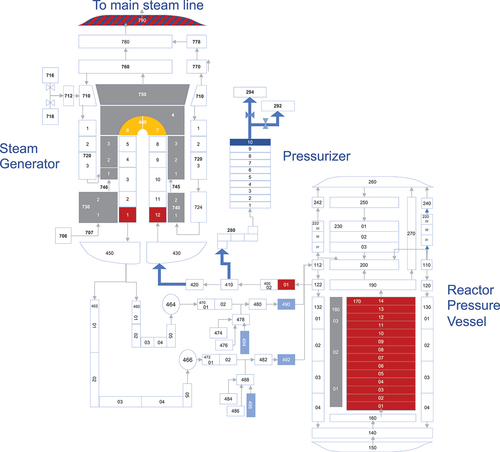
RELAP5 (CitationRef. 37), a best-estimate thermal-hydraulic code for transient simulation of light water reactor systems during postulated accidents, was used to simulate the reactor system response during a 2-in. LOCA without HPSI. A generic 1000-MW(electric) two-loop PWR with two hot legs, four cold legs, four reactor coolant pumps, and two SGs was chosen as the reference plant with the steady-state initial condition listed in . The scheme of the plant nodalization for the RELAP5 code is presented in . Please note that the figure shows only one loop of the two loops of the reference plant as they are identical.
TABLE III Steady-State Initial Condition of the Reference Plant
Fig. 6. RELAP5 nodalization of the reference plant.Citation38
The ECCS, which can provide makeup water to the RCS during the accident, consists of HPSI, the SIT, and LPSI. Since the HPSI system was assumed to be unavailable, the safety injection from the SIT and LPSI was the only cooling capability allowed in this model. The SIT system was modeled as four accumulator components that can start injection at an RCS pressure of 4.309 MPa, while the LPSI system was modeled as two trains with one pump per train that can begin injection when the RCS pressure is below 1.481 MPa (CitationRef. 39).
The two ATF candidates considered in this study are UO2 pellets with Cr-coated Zr cladding and FeCrAl cladding, which have similar core configurations as the currently used UO2-Zr fuel system. The ATF claddings were modeled by modifying the Zr cladding of the conventional fuel by adding a 20-μm chromium layer to the Zr cladding, while FeCrAl cladding was modeled by replacing the Zr cladding with the material properties of the FeCrAl alloy.Citation40,Citation41
In the LOCA analysis, the PCT limit of 1477 K prescribed in the Code of Federal Regulations, Title 10, Part 50.46 (CitationRef. 42) is normally used as the acceptance criterion for Zr cladding. Since the PCT acceptance criteria for ATFs have not been established, this study conservatively selected the acceptance limit for the Cr-coated Zr and FeCrAl claddings from the available experimental data,Citation43–45 as shown in . For the Cr-coated Zr cladding, the PCT limit was assumed to be 1578 K in view of a possible eutectic reaction between the Cr coating and the Zr cladding.Citation43,Citation44 The PCT limit for the FeCrAl cladding was assumed to be 1640 K, where FeCrAl oxidation switches from Al oxidation to Fe oxidation, which can lead to a sudden temperature increase,Citation45 without modeling the FeCrAl metal-water reaction. Core damage was assumed to occur when the hottest fuel rod temperature exceeds the PCT limit values.
TABLE IV PCT Failure Criteria
III.C. DET for Accident Sequence Generation
In this work, the DET approach was used for the evaluation of ATF safety benefits. Unlike traditional event trees, DETs use a time-dependent model of system evolution and branching conditions to determine the timing and sequence of system response, leading to a consideration of more comprehensive coverage of the sequences.Citation46 Multiple accident sequences concurrently start from an IE, and the sequences branch when the preset branching conditions are met.Citation47 This method is particularly useful when dealing with accident scenarios where the timing of events is important, like the reference accident for this study which demands operator action that needs to be performed within a certain amount of time to avoid core damage.
The RAVEN (CitationRef. 48) framework developed by Idaho National Laboratory was used as a driver software to perform the DET analysis. Linked with RELAP5, RAVEN generated accident sequences for RELAP5 with all the possible combinations of the branching parameters given in using the equally spaced grid sampling. The operator action to initiate the secondary-side depressurization by opening an ADV branches at time t = 5, 10, …, 3600 s after the reactor trip, with the branching probabilities sampled from a lognormal distribution with mean as 900 s and error factor as 5 (CitationRef. 49). The availability of the SIT and LPSI branch as available or unavailable when requested to operate, and the system unavailabilities were estimated using a Bernoulli distribution with the probability of 7.45E-6 and 3.92E-4, respectively.Citation50
TABLE V Branching Parameters and Conditions for DET
To incorporate the SG tube degradation impact into the RELAP5 model, the plugged SG tube fraction over SG cycle calculated in Sec. II.D (see ) was reflected as reduced SG ability. The coolant flow and heat transfer area were modeled to decrease by the rate at which the SG tubes are plugged.Citation51 Of the 13 SG cycles, only the odd number of cycles were sampled for DET branching in order to reduce the number of sequences to be simulated.
illustrates an example of accident sequences generated using the DET approach by RAVEN. The total number of sequences generated for each fuel type was 7 (odd SG cycles) × 720 (ADV opening times) × 2 (SIT available/unavailable) × 2 (LPSI available/unavailable) = 20 160. Each sequence was represented by the variables in the order of SG cycle (e.g., 1, 3, …, 13), ADV opening time (e.g., 5, 10, …, 3600), SIT operation (e.g., S for success and F for failure), and LPSI operation (e.g., S for success and F for failure). The coping time was estimated as the longest allowed ADV opening time in the sequences not causing core damage under the same conditions (e.g., same SG cycle and ECCS availability). For example, if sequence (1,t,S,S) does not lead to core damage but sequence (1,t + 5,S,S) does, the coping time is estimated as t seconds during the first SG cycle when both ECCSs are available.
Fig. 7. Example of accident sequences generated using the DET approach (OK: no core damage, CD: core damage, S: success, and F: failure).

Each generated sequence was associated with a conditional probability, so the conditional core damage probability (CCDP) during each SG cycle can be calculated by adding up the conditional probabilities of all sequences leading to the core damage given the occurrence of the IE during the SG cycle, i.e.,
and
where is the coping time during the SG cycle according to the SIT and LPSI availabilities, and
is the probability of the sequence (SG cycle, ADV opening time, SIT operation, LPSI operation). The CDF is calculated as
where is the CDF during the SG cycle and
is the IE frequency. The IE frequency was assumed to be constant with the SG cycle and fuel types. Therefore, the CCDP change rate between the SG cycles or fuel types can be regarded as the CDF change rate between the SG cycles or fuel types without the quantification of the IE frequency.
III.D. Results of Analysis
The results of the ATF safety benefits evaluation during a 2-in. LOCA with failed HPSI were analyzed: (1) without SG tube degradation (Sec. III.D.1) and (2) with SG tube degradation (Sec. III.D.2). The results without SG tube degradation were analyzed to show how SG tube degradation impacts the ATF safety benefits by comparing it with the results considering SG tube degradation.
III.D.1. Results Without Considering SG Tube Degradation
shows the evolution of PCT during the accident for each cladding. After the core starts to uncover about 2000 s after the accident, the core water level decreases quickly. The fuel temperature begins to increase about 2200 s after the accident. The core damage occurs (i.e., the hottest fuel rod temperature exceeds the PCT limit) 2840 s after the accident when the conventional Zr cladding is used without the secondary-side depressurization. As can be seen from , the initiation of core damage was delayed to 2930 s for the Cr-coated Zr cladding and 3035 s for the FeCrAl cladding, while core damage was evaluated to occur 2840 s after the accident for the conventional Zr cladding. The Cr-coated Zr cladding and the FeCrAl cladding extended the start of core damage by 90 and 195 s, respectively, when compared to the conventional Zr cladding. Since the two ATF concepts did not change the fuel pellets but only the cladding materials from the UO2-Zr fuel system, the PCT trend in time for the ATF claddings was similar to that for the conventional Zr cladding.
Fig. 8. PCT over time for different fuels without operator action.
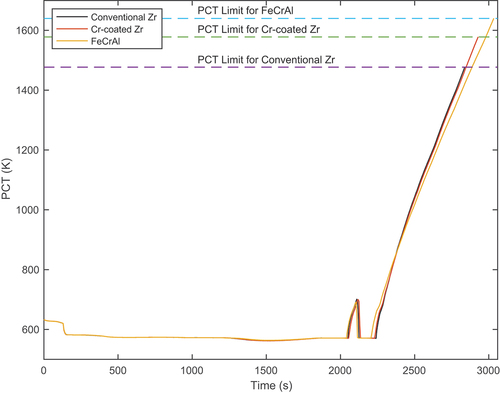
From it can be seen that the average PCT increase rates between 2200 and 2800 s after the accident for the conventional Zr, Cr-coated Zr, and FeCrAl claddings were 1.43, 1.41, and 1.34 K/s, respectively. When compared to the case of the conventional Zr, the Cr-coated Zr cladding lowered the PCT increase rate by 1.4% (from 1.43 to 1.41 K/s), while the FeCrAl cladding decreased the rate by 6.3% (from 1.43 to 1.34 K/s). In the case of the Cr-coated Zr cladding, the delay in core damage was mainly due to the PCT limit difference since there was only a difference in the PCT increase rate of 1.4%.
On the other hand, the delay in core damage in the case of the FeCrAl cladding resulted from the difference in the PCT increase rate as well as the difference in the PCT limit because the PCT increase rate was lowered by 6.3%. It is believed that the slight difference in the onset time of the PCT increase comes from the assumption that the mass of the FeCrAl cladding is the same as that of the Zr cladding. The overestimation of the mass of the FeCrAl cladding then should cause more heat to be absorbed into the cladding and transferred to the coolant, leading to an earlier core uncovery. Both of the ATF claddings showed improved cladding oxidation resistance in high-temperature steam, but the FeCrAl cladding was evaluated to have superior high-temperature oxidation resistance compared to the Cr-coated Zr cladding.
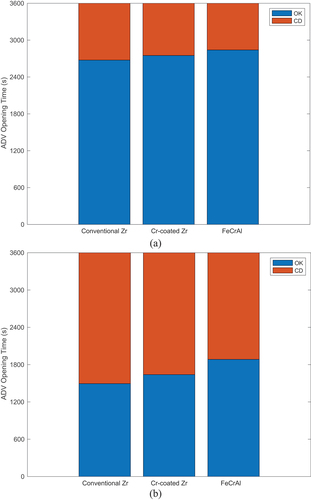
The coping time according to the availability of the ECCS is shown in . shows that when the SIT is available, the secondary-side depressurization by opening an ADV should be initiated within 2675, 2750, and 2840 s after the reactor trip to avoid core damage for the conventional Zr, Cr-coated Zr, and FeCrAl claddings, respectively, regardless of LPSI availability. When the SIT is unavailable and LPSI is available, the coping time was calculated to be 1495, 1640, and 1885 s to avoid core damage for the conventional Zr, Cr-coated Zr, and FeCrAl claddings, respectively (). In this case, a shorter coping time was provided to operators owing to the lower injection set point pressure of the LPSI system compared to the SIT system.
Fig. 9. Coping time for different fuels without SG tube degradation: (a) with SIT and (b) with LPSI (OK: no core damage and CD: core damage).
shows the estimated CCDP for each fuel type. The CCDP for the conventional Zr, Cr-coated Zr, and FeCrAl claddings were calculated to be 2.75E-3, 2.25E-3, and 1.77E-3, respectively. When the Cr-coated Zr and FeCrAl claddings were used, the CDF decreased by 18.30% and 35.76% compared to the situation when the conventional Zr cladding was used.
TABLE VI CCDP for Different Fuels Without SG Tube Degradation
III.D.2. Results Considering SG Tube Degradation
presents the coping time over the SG cycle for the different fuel types according to the ECCS availability. For both cases, the coping time provided by the ATF claddings becomes longer with the SG cycle. For example, with the SIT availability (), the extra coping times were 75 s (from 2675 to 2750 s) and 165 s (from 2675 to 2840 s) for the Cr-coated Zr cladding and the FeCrAl cladding, respectively, during the first SG cycle. The coping times increased to 130 s (from 2475 to 2605 s) and 240 s (from 2475 to 2715 s) during the last SG cycle.
Fig. 10. Coping time for different fuels with SG tube degradation: (a) with SIT and (b) with LPSI.
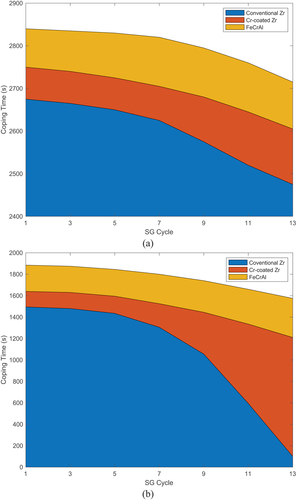
When the LPSI system is the only available ECCS (), the additional coping times were 145 s (from 1495 to 1640 s) and 390 s (from 1495 to 1885 s) for the Cr-coated Zr cladding and the FeCrAl cladding, respectively, during the first SG cycle. The times increased to 1110 s (from 100 to 1210 s) and 1475 s (from 100 to 1575 s) during the last SG cycle.
Thus, the impact of SG tube degradation on the coping time becomes greater when only the LPSI system is available than when the SIT system is available. This is because it takes longer for the RCS pressure to become the initiation condition of the LPSI than the SIT after the operator performs the secondary-side depressurization. In other words, the core cooling time relying on the degraded SG until the LPSI operates is longer than the other case.
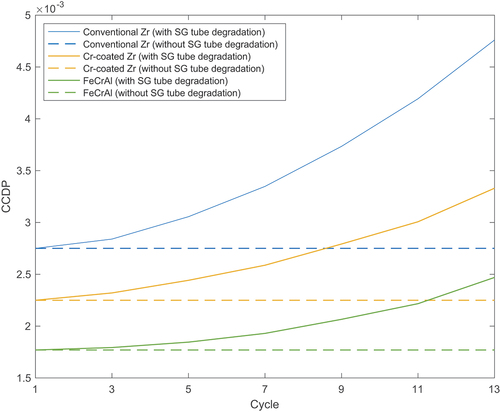
and present how the CCDP changes when considering the SG tube degradation impact. For all three fuel types, the CCDP increased with the SG cycle due to the coping time reduction resulting from the reduced SG ability. shows that the CCDP increase rates (i.e., CDF increase rates) for the conventional Zr, Cr-coated Zr, and FeCrAl claddings were ~73% (from 2.75E-3 to 4.76E-3), ~48% (from 2.25E-3 to 3.33E-3), and ~40% (from 1.77E-3 to 2.47E-3), respectively, from the first to the last SG cycle. The CCDP reduction rates (i.e., CDF reduction rates) achieved by the use of the Cr-coated Zr and the FeCrAl claddings also increased from ~18% (from 2.75E-3 to 2.25E-3) during the first SG cycle to ~30% (from 4.76E-3 to 3.33E-3) during the last SG cycle) and from ~36% (from 2.75E-3 to 1.77E-3) during the first SG cycle to ~48% (from 4.76E-3 to 2.47E-3) during the last SG cycle, respectively, as tube degradation proceeds when compared to the case of the conventional Zr cladding.
TABLE VII CCDP for Different Fuels with SG Tube Degradation
Fig. 11. CCDP for different fuels with and without considering SG tube degradation.
IV. CONCLUSION
The potential safety benefits of two near-term ATF candidates, including Cr-coated Zr cladding and FeCrAl cladding, were evaluated by simulating dynamic system response to a 2-in. LOCA with failed HPSI occurring in a 1000-MW(electric) two-loop PWR. Considering the SCC degradation of the SG tubing, the impact of tube aging on ATF safety benefits was also investigated. The SG tube aging model, consisting of a crack growth model and an inspection/repair model, was used to calculate the tube crack length and predict the tube integrity at each SG cycle. The extent of SG tube degradation was estimated throughout its whole cycle based on the plugged tube fraction. A RELAP5 accident simulation was carried out with the aid of RAVEN, which generates accident sequences for RELAP5 considering four branching parameters, including ADV opening time, SIT availability, LPSI availability, and SG cycle (see ), using the DET approach.
The results showed that the deployment of the two selected ATF claddings is expected to lead to longer coping times and lower CCDP because of the wider safety margin to PCT that they provide. Without considering SG tube degradation, the CCDP values for the conventional Zr, Cr-coated Zr, and FeCrAl claddings were calculated to be 2.75E-3, 2.25E-3, and 1.77E-3, respectively, as seen in . The values increased with the SG cycle by up to ~73%, ~48%, and ~40%, respectively, as shown in .
It should be pointed out that the additional coping time and the CCDP reduction rate (i.e., the CDF reduction rate) provided by the ATF claddings increased with SG operating time as well. The CDF reduction rates for the Cr-coated Zr and the FeCrAl claddings were estimated to be ~18% and ~36%, respectively, when there was no SG degradation (see SG cycle 1 in ). The rates escalated up to ~30% and ~48% as the SGs stay longer in operation (see SG cycle 13 in ), which indicates that the ATF safety benefits would increase with SG tube degradation severity. Therefore, it can be concluded that the use of the two ATF candidates would lead to better consequences in terms of likelihood of core damage and susceptibility to SG tube degradation than the UO2-Zr fuel.
It should be noted that this study does not include any discussion of uncertainties regarding initial input parameters. Although uncertain input parameters would affect the results presented in this paper, the uncertainty analysis was outside the scope of this study and only best-estimate values of parameters were used in that the purpose of this study is to demonstrate that the ATF safety advantages could increase with increasing severity of component degradation when compared to the conventional UO2-Zr fuel.
Acknowledgments
The work was partially supported by the U.S. Department of Energy Nuclear Energy University Program Grant 18-15276.
Disclosure Statement
No potential conflict of interest was reported by the authors.
References
- S. BRAGG-SITTON et al., “Advanced Fuels Campaign Light Water Reactor Accident Tolerant Fuel Performance Metrics Executive Summary,” INL/EXT-13-30226, Idaho National Laboratory (2014).
- M. KHATIB-RAHBAR et al., “Review of Accident Tolerant Fuel Concepts with Implications to Severe Accident Progression and Radiological Releases,” ERI/NRC 20-209, Energy Research Inc. (2020).
- “Accident Tolerant Fuel Concepts for Light Water Reactors,” TECDOC-1797, International Atomic Energy Agency (2016).
- “Project Plan to Prepare the U.S. Nuclear Regulatory Commission for Efficient and Effective Licensing of Accident Tolerant Fuels,” Version 1.1, ML19301B166, U.S. Nuclear Regulatory Commission (2019).
- K. TERRANI, “Accident Tolerant Fuel Cladding Development: Promise, Status, and Challenges,” J. Nucl. Mater., 501, 13 (2018); https://doi.org/10.1016/j.jnucmat.2017.12.043.
- L. J. OTT et al., “Preliminary Assessment of Accident-Tolerant Fuels on LWR Performance During Normal Operation and Under DB and BDB Accident Conditions,” J. Nucl. Mater., 448, 520 (2014); https://doi.org/10.1016/j.jnucmat.2013.09.052.
- K. R. ROBB, “Severe Accident Scoping Simulations of Accident-Tolerant Fuel Concepts for BWRs,” ORNL/SPR-2015/347, Oak Ridge National Laboratory (2015).
- J. J. POWERS et al., “ORNL Analysis of Operational and Safety Performance for Candidate Accident Tolerant Fuel and Cladding Concepts,” Proc. Technical Meeting Held at Oak Ridge National Laboratories, October 13–16. 2014 (2014).
- X. YU et al., “Preliminary Safety Analysis of the PWR with Accident-Tolerant Fuels During Severe Accident Conditions,” Ann. Nucl. Energy, 80, 1 (2015); https://doi.org/10.1016/j.anucene.2015.02.040.
- J. WANG et al., “Accident Tolerant Clad Material Modeling by MELCOR: Benchmark for Surry Short Term Station Black Out,” Nucl. Eng. Des., 313, 458 (2017); https://doi.org/10.1016/j.nucengdes.2017.01.002.
- Z. MA et al., “Evaluation of the Benefits of ATF, FLEX, and Passive Cooling System for an Enhanced Resilient PWR Model,” INL/EXT-19-56215, Idaho National Laboratory (2019).
- “Accident-Tolerant Fuel Valuation: Safety and Economic Benefits,” Technical Report, Electric Power Research Institute (2019).
- Z. GUO et al., “Uncertainty Analysis of ATF Cr-Coated-Zircaloy on BWR In-Vessel Accident Progression During a Station Blackout,” Reliab. Eng. Syst. Saf., 213, 107770 (2021); https://doi.org/10.1016/j.ress.2021.107770.
- C. PARISI et al., “Risk-Informed Safety Analysis for Accident Tolerant Fuels,” INL/CON-19-53223, Idaho National Laboratory (2020).
- D. MANDELLI et al., “Dynamic PRA Methods to Evaluate the Impact on Accident Progression of Accident Tolerant Fuels,” Nucl. Technol., 207, 3, 389 (2021); https://doi.org/10.1080/00295450.2020.1794234.
- A. SHAH et al., “Dynamic Probabilistic Risk Assessment Based Response Surface Approach for FLEX and Accident Tolerant Fuels for Medium Break LOCA Spectrum,” Energies, 14, 9, 2490 (2021); https://doi.org/10.3390/en14092490.
- P. E. MACDONALD et al., “Steam Generator Tube Failures,” NUREG/CR-6365, INEL-95/0393, U.S. Nuclear Regulatory Commission (1996).
- K. C. WADE, “Steam Generator Degradation and Its Impact on Continued Operation of Pressurized Water Reactors in the United States,” U.S. Energy Information Administration ( Aug. 1995).
- J. DOUGLAS, “Solutions for Steam Generators,” EPRI J., 20, 3 (1995).
- D. R. DIERCKS et al., “Overview of Steam Generator Tube Degradation and Integrity Issues,” Nucl. Eng. Des., 194, 1, 19 (1999); https://doi.org/10.1016/S0029-5493(99)00167-3.
- V. N. SHAH et al., “Assessment of Primary Water Stress Corrosion Cracking of PWR Steam Generator Tubes,” Nucl. Eng. Des., 134, 199 (1992); https://doi.org/10.1016/0029-5493(92)90139-M.
- R. LEWANDOWSKI et al., “Implementation of Condition-Dependent Probabilistic Risk Assessment Using Surveillance Data on Passive Components,” Ann. Nucl. Energy, 87, 696 (2016); https://doi.org/10.1016/j.anucene.2015.07.035.
- Z. ZHAI et al., “Material Condition Effects on Stress Corrosion Crack Initiation of Cold-Worked Alloy 600 in PWR Primary Water Environments,” M3LW-19OR0402037, Pacific Northwest National Laboratory (2019).
- D. FERON and R. W. STAEHLE, Stress Corrosion Cracking of Nickel Based Alloys in Water-Cooled Nuclear Reactors, Woodhead Publishing (2016).
- P. M. SCOTT, “An Analysis of Primary Water Stress Corrosion Cracking in PWR Steam Generators,” Proc. NEA/CSNI-UNIPEDE Specialist Mtg. on Operating Experience with Steam Generators, Brussels, Belgium (1991).
- L. CIZELJ and B. MAVKO, “Propagation of Stress Corrosion Cracks in Steam Generator Tubes,” Int. J. Press. Vessels Pip., 63, 1, 35 (1995); https://doi.org/10.1016/0308-0161(94)00046-L.
- S. MAJUMDAR et al., “Pressure and Leak-Rate Tests and Models for Predicting Failure of Flawed Steam Generator Tubes,” NUREG/CR-6664, ANL-99/23, Argonne National Laboratory (2000).
- F. DI MAIO et al., “Condition-Based Probabilistic Safety Assessment of a Spontaneous Steam Generator Tube Rupture Accident Scenario,” Nucl. Eng. Des., 326, 41 (2018); https://doi.org/10.1016/j.nucengdes.2017.10.020.
- K. N. FLEMING et al., “Treatment of Passive Component Reliability in Risk-Informed Safety Margin Characterization,” INL/EXT-10-20013, Idaho National Laboratory (2010).
- S. D. UNWIN et al., “Physics-Based Stress Corrosion Cracking Component Reliability Model Cast in an R7-Compatible Cumulative Damage Framework,” PNNL-20596, Pacific Northwest National Laboratory (2011).
- A. GULER et al., “Methodology for the Incorporation of Passive Component Aging Modeling into the RAVEN/RELAP-7 Environment,” Trans. Am. Nucl. Soc., 111, 920 (2014).
- L. OBRUTSKY et al., “Overview of Steam Generator Tube-Inspection Technology,” CINDE J., 35, 2, 5 (2014).
- C. YINGYING et al., “Analysis of Radiological Consequence of SGTR Accident at PWRs,” Radiat. Prot. Bull., 31, 6, 1 (2011).
- “Final Environmental Impact Report Diablo Canyon Steam Generator Replacement Project,” A.04-01-009, California Public Utilities Commission ( Aug. 2005).
- M. KIM and S. HAN, “Variability of Plant Risk due to Variable Operator Allowable Time for Aggressive Cooldown Initiation,” Nucl. Eng. Technol., 51, 1307 (2019); https://doi.org/10.1016/j.net.2019.02.016.
- J. HAM et al., “RCD Success Criteria Estimation Based on Allowable Coping Time,” Nucl. Eng. Technol., 51, 402 (2019); https://doi.org/10.1016/j.net.2018.10.023.
- “RELAP5/MOD3.3 Code Manual Volume II: User’s Guide and Input Requirements,” NUREG/CR-5535/Rev P5-Vol II, Information Systems Laboratories (2016).
- J. KIM et al., “Dynamic Risk Assessment with Bayesian Network and Clustering Analysis,” Reliab. Eng. Syst. Saf., 201, 106959 (2020); https://doi.org/10.1016/j.ress.2020.106959.
- D. A. FYNAN et al., “Cooldown Procedure Success Criteria Map for the Full Break Size Spectrum of SBLOCA,” Nucl. Eng. Des., 326, 114 (2018); https://doi.org/10.1016/j.nucengdes.2017.09.022.
- Y. YAMAMOTO et al., “Development and Property Evaluation of Nuclear Grade Wrought FeCrAl Fuel Cladding for Light Water Reactors,” J. Nucl. Mater., 467, 2, 703 (2015); https://doi.org/10.1016/j.jnucmat.2015.10.019.
- A. SHAH et al., “Coping Time Analysis for Chromium Coated Zircaloy for Station Blackout Scenario Based on Dynamic Risk Assessment,” Proc. 15th Probabilistic Safety Assessment and Management Conf. (PSAM 15), Venice, Italy (2020).
- Code of Federal Regulations, Title 10, “Energy,” Part 50.46, “Acceptance Criteria for Emergency Core Cooling Systems for Light-Water Nuclear Power Reactors,” U.S. Nuclear Regulatory Commission (1984).
- H. CHEN et al., “Application and Development Progress of Cr-Based Surface Coating in Nuclear Fuel Elements: II. Current Status and Shortcomings of Performance Studies,” Coatings, 10, 9 (2020); https://doi.org/10.3390/coatings10060560.
- J. BRACHET et al., “High Temperature Steam Oxidation of Chromium-Coated Zirconium-Based Alloys: Kinetics and Process,” Corros. Sci., 167, 108537 (2020); https://doi.org/10.1016/j.corsci.2020.108537.
- A. GURGEN and K. SHIRVAN, “Estimation of Coping Time in Pressurized Water Reactors for Near Term Accident Tolerant Fuel Claddings,” Nucl. Eng. Des., 337, 38 (2018); https://doi.org/10.1016/j.nucengdes.2018.06.020.
- T. ALDEMIR, “A Survey of Dynamic Methodologies for Probabilistic Safety Assessment of Nuclear Power Plants,” Ann. Nucl. Energy, 52, 113 (2013); https://doi.org/10.1016/j.anucene.2012.08.001.
- A. HAKOBYAN et al., “Dynamic Generation of Accident Progression Event Trees,” Nucl. Eng. Des., 238, 3457 (2008); https://doi.org/10.1016/j.nucengdes.2008.08.005.
- A. ALFONSI et al., “RAVEN Theory Manual,” INL/EXT-16-38178, Idaho National Laboratory (2020).
- C. QUERAL et al., “Dynamic Event Trees Without Success Criteria for Full Spectrum LOCA Sequences Applying the Integrated Safety Assessment (ISA) Methodology,” Reliab. Eng., 171, 152 (2018); https://doi.org/10.1016/j.ress.2017.11.004.
- “Shin Kori 1&2 Final Safety Analysis Report,” Korea Hydro & Nuclear Power Corporation (2018).
- P. PLA et al., “Simulation of Steam Generator Plugging Tubes in a PWR to Analyze the Operating Impact,” Nucl. Eng. Des., 305, 132 (2016); https://doi.org/10.1016/j.nucengdes.2016.05.002.