
 ?Mathematical formulae have been encoded as MathML and are displayed in this HTML version using MathJax in order to improve their display. Uncheck the box to turn MathJax off. This feature requires Javascript. Click on a formula to zoom.
Abstract
Microreactors present promising opportunities to open new nuclear energy markets. However, it is expected that the economic competitiveness of this new class of reactors will hinge on potential cost reductions via mass production. It is therefore critical to begin assessing important considerations for the factory production of microreactors. An overview of the important aspects of the general layout of a microreactor factory, along with best practices to be incorporated early in the design process, is provided in this study. Then, a detailed use case is considered and modeled using a dedicated tool that can map workflows and activities within a factory. The end product is a 242 000 sq. ft. factory model that can ramp up production from 10 to 100 units per year.
Based on the activities and workflows needed, cost estimates for equipment and staffing needs are generated. These are expected to be first-order estimates, but would still provide guidance on the level of investment needed to reach mass production levels of microreactors. Furthermore, the potential cost reductions from scaling production are quantified. It was found that for a 100-unit factory throughput, reductions above 70% per unit cost relative to a prototype demonstration, could be observed for tasks conducted within a factory. These estimates focus solely on component fabricated at a factory and do not account for fuel costs nor any site activities. Because the analysis is design specific, not all findings are expected to be applicable across different microreactors (notably larger varieties), but it still provides a foundation establishing the basis for the mass production of these reactors.
I. INTRODUCTION
Nuclear microreactors might offer a paradigm shift in the nuclear industry. By virtue of their radically smaller outputs [typically less than 20 MW(electric)], microreactors can target smaller, remote markets, and even mobile applications. Their smaller size can also lead to simplifications in manufacturing, testing, safety requirements, deployment, and financing options. However, their small power output per unit will result in a lack of economies of scale, hindering their economic competitiveness. This will likely only be compensated for if effective gains from mass producing this reactor class can be mastered.[Citation1] This paper aims to evaluate key considerations for establishing a mass production capability for a hypothetical microreactor.
The mass production of units within a factory can enable high-volume production to serve relatively large markets. Quality assurance can be more readily satisfied under factory conditions, and cost reductions can be expected from scaling productions and leveraging resources (staff, equipment, etc.) more efficiently. Factories can also be designed to be flexible in throughput, scaling with demand as needed (as will be evaluated in this paper). Studies have pointed out that gains in efficiency have been minimal (or even negative) in the field of construction in the United States for the past several decades,[Citation2] but have been much stronger in areas such as manufacturing.[Citation3] All classes of nuclear reactors may benefit from shifting activities to the factory,[Citation4] with this being particularly pertinent to microreactors.
A plethora of academic research papers have already been published on the topic of nuclear reactor factory fabrication, mainly focusing on small modular reactors (SMRs) rather than microreactors. Maronati[Citation5] and Mignacca and Locatelli[Citation6] provide comprehensive literature reviews of the economics of SMRs with a focus on modularity. With the significant cost and schedule overruns in recent nuclear power plant construction, the smaller size of SMRs (both in terms of power rating and physical plant size) and their modularity are intended to enable more activities to be performed at a factory and not onsite. Moving activities off site has been known to bring several benefits, including lower labor costs, improved productivity, and construction efficiency, as well as what is much needed in nuclear construction: reduced risk of cost and schedule overruns. This approach is commonly referred to in the nonnuclear construction management industry as prefabrication, preassembly, modularization, and off-site fabrication and its benefits are well documented in the nonnuclear industry (e.g., Refs. [Citation7–9]), as well as the nuclear industry (e.g., Refs. [Citation5,Citation10–12]).
Conducting activities within a factory would ensure standardization (which is desirable from an economics perspective and also because it is challenging to license several designs); it would streamline management, supervision, and inspections (indirect costs are among the largest contributors for larger reactors[Citation9]); and it would help avoid the risks of rework. Standardization has been proposed by multiple studies (e.g., Refs. [Citation10,Citation13,Citation14]) as an antidote to various problems in past nuclear construction, including continuous design changes even during construction and the misalignment among various stakeholders.
Compared to SMRs, microreactors are expected to have even less onsite activities, with a larger proportion of tasks conducted in a factory setting. Indirect costs, which are key contributors to larger reactor costs,[Citation15] are also expected to be less prevalent for microreactors. Overall, factory fabrication is expected to prove essential in order for microreactors to achieve competitive costs and significant market penetration. This underlines the need to evaluate factory fabrication considerations for microreactors more thoroughly. It is expected that the outcome of this study may also be applicable to several SMR subsystems/components that require factory assembly. The key difference will be in the proportion of activities conducted in a factory versus at the site.
While several microreactor developers have likely already conducted some level of factory fabrication assessment, limited information has been shared publicly. Similarly, several SMR manufacturers have shared some high-level insights into their mass production plans,[Citation16] however these are very limited. This study aims to provide an open and detailed account of mass production considerations for microreactors. The findings, however, are expected to be applicable to larger classes of reactors as well.
The main purpose of this study is to help guide developers as they consider steps beyond first-of-a-kind demonstration. This paper starts by providing an overview of typical factory fabrication considerations, then conducts an evaluation of various possible microreactor factory configurations, comparing them from economic and regulatory standpoints. A more detailed evaluation of mass production considerations and the process for establishing good design principles is then discussed. This provides the foundation for a detailed design of a microreactor factory layout for a particular design use case, including mapping of the factory and tasks at every workstation, along with some initial cost/resource estimates. The potential market for microreactors could be substantially large, but with significant uncertainties associated with the market sizes.[Citation17] To account for these uncertainties, two throughput levels for the factory are considered. Finally, this then provides the basis for evaluating the evolution in unit cost in an attempt to quantify the benefits from the mass production of nuclear reactors.
II. OVERVIEW OF FACTORY FABRICATION CONSIDERATIONS
While microreactor factories are likely to have unique considerations due to their potential complexity and regulatory requirements, it is important to consider general experiences and best practices in mass production. This section provides some background on factory production in nuclear and nonnuclear industries, discusses important design considerations to facilitate mass production, and introduces the various assembly line layouts that are currently used. Finally, high-level microreactor-specific considerations are examined from a production layout and regulatory standpoint.
II.A. Background on Factory Fabrication
The success of microreactors will depend on the ability to scale production and cut costs. Microreactor production facilities, or factories, are therefore critical for this endeavor. Nuclear microreactor factory considerations will primarily depend on the manufacturing specifications of microreactors, such as material requirements, production rates, machinery, safety and quality control requirements, and licensing requirements. While ideally all activities related to microreactor production should be performed at an offsite factory, significant technological and regulatory barriers must be resolved before such a production line can be achieved.
Therefore, a microreactor factory will likely evolve from current factories that produce safety-critical components like reactor vessels, to a more general factory where fuel loading and testing can be performed in addition to fabrication and assembly. Given the very early stage of the microreactor concept with uncertainties in their market sizes, demands, costs, and regulations, it is challenging to determine these specifications, and therefore to envision what a microreactor factory might look like. A detailed international market analysis conducted by Ref. [Citation17] found that build rates in hundreds of microreactors units annually in the 2040s and thousands in the 2050s may be theoretically achievable. This is conditional on microreactor developers being able to overcome technological, regulatory, and economic barriers.
An additional layer of complexity associated with the mass production of microreactors relates to the tradeoff between standardization and customizability for microreactor deployment.[Citation18] While traditional reactors cater to one specific market, namely, the grid, microreactors are expected to target a wide variety of markets,[Citation17] each with drastically different requirements (for instance, military versus island versus mining versus Nordic regions, etc.). This will inevitably lead to some form of a balancing act; in order to reach the economies of volume needed to reduce costs, microreactor concepts will need to cater to a wide variety of markets. This need for customizability will likely clash with a need to standardize designs to reap the most benefit from factory manufacture. Some level of compromise will be needed with vendors likely opting for a base design that is held constant across concepts, while enabling different variants for other components.[Citation18]
In order to gain a rough understanding of a microreactor factory, it is useful to consider existing factories making similar products. The nuclear industry has limited experience in mass production in a factory, mainly stemming from fuel fabrication and used fuel cask production. The production rates and the relatively small size of these products allow for factory production. Most major nuclear systems are either assembled onsite (e.g., reactor vessels) or completely stick built onsite (e.g., containment buildings), which has been one of the primary reasons behind the cost and schedule overruns in new builds. Newer nuclear power plants, such as SMRs and microreactors, are designed with the intention of being predominantly factory produced.
Although there are very few commercial products (e.g., existing nuclear power plants) that are as complex, safety critical, and potentially capital intensive as microreactors (the defense sector is not considered here due to a lack of public access to information), some commercial products do have similarities in certain aspects. presents rough order of magnitude production rates, costs, and factory sizes corresponding to three products that may have similarities with future microreactor production: used fuel dry storage casks, commercial jet engines, and automobiles. The table highlights the spread in production rates, with used fuel casks being the lowest and automobiles the highest. Used fuel casks are a good example of mass production in the nuclear industry; dry casks for used nuclear fuel storage and transportation (especially Type B casks[Citation19]) have very strict reliability requirements imposed by the U.S. Nuclear Regulatory Commission (NRC), and do not have a very large demand (when compared to jet engines or automobiles). Therefore, they are least likely to fully leverage the efficiencies of mass production in . The first few versions of microreactor factories might, therefore, bear similarities to the current used fuel cask factories.
TABLE I Products Currently in the U.S. Market that May Be Similar to Microreactors in Terms of Unit Cost and Manufacturing Specifications
Used fuel cask have significant safety and reliability requirements, including radiation shielding, criticality control, and structural integrity under severe accidents.[Citation19] However, they are composed of far fewer parts (likely a few hundreds of individual parts, and more importantly, no moving parts; see Ref. [Citation20] for a description of the HI-STAR 100 cask design that is representative of the used fuel casks currently under use) than modern jet engines, which consist of tens of thousands of individual parts.[Citation21] Jet engines are also governed by stringent regulatory requirements[Citation22] imposed by the U.S. Federal Aviation Administration and are designed for intense thermal, mechanical, and vibrational hazards, and subject to stringent testing and inspection. Their components also have relatively complex geometries.
Dry casks consist of metal or concrete cylindrical shells (e.g., outer enclosure and canister shell) or plates (e.g., fuel baskets or closure plates) that are welded or bolted together. Jet engines, on the other hand, are carefully optimized for performance. This leads to relatively complex geometries (e.g., see Ref. [Citation23] for a review of jet engine fan blade geometries) and more custom fabrication needs. Despite these challenges, jet engines are still mass produced in factories with streamlined supply chains and manufacturing systems. This is primarily due to consistently high demand and decades of experience in their production. As the market demand, and consequently the production rate, of microreactors increases to high hundreds and low thousands a year, commercial jet engines could be a suitable model to emulate for their factory production. (See for approximate production rates of these products and how requirements compare with microreactors.)
In the much longer-term, microreactor mass production could aspire to reach the rates of production seen in automotive factories. With almost a century of technological progress in automobile production, they are now produced in very large factories with a high degree of automation and production rates of hundreds of thousands a year, as shown in . If the advantages of mass production in microreactor factories are to be leveraged to the fullest extent, lessons learned from the automotive space should be sought. However, reaching such production levels for microreactors can only materialize with sufficiently large market size (and significantly low prices per units) as well as significant regulatory reform.
Given the vast advantages to be gained through them, mass manufacturing and factory fabrication are significant pieces of the strategy of several advanced reactor vendors, especially for SMRs and microreactors. While SMRs will likely be partially manufactured in a factory, the microreactors of the future (such as the fission batteries described in Ref. [Citation24]) will be almost fully manufactured in a factory and shipped to a site for installation. They may be manufactured like an automobile or an aircraft, whose parts (e.g., chassis, engine, electronics) are manufactured individually and then assembled in a factory. Efficiently manufacturing microreactors therefore will be one of the most important drivers of their market success.
II.B. Key Considerations for Mass Production
Other industries have gained substantial experience with factory fabrication best practices that can be directly applicable to microreactor productions. Indeed, entire standards compile best approaches in this area.[Citation25] This is expected to be a continual improvement process with new lessons always fed back into factory practices. A more detailed account of some of the key lessons learned from mass productions in other industries is provided in the Appendix. This includes a discussion of key design principles that enable efficient manufacture Sec. A.I), the different types of possible assembly layouts (Sec. A.II), lean design principles (Sec. A.III), approaches to reduce system complexity (Sec. A.IV), good design principles (Sec. A.V), and an overview of the well-established Advanced Product Quality Planning (APQP) methodology (Sec. A.VI). A brief summary of these various sections is provided here.
Transitioning from building reactors stick built onsite to a factory-based approach could leverage numerous improvements in manufacturing methods that are much more readily applied in a factory setting:
Tolerances can be controlled much more closely in a factory setting then measured and cut onsite. The improved tolerance control allows for better repeatability from one unit to the next and reduces the amount of inspection required at assembly.
Machine tools have greatly improved tolerance control over historical capabilities. This allows for parts to be fabricated and assembled without resorting to past practices of shimming or match drilling to achieve the required tolerances.
Current standard practices in other industries have been progressively moving away from inspecting quality to controlling processes to ensuring defective parts are never produced. Real-time process monitoring and control are key enablers of this shift.
Repeatable quality builds are not possible without a simple, elegant design. Manufacturers in other industries have come to realize that engineering must not only provide designs that meet functional requirements but also manufacturing requirements. Manufacturing capabilities must be taken into account in the early design phases.
Expanding on point 4, it is important to recognize that design decisions cast the largest shadow on final costs of a product, as explained in Sec. A.I. This has led to important methodologies, referred to as design for manufacturing (DFM) and design for manufacturing and assembly (DFMA). These practices ensure that a component and system are easy to manufacture/assemble prior to any tooling activity, at which point changes would be cost prohibitive.[Citation26]
Translating these design objectives into actionable outcomes can be conducted using Lean Design® Scoring, described in Sec. A.II. This is a scoring mechanism that uses some experientially based “rules of thumb” for design that improve the manufacturability and ease of assembly (i.e., producibility of a system). These rules include reduction of complexity and good design principles, and are described in Sec. A.III and A.IV, respectively. These methodologies were developed by Munro and Associates and are documented in Ref. [Citation26]. It is important to note they are based on the experience of Munro and Associates and should be considered one approach among a range of others that could be adopted to achieve the DFM and DFMA goals.
Once these best design principles are established, it is important to evaluate the optimal assembly process in a factory setting. This is outlined in greater detail in Sec. A.II. The three main approaches are (1) static line, (2) moving line, and (3) indexing line. In a static line, the process is stationary with parts, technicians, and tools brought to the line (e.g., aerospace). In a moving line, the process is continuously moving in sync across workstations (e.g., automotive industry). At each workstation, an operator stands ready to complete specific tasks prior to the product moving to the next station.
Indexing lines come in many variants (rotary versus linear, synchronous versus asynchronous). The asynchronous linear indexing line (which will be leveraged in this study) is similar in nature to a moving assembly with the notable exceptions that the product stops at each workstation. As a result, products do not need to move in sync with one another. Buffers can be implemented whereby a station can proceed to a new unit even if stations downstream have not completed the previous unit (this type of assembly is typical in bottling and packaging processes). Each of these types of assemblies have various advantages and disadvantages, which are discussed in greater detail in Sec. A.II.
Finally, the entire design and manufacture process is typically tied together into a framework referred to as APQP. This is commonly used in nonnuclear manufacturing sectors and draws parallels to the current quality control regulations in the nuclear industry. It consists of a standardized set of quality requirements that enable suppliers and manufacturers to design a product that meets all necessary quality and reliability requirements. APQP ensures the quality strategy is clearly understood and translated into requirements, technical specifications, and special characteristics. Additional information on the framework is provided in Sec. A.VI.
II.C. Envisaging Microreactor Factories
While many insights can be gained from existing factories, microreactors will undoubtedly raise new and unique challenges. These are discussed in this subsection. First, general regulatory and licensing considerations are introduced. These then are leveraged to inform the various possible layouts for a microreactor factory and their corresponding advantages/limitations.
II.C.1. Background on Regulatory and Licensing Considerations
Current NRC regulations were developed with traditional, large light-water reactors in mind. Most of the currently operating reactors are licensed under Title 10, “Energy,” Part 50, Domestic Licensing of Production and Utilization Facilities,” of the Code of Federal Regulations (10 CFR Part 50),[Citation27] which prescribes a two-step licensing process requiring a construction permit for the site prior to starting construction and an operation license before operation commences. The reactor itself requires a design certification. In 1989, the NRC issued Title 10, “Energy,” Part 52, Licenses, Certifications, and Approvals for Nuclear Power Plants” of the Code of Federal Regulations (10 CFR Part 52),[Citation28] which enables the issuance of a combined construction and operation license (COL) for the operation of the plant (a design certification is still needed). However, very few COLs have been issued so far since new nuclear construction and license applications have severely dropped since the 1990s.
Both the current pathways, through 10 CFR Parts 50 and 52, are focused on large light water reactor technology. The NRC is currently developing Title 10, “Energy,” Part 53, CFR Part 53, “Risk Informed Technology-Inclusive Regulatory Framework for Advanced Reactors,” (10 CFR Part 53)[Citation29] which is intended to be more technology inclusive, but is still geared toward large reactors and not microreactors.[Citation30] The NRC is currently discussing strategies for streamlining the licensing of microreactors and focusing on issues such as enhanced standardization and manufacturing licenses.[Citation31] However, no rulemaking has begun that focuses specifically on microreactors. Therefore, the first microreactors will likely have to be licensed in a similar fashion as large reactors.
The NRC has also issued regulations regarding manufacturing licenses in the past, but they were never implemented by reactor vendors. Reference [Citation30] presents a summary of the NRC regulations on manufacturing licenses and recommendations for the future licensing of microreactor factories. Appendix M of 10 CFR Part 50[Citation27] describes rules for issuing a manufacturing license, which would be a part of a construction permit and would include transportation of the manufactured reactor to the operating location.
Under 10 CFR Part 52, the NRC has included Subpart F, “Manufacturing Licenses,”[Citation28] that, unlike Part 50, requires applicants to submit a final safety analysis report and inspections, tests, analyses, and acceptance criteria for the manufacturing license. To obtain a manufacturing license under this pathway, a COL is required. Under 10 CFR Part 53, the NRC is also developing Subpart E, “Construction and Manufacturing Requirements,”[Citation32] that will contain manufacturing license regulations. At the time of writing, it covered factory manufacturing of microreactors, including quality control, receipt of fuel in the factory, and post-manufacturing testing and inspection. Most of these regulations refer back to existing regulations, for example, 10 CFR Part 50 Appendix B[Citation27] for quality control. However, as rulemaking is currently under way, uncertainty still exists on major issues, such as fuel placement in a factory and startup testing. It is currently unclear if a manufacturing license under 10 CFR Part 53 will cover these issues.
Another important aspect in microreactor production is the fuel manufacturing facility (or a fuel factory). These facilities, generally referred to by the NRC as fuel cycle facilities (these include mining, enrichment, and fabrication facilities), are currently licensed by the NRC under Title 10, “Energy,” Part 70, “Domestic Licensing of Special Nuclear Material,” of the Code of Federal Regulations (10 CFR Part 70).[Citation33] These facilities can be categorized into Category I (most stringent, with highly enriched uranium fuel), Category II [less stringent with high-assay low-enriched uranium (HALEU) fuel with >10% enrichment], and Category III (least stringent with low-enriched uranium and other fuel with enrichment <10%) facilities.[Citation33]
II.C.2. Overview of Possible Microreactor Production Lifecycle Scenarios
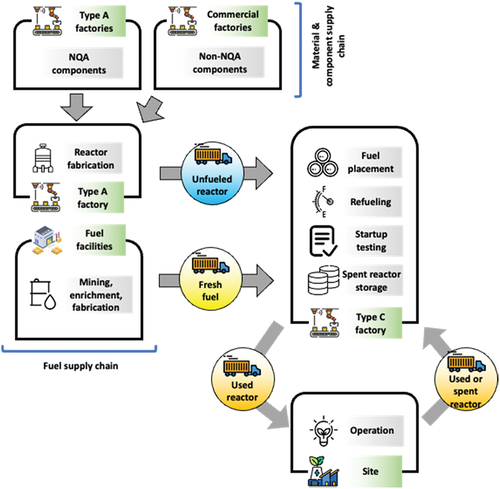
In order to better concretize the regulatory considerations from the previous subsections to microreactor factories, this section postulates on potential production lifecycle scenarios of microreactors. The purpose is to identify the various phases of evolution of microreactors, microreactor factories (which are examined in depth in Secs. III and later), and their regulatory and economic requirements. The various possible production lifecycle scenarios (hereafter referred to as production scenarios and shown in through ) illustrate the different locations (factories and sites), transportation types (fresh fuel, unfueled reactor, reactor with fresh fuel, and reactor with used fuel), activities performed offsite at factories and onsite, including fuel fabrication, reactor fabrication (in case it is manufactured in a factory), plant construction, fuel placement in the core, startup testing, operation, refueling, maintenance, and temporary used fuel storage. The production scenarios were developed under the following assumptions:
They are conceptual, and therefore idealized; the purpose is to highlight the different location “nodes” where most of the microreactor production activities would be performed and to identify their various stages of development.
Activities that are common to all the production scenarios, regardless of the reactor type or size (e.g., assembly, site preparation), are not presented in the figures.
For all the production scenarios, it was assumed that a permanent used fuel storage solution option does not exist, and the used fuel and reactor will be temporarily stored at the site of the manufacturing or servicing facility.
The type of production scenario a developer might follow also depends on its business model, supply chain, and economic, policy, and regulatory environments at the time of development.
Fig. 1. Current large reactor production scenario.
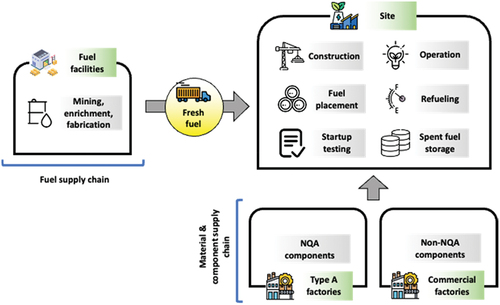
Fig. 2. SMR production scenario.
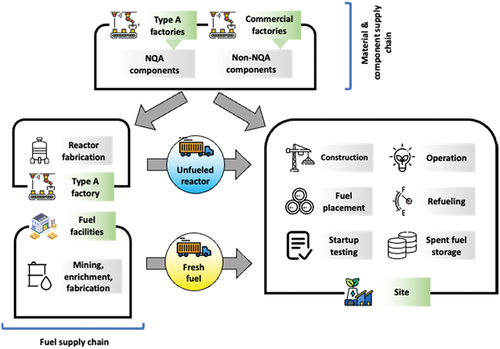
Fig. 3. First-generation microreactor production scenario.
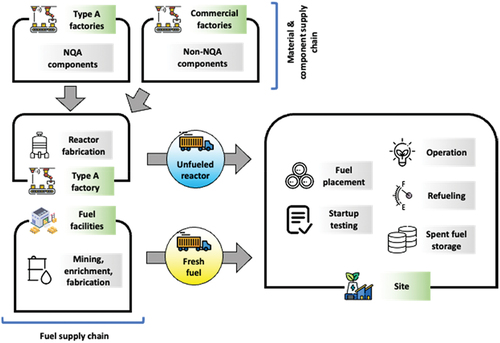
Fig. 4. Second-generation microreactor production scenario.
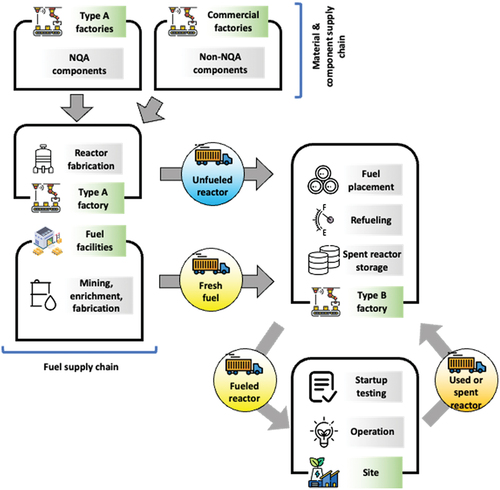
Fig. 5. Third-generation plug-and-play microreactor production scenario.
A description of each of the production scenarios is presented here, along with their regulatory and economic aspects, which are also summarized in . These production scenarios are also described in Ref. [Citation34].
TABLE II Summary of the Regulatory and Economic Aspects Involved in the Described Microreactor Production Scenarios
II.C.2.a. Current, Large Reactor Production Scenario
This scenario is representative of current, large reactors, where most of the activities, including construction, testing, refueling, and temporary used fuel storage, are all performed onsite, and the plant is essentially stick built (). Fuel is fabricated in a fuel fabrication facility and is shipped to the site, where it is loaded into the reactor core. Existing regulations are designed mainly for this production scenario.
II.C.2.b. SMR Production Scenario
This scenario is representative of upcoming SMRs, where many of the reactor components are integrated and standardized into a single, factory-manufactured module, while the rest of the plant is constructed onsite (). Other aspects and regulations are similar to the current state of practice: the reactor is shipped to the site unfueled, and fuel is fabricated in a dedicated facility and shipped to the site, where it is loaded into the core. The standardized reactor is manufactured in a factory, referred to here as Type A.
These factory types do not host any nuclear material; they therefore only require Nuclear Quality Assurance 1 (NQA-1) certification and would not be directly licensed by the NRC. This type of arrangement is similar to the factories that currently produce safety-related equipment. This production scenario is intended to improve economics through factory manufacturing of the reactor into separate modules that can be assembled onsite. However, such modularity is limited to the reactor itself, and the rest of the plant is still constructed/installed onsite. This production scenario can be executed under current regulations.
II.C.2.c. First-Generation Microreactor Production Scenario
This scenario is likely the most feasible near-term production scenario for microreactors under the current regulations (). It is similar to that of SMRs, except that a larger portion of the activities is shifted from the site to the factory. Nonreactor components, such as power generation equipment, would likely be produced and assembled at a Type A factory before being shipped and installed at the site. Like SMRs, the fuel and reactor are fabricated in separate facilities and shipped to the site.
The microreactors that follow this production scenario are likely to be stationary and operated at a single site throughout their lifetime. Since this production scenario is not far from the current state of practice, it is likely to have the least regulatory risk among all the possibilities for microreactors, and therefore the likeliest route for the first generation of microreactors.
II.C.2.d. Second-Generation Microreactor Production Scenario
As demand grows and the production rates of microreactors increase, more activities may be performed offsite at a factory (). A new type of factory, referred to as Type B, would accommodate most of these activities, including fuel receipt and loading, etc. It will likely require a manufacturing license under 10 CFR Part 53.[Citation32] The reactor and fuel would still be produced at a Type A factory and a fuel facility, respectively. Both would then be shipped to a Type B factory for final assembly.
These factories may be collocated but would need to be licensed separately to delineate nuclear and nonnuclear activities. Moving most activities (except startup testing involving criticality) to an NRC-licensed Type B factory would add fixed costs but reduce the labor costs incurred at each site. Key startup testing activities that involve taking the reactor to criticality would still be performed at the site. This production scenario represents the transition of microreactors to more plug-and-play and mobile configurations that may be operated at multiple sites in their lifetime.
II.C.2.e. Third-Generation Plug-and-Play Microreactor Production Scenario
This scenario represents the culmination of microreactor development to plug-and-play reactors or fission batteries, such as those envisioned in the Fission Battery Initiative[Citation24] (). All manufacturing, assembly, and startup testing activities (even those involving criticality) are performed offsite in what is referred to as a Type C factory (the microreactor may be shipped to multiple sites before refueling). This would be analogous to integral testing conducted in other industries for quality assurance (e.g., testing a jet engine at a factory before installation in an aircraft). Unlike the second-generation scenario, startup testing involving criticality would be performed at the Type C factory. This would minimize site startup testing, but might not eliminate it entirely (for example, diagnostics and testing to ensure that the reactor is safe to operate after transportation). With a lack of clarity on manufacturing licenses under current regulations, a two-step licensing process or a COL would be required for a Type C factory.
Additionally, since the microreactor would have achieved criticality in the factory during testing, transportation of the reactor to the site would have to conform to used fuel transportation regulated by 10 CFR Part 70.[Citation33] A Type B packaging for a microreactor (which currently does not exist) would be required. These issues will likely result in increased factory costs relative to a second-generation production scenario. Progress in technology and licensing regulation, along with increasing demand for microreactors, may render this scenario more cost effective. With sufficiently large production volumes, these fixed factory costs could be amortized over time. The arrangement could broaden the appeal of microreactors to potential users who would otherwise be apprehensive of leveraging nuclear energy for their needs.
For the purposes of this study, a factory model based on the first-generation production scenario is considered. This is likely the most viable near-term option for microreactor vendors. Furthermore, the findings are still expected to be applicable to second- and third-generation production scenarios with distinct reactor factories that are not collocated with fuel handling or criticality testing (i.e., Type A). As a result, the study presented here only considers the assembly of a reactor at Type A facilities, with all fuel handling and startup testing activities conducted elsewhere.
III. MICROREACTOR USE CASE AND MODELING METHODOLOGY
There are various types of microreactors under consideration. The two most common types being pursued are gas-cooled and heat pipe–cooled concepts. However, the Microreactor Applications Research Validation and Evaluation (MARVEL) reactor was selected for this study.[Citation35,Citation36] It is a NaK-cooled kilowatt-range system. While it is not entirely representative of the wide range of concepts pursued by the industry, it is an ideal use case due to its relatively open-source nature, design maturity, and intended use for research applications. Its relative size is representative of a smaller subclass of microreactors intended for space applications (typically referred to as fission surface power). In addition to its size, its fuel, coolant, and power conversion types are atypical of some of the commercial microreactor concepts being pursued. Nevertheless, most of the factory-related findings from this use case are still expected to be applicable to the other microreactor variants. In this study, three cases were compared: a one-off prototype, factory production with a throughput of 10 units/year, and a factory throughput of 100 units/year.
III.A. Background on MARVEL Reactor
MARVEL is a test microreactor intended to serve as a test bed that generates electricity and high-grade heat for various research and development efforts. A wide range of possible end-user applications is envisaged for the reactor. These could include testing advanced control features, demonstrating nuclear-based cogeneration of heat and electricity, providing critical operational data for training, and validating advanced codes. The reactor is planned to be sited at the Transient Reactor Test (TREAT) facility at Idaho National Laboratory (INL) and is currently targeted to be operational in 2024.
MARVEL is a 100-kW(thermal) NaK (sodium-potassium eutectic)–cooled reactor coupled to four Stirling engines for power conversion. The reactor utilizes uranium zirconium hydride, also called Training, research, isotopes, General Atomic (TRIGA) fuel. Both beryllium metal and oxide forms are used as reflector material to minimize the initial fuel loading. Four safety-related control, drums and a defense-in-depth central control rod are used for reactivity control and emergency shutdown. Four intermediate, open-pool, lead heat exchangers separate the power conversion units from the NaK coolant. An illustration of the reactor is provided in .
Fig. 6. Three-dimensional rendering of the MARVEL internals showing the control drums (three stacked cylinders), reflectors (blue), and the four Stirling engines (top of reactor); taken from the MARVEL project.
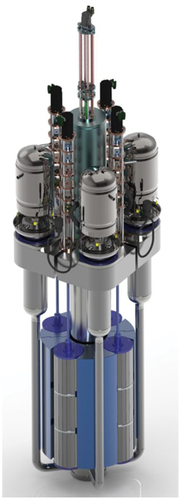
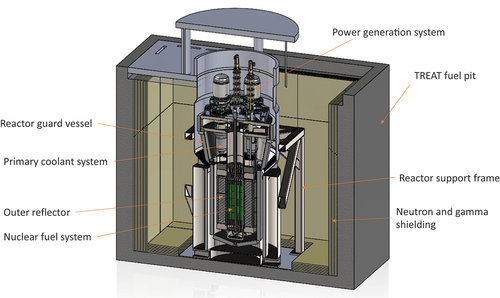
The reactor core and primary coolant system in are contained within the outer shell, which is contained within the guard vessel, suspended by the reactor support frame. The reactor structure is housed inside the TREAT fuel pit with shielding plates protecting the concrete from neutron/gamma damage. visualizes the overall arrangement and the relative complexity of the system.
Fig. 7. Cutout view of the MARVEL reactor and structure as housed within the TREAT pit; taken from the MARVEL project.
A summary of some of the key specifications for the reactor can be found in , which contains information regarding the overall reactor specifications, the fuel, the reflector, the control system, power conversion units, etc.[Citation35,Citation37]
TABLE III MARVEL Design Variables Leveraged in the Analysis of This Report*
Additional information on the MARVEL design can be found in Refs. [Citation35–37]. It is important to note that the MARVEL reactor is not intended for commercial operation. Rather, the main driving criterion for design consideration was technology readiness. Therefore, it is intentionally not expected to be cost competitive. It is also not designed to be transportable, unlike various other concepts being pursued by industry. Nevertheless, the design still holds many common features with commercial microreactors, and its overall size is expected to be comparable. Detailed computer-aided design (CAD) models of the reactor were made available for the purposes of this study alongside the most up-to-date work breakdown structure. However, due to the sensitive nature of aspects of the project, these cannot be made publicly available.
III.B. Factory Modeling Methodology
The detailed MARVEL design was leveraged as a use case for the factory fabrication evaluation. Its design features were used as inputs into Design Profit® software, as described in this section. The various best practices in the Appendix were implemented as practically achievable. No redesign of the MARVEL reactor was conducted, apart from simple changes that enabled greater efficiencies in manufacture. Due to the controlled nature of some aspects of the MARVEL reactor, this section only describes the approach from a notional standpoint, without providing detailed examples.
III.B.1. Mapping Methodology
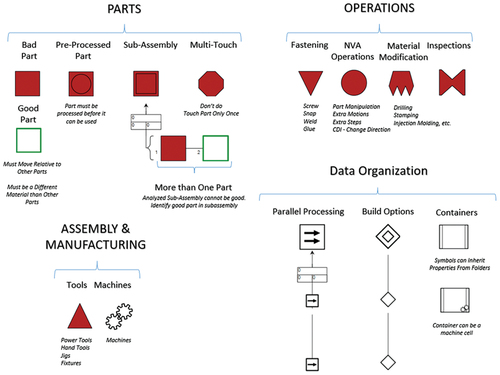
Modeling the detailed workflow of activities for the microreactor use case was conducted using the Design Profit software tool.[Citation26] This mapping process uses symbols (highlighted in ) that represent different manufacturing activities to provide a visual representation of the fabrication and assembly processes.
Fig. 8. Overview of the symbology used in Design Profit.
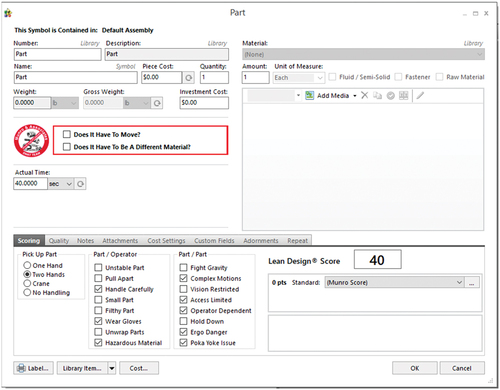
The tool loads all of the reactor constituent components that are in CAD drawings, bills of materials (BOMs), or other formats. These library items carry critical characteristic information, which allow for the organization of parts in the product map and enable accurate costing; part numbers, names, quantities, materials, weights, dimensions, and build issues that are identified to drive the creation of time estimates. Additional customized fields are also included, such as information on make/buy status, country of origin, original equipment manufacturer (OEM) versus supplier, etc. provides an example screenshot of the options and settings available to a user as parts and components are specified.
Fig. 9. Screenshot of the Design Profit form used to capture the characteristics that drive cost estimates. The actual time estimate is derived from assembly issues identified in the scoring tab.
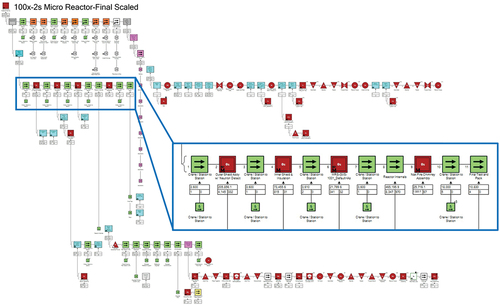
The resulting high-level map for the 100 unit/year variant is shown in . The map defines the precedence of operations for both the component manufacturing processes and the final assembly processes. The logical sequence of assembly can be determined using three approaches: project definitions (BOM and work outline for the one-off MARVEL demonstration), product teardown via reverse engineering (i.e., disassembling a physical product with the first part removed being the last part included in the assembly process), or using the subjective analysis of analysts.
Fig. 10. Top-level map of the various tasks/subtasks for the 100× factory throughput in Design Profit, with a zoomed view of the tasks directly leading to the final assembly. Each box represents a task or systems of tasks to be performed (subtasks have been collapsed) with colors indicating the type of activity. The various steps are linked to each other to form a detailed map of the factory activities.
An example illustration for how the assembly flow can be improved is shown in . Next, each part is characterized. This step of the costing process is focused on gathering the information required to cost the individual components. Most of the required elements are usually addressed in the Part Library Development section of the costing process; however, anything not sufficiently defined must be determined by the engineer charged with developing the cost. Most imperative in this step is the selection of the correct manufacturing processes required to create the part. It is important to understand the variable processes that could possibly produce the part as well as the processes most optimal for producing the part. For example, the cost difference between a stamped part and a machined part in a high-volume scenario usually favors the selection of the stamping process; however, the high investment cost of stamping may make machining more viable for a low-volume scenario.
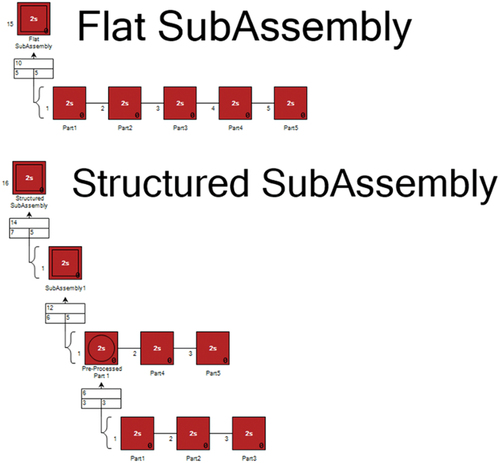
Fig. 11. Product map before and after structuring the layout to match the assembly flow.
Depending on the component, a combination of quick cost estimation (QCE) and detailed costing (DC), is performed on the use case. As an example, complex high-precision machined parts are best approached using DC, whereas injection moldings lend themselves to using QCE.
The accuracy of the cost estimates relies on the ability to discern the processes required to manufacture a part and to translate those processes into a comprehensive map of the component. The component map, generated using the Design Profit software, serves as a parametric model that can then be adjusted to account for various input parameters, including material prices, wage rates, plant efficiency, plant layout, and markup structure.
In developing a complete product map within Design Profit, properly accounting for the assembly of the product’s constituent components (as shown in ) factors heavily into the final output metrics for both DC and QCE. Included in the assembly processes are
handling of materials and components
handling of tools
affixing components at the final assembly and subassembly levels (welding, gluing, clamping, snapping, etc.)
operator movements within stations.
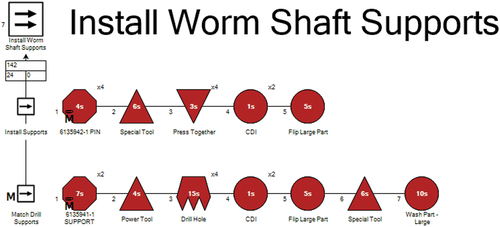
Fig. 12. Example of a mapped assembly station in DC.
At the highest level, for final assembly processes are mapped in a manner that matches the structure of the plant and assembly line so that cycle times and bottlenecks can be identified. Mapping the processes in a serial fashion is not analogous to most manufacturing environments, but will minimally ensure that a representative cost and time are captured for each required step.
At lower levels in the product map, where purchased subassemblies are common, the QCE process automatically generates the fabrication processes. By selecting predefined processes (e.g., “snap together,” “press together,” “welding,”), an estimated process map is generated based on the part size, interface length, and complexity of operations.
III.B.2. Modeling Assumptions
To accurately assess the cost and throughput for each variant, assumptions were made regarding the manufacturing environment and purchase price paradigm. These assumptions and general observations for each variant are summarized here:
Shift pattern: the prototype build is assumed to be a single shift pattern, whereas both factory builds were evaluated based on a two-shift pattern. The two-shift pattern was required to hit the required throughput for the production volume of 100/year but could reasonably be moved to a one-shift pattern for a production volume of 10/year.
Purchase price: All items assumed to not be manufactured in the final assembly plant were assumed to be purchased. For the protype build, these prices were derived from direct quotations or were assessed in Design Profit to derive the cost. For the 10× and 100× maps, purchase prices were scaled relative to their purchase quantity; the scaling was determined based on commercial cost curves and was adjusted to provide conservative estimates.
Make versus buy: Welding operations were assumed to be conducted at the assembly plant; all other manufacturing processes were assumed to be conducted at supplier facilities. All assembly was assumed to take place at the final assembly plant and factored into the OEM labor cost.
Capital expenditures: All tooling, machines, and equipment required for the assembly of the reactor were accounted for. Costs were not amortized across produced parts, but rather provided in tabular form. These costs are ±20%.
Q burden: An incident cost of $100 and a disposition cost of $150 with a defect rate of 725 parts per million (ppm) were applied across all parts in the assembly to account for expected quality issues (Q burden). These values match typical aerospace standards that are most applicable to this type of build.
IV. MICROREACTOR FACTORY LAYOUT AND MODELING RESULTS
IV.A. Resulting Microreactor Factory Layout
Due to the complex nature of the MARVEL reactor, a predominately asynchronous indexing line layout with supplemental static layouts was selected. Overall, while the reactor is a large assembly, it is not of comparable size to products that require the use of a static line layout (namely, in aerospace or shipbuilding). The weight of the reactor introduces a high risk for ergonomic and safety issues, so minimizing the back and forth movement of materials and machines/tooling was necessary; this makes a predominately static layout undesirable.
The reactor has several highly critical components that will require strict quality checks, and a static line may introduce discontinuity in the process that would add potential quality issues. Quality issues and rework caused by process continuity issues would increase the cost and cause production delays. An asynchronous indexing layout would aid in line balancing, as the reactor has process steps with significantly varying cycle times. The asynchronous layout would also aid the integration of manual assembly operations.
A specific example of why the asynchronous layout is better than the moving or synchronous layout is the control drum versus the outer reflector plate installation time difference. The difference in time between these two operations would cause a significant amount of dwell time within the process leading to inefficiencies. The dwell time would increase labor costs and add significant inefficiencies to the overall process. The asynchronous layout provides relief for this issue by indexing at different times, thereby eliminating the dwell time.
Within the MARVEL assembly process, there are proposed workstations that lend themselves to a static layout. These include the welding stations and the assembly of the control drums subassembly. These stations will not impact the critical path except for the primary coolant system due to this system needing to be completed prior to the installation of the reactor internals. Based on the assessment conducted and known information, a predominantly asynchronous indexing line layout with supplemental static layouts is best suited for the assembly of the MARVEL use case.
To determine the facility requirements and layout, the Design Profit map was leveraged to generate a factory representation. Design Profit provides estimates of assembly times based on the difficulty of handling and inserting the components. Each issue identified (such as access or alignment challenges) increases the time required to perform the given task. An efficiency factor is applied to these time estimates to account for inefficiencies in the environment. For example, a factory producing a million units a year would have a much higher efficiency than would be seen for building a prototype where parts and tools must be located. Under these conditions, operators need to think about what tasks to perform and how to best perform them, hence leading to inefficiencies. The tooling and equipment required to support assembly operations are also identified in the Design Profit map.
Tasks are then organized into logical workstations ensuring that the station cycle time does not exceed the takt timeFootnotea or rate at which the product must be produced given the operating hours available to meet customer demand. These workstations identified in Design Profit were then laid out in AutoCAD software[Citation38] using the size of the station equipment and of the components that are staged in the station (see ). The virtual assembly plant mirrors the structure of the Design Profit map and allows for proper material and product flow. This is then leveraged to derive the required surface area needed for the overall facility (which directly influences the overall costs as discussed in later sections). The AutoCAD-based model includes
complete plant layout and required area
all work cells prescribed by the Design Profit map
administrative space
warehouse space for part and material storage
additional floor space to allow for expansion or to accommodate for oversights.
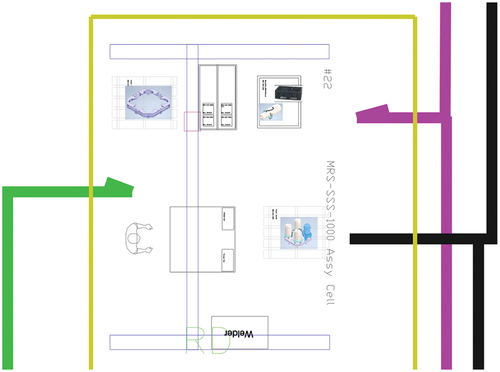
Fig. 13. Example of zoomed view of a workstation showing various flow paths in green (between subassembly workstations), pink (paths from warehouse to subassembly stations or final assembly line), and black (subassemblies to final line path).
The sole difference between the 100× and the 10× line layouts is the inclusion of an additional final line, as shown in . The facility is structured first and foremost to address the throughput needs and bottlenecks of the 100× line. From there, the 10× line was scaled back to exclude stations that were no longer needed to meet the rate. The result is a 10× line that is not fully optimized; however, such inefficiency would be expected in a 10× low-volume production environment. Assuming two shifts, the maximum annual production for the 10× and 100× lines are 28× and 100×, respectively. The 10× layout could therefore reasonably be scaled back to one shift, allowing for 14× maximum production at full capacity. In the current model, the single-shift 10× layout could be expanded beyond 14× production by doubling the number of shifts up to a production volume of 28; this is the cross-over point where production would need to move to the 100× layout with additional equipment investment.
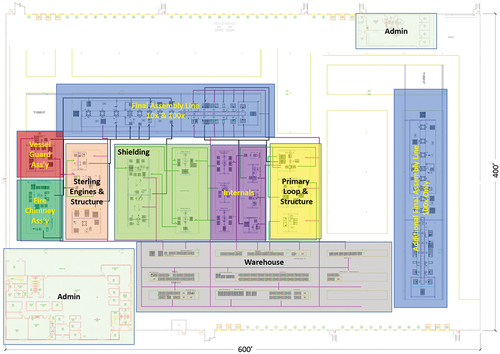
Fig. 14. Overview of the microreactor factory layout for the 10× and 100× production volumes for the MARVEL use case. The subassemblies for the various subsystems (e.g., shielding, primary loop structure) are highlighted, along with the final assembly lines (blue), administrative buildings (light green), and the warehouse (gray).
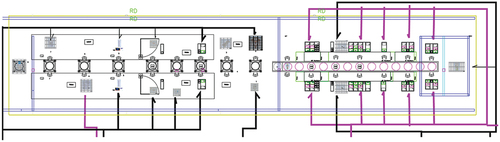
The model accounts for the detailed flow of components throughout the assembly process (as shown in ) in order to assess these production timelines. A detailed view of the final assembly line, leveraging asynchronous indexing, is shown in . The gap between the substations enables the temporary hold of a unit as it progresses though the line if the next substation has not yet completed work on the previous unit.
Fig. 15. Movement of component from subassembly lines to final assembly. Pink lines originate from the warehousing, green lines are for component transfers within subassembly areas, and black lines are from subassemblies to the final assembly line(s).
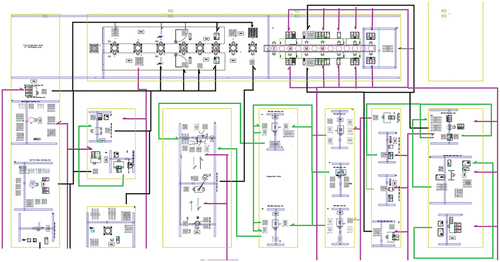
Fig. 16. Zoomed-in view of the final assembly line.
A logical next step for optimizing efficiency would be to assess the case of 500× and 1000×. At those production volumes, line balancing options would become much more apparent; optimizing cycle times and fully utilizing the labor force would be more practical than at 10× or 100× production. Material and product flow would become more difficult to manage, however, so value stream optimization and inventory tracking would be more critical than at lower volumes. Additional buffers would also be required, accommodating for downtime (maintenance, rework, line stoppages, etc.). However, it is unclear if the yearly demand for microreactors might exceed the 100 unit/year capacity, and this is left for future work.
A detailed estimate of the breakdown in equipment needed for each production volume is provided in . The quantity and investment costs were generated as part of the analysis. It is important to emphasize that all cost values are expected to be representative within the order of magnitude. It is interesting to note that a tenfold increase in production results in a less than doubling in equipment needed. This is particularly attributed to better efficiency/utilization of resources with an additional worker shift. One exception is the stationed gantry crane, where the shift to 100× incurs a large increase in cost as an additional main line gantry, the biggest cost driver within this category, is added to support the second final assembly.
TABLE IV Overview of Equipment Costs for 10× and 100× Annual Production Rates*
reorganized the data from into the main workstations. As shown, the majority of the additional equipment needs stem from the second assembly line. All other workstations have similar equipment costs for both the 10 and 100 unit/year volumes of production. The required space for each substation is also provided in . It is derived by the Design Profit software based on the tasks, equipment, and number of operators at each workstation.
TABLE V Overview of Equipment Costs Organized per Workstation for Each Level of Production Volume
A breakdown of the staffing needs per shift is provided in . As previously discussed, the majority of the complex operations are performed at the final line workstations. The number of operators per shift only changes with the volume of production at these workstations. Note that the number of shifts is increased from one to two when moving from 10 to 100 unit/year production levels. The cycle time for each station is also provided. Note that the cycle time would be less than the labor time for a given workstation, as some operations can be performed in parallel.
TABLE VI Workstation Operator Breakdown for Each Production Level*
Unsurprisingly, the final assembly workstation contributes to some of the longest cycle times. The weld inspection station, however, accounts for the largest cycle time overall. This is in line with expectations for nuclear factory fabrication where quality standards and pedigrees are exceedingly high. Assuming hourly rates of $53/h, $60/h, and $125/h for subassembly, welding, and final assembly tasks, respectively, the workstation labor costs can be estimated. These estimates account for supporting staff costs but exclude front office staffing needs (e.g., finance, accounting, warehousing). It is also important to emphasize that these rates represent high-level estimates; a complete and detailed modeling of staffing requirements to fulfill all support activities was not conducted at this stage.
Leveraging the data from and the flow paths from , the surface area required for the main fabrication area could be determined. Typical area values were then assumed for the administrative and warehousing spaces. An additional buffer was included to account for unforeseen requirements/equipment, potential future capacity expansion, and space for receiving and delivering shipments (the empty area found on the right of ). As a result, the overall size of the factory building was estimated to be 242 000 sq. ft. Assuming a typical building construction cost of $300/sq. ft., this results in a total building cost of $72 600 000. Note that this excludes purchasing costs as well as governmental/regulatory costs. Similarly, the utilities (namely, electricity, natural gas, and water coverage) were assumed to be $2.15/sq. ft./year, resulting in yearly utility costs of $520 300/year.
These various costs are summarized in . Note that these estimates are incomplete and do not account for several of the items highlighted. Nevertheless, it is expected that these estimates may serve as a starting point for microreactor vendors evaluating factory investments. The purpose is to provide approximate cost ranges that can be expected for the factory production of a nuclear reactors.
TABLE VII Summary of Costs Estimated Within This Analysis*
IV.B. Evolution of Unit Cost Drivers with Mass Production
The Design Profit model of the MARVEL reactor included over 7000 activities alongside their respective costs estimates. The cost/time values were structured as a BOM that lists all the materials, components, assemblies, and tasks needed to manufacture the MARVEL reactor in a hierarchical format.
While MARVEL is not intended to be mass-produced, the analysis of this use case is expected to shed light on the factory fabrication of microreactors as a whole. Understating the evolution of the cost and time drivers with mass production is essential to evaluate the feasibility and viability of commercial microreactors. For this purpose, three MARVEL BOMs were developed and analyzed. The first is a BOM for the fabrication and installation of the MARVEL prototype reactor that is to be installed at the INL TREAT facility. It is a BOM of a single, stick-built prototype reactor and will be referred to as “1×-BOM.” The factory model discussed in previous sections was then used to generate the BOMs that reflect production volumes of 10 and 100 units per year. These will be referred to as “10×-BOM” and “100×-BOM,” respectively. and present a comparison between the prototype, the 10×, and the 100× production rates. This comparison focuses on the component/component assemblies or tasks that are either costly or time consuming. Due to sensitivities with releasing detailed cost estimates of the MARVEL reactor prior to its completion, normalized cost estimates are provided. More background information on some of the most important items in and includes the following:
The startup (core and NaK) item label includes subitems, such as the reactor core, the fuel pins, and the sodium-potassium (NaK) coolant, plus the tasks related to startup, like recording neutron readings or installing specific components. All of these activities (including fuel loading) are assumed to be conducted at the site (or at a dedicated fueling facility as outlined in ) and are therefore not impacted by the mass production evaluation. This reflects the assembly model of the real MARVEL prototype; the assembled reactor module is hoisted into the TREAT pit, then fuel is loaded onsite. As a result, in the 10×-BOM and 100×-BOM, these startup operations (including fuel loaded and associated fuel costs) are captured but are not conducted in the factory model. To distinguish between activities occurring at the factory versus the site, reports costs including and excluding these fuel costs. Note that the MARVEL BOM is structured in a hierarchical format and the cost items 2, 3, 4, and 5 in all belong to the startup activity (item 1 in the table). While these costs are indeed the biggest cost drivers in the MARVEL design, this is largely due to its relatively small power output per fissile inventory. This is not expected to be representative of commercial microreactors (again, MARVEL is only intended for research purposes).
The startup assistants item refers mainly to the labor of technical assistants in the startup process (OEM labor). This item does not include any piece/component costs. It is only labor cost, and it is relatively very time consuming.
It is worth noting that the fabrication and assembly of the fuel pins were not analyzed, and the fuel pin grid plates are expected to require extensive machining due to the small radii of the honeycomb grid internal corners (higher machining cost). Also, current cost estimates do not account for the feed material (i.e., enriched uranium). These were obtained at no cost to the project from a U.S. Department of Energy (DOE) stockpile, hence they were not accounted for in the detailed estimates. Note that no existing commercial enrichment capacity in the United States is able reach the required MARVEL level. Based on preliminary fuel cycle calculations, a multiplier of ×1.04 would be needed to account for mining, conversion, and enrichment costs (the proportion is so low due to the high costs of custom-ordered small batch fuel fabrication and international transportation in the case of MARVEL). This multiplier is not accounted for in .
The lower grid plate processing (e.g., visual inspection, X-ray inspection, heat treatment, packaging) is a time-consuming task, mostly incurred in supplier labor.
The beryllium metal inserts are relatively costly. The costs of the beryllium inserts arise from the purchase of the preprocessed pieces and their installation onsite. The insertion of these core internal components is assumed to be conducted onsite along with the fuel loading. In this use case, it falls under startup activities outside of the factory.
The reactor primary structure weldment processes are both costly and time consuming. Items 6, 7, 8, and 9 in are components/tasks that belong to the reactor assembly. Item 10 is the crane needed to lift and move any part (that is over 42 lbs. or requires two people to lift) between the workstations in the MARVEL assembly plant.
TABLE VIII Estimation of the Costs of Workstations in a Virtual MARVEL Assembly Plant that Produces 1 or 10 or 100 MARVEL Units per Year*
TABLE IX Estimation of the Needed Work Hours of Workstations in a Virtual MARVEL Assembly Plant that Produces 1 or 10 or 100 MARVEL Units per Year
Note that all the costs in are relative (not the absolute cost in dollars). Hence, they only capture the variations in the component costs due to mass production and should not be used to infer the total costs of a microreactor. In any case, this is expected to be strongly design dependent, and MARVEL is not necessarily the most representative use case of a commercial microreactor. The costs in include the piece costs (the cost of the materials used to manufacture products), the process cost, which equals the OEM labor plus the supplier labor, and the total cost, which is the sum of the piece cost, process cost, and the selling, general, and administrative (SG&A) costs. Typically, the SG&A cost is relatively insignificant compared to the piece and the process costs. The change in the total cost of each cost item in due to mass production is captured in the last two columns of the table as follows: (1) The cost change/reduction because of producing 10 units a year instead of one (10×:1×) and (2) the cost change/reduction because of producing 100 units instead of 10 (100×:10×).
These cost change factors are expected to be less than one (green cells in ) if the mass production results in cost reduction. For the startup account (and corresponding subtasks including fuel costs), the cost does not change as these activities are performed onsite (not in the factory). The cost of the startup process (especially the fuel) is relatively high since the MARVEL was not intended to be competitive. For commercial microreactors, the ratio of the fuel cost to the total cost is expected to be lower. Hence the findings here for factory-incurred cost reductions are still expected to be useful within the broader context of microreactors.
In the prototype 1× use case, component prices were derived from direct quotations while the 10× and 100× prices were scaled relative to their purchase quantity. Volume-based scaling factors were applied based on component types and precedence. This leads to substantial cost reductions in components such as the control drums, reflectors, and shields. The large reduction in the process costs in the factory (in the 10× and 100× relative to the 1×-BOM) is due to a shift from a static assembly to a moving assembly line. A significantly larger amount of time is required for the 1× prototype production to account for quality checks and the building of the subassemblies. While in the factory production scenarios, these assemblies are optimized with units taking as little as 1 week for the 100× production rate. The factory layout minimizes the number of checks and inspections needed in the assembly, greatly simplifying the process.
Finally, the total cost of the MARVEL unit decreases by 20% when producing 100 units (compared to 1). Excluding the startup and fuel costs, the MARVEL unit cost, assuming the production of 100 units a year, is only 16% of the cost of the prototype (1×) unit (see ). As expected, the MARVEL unit cost in follows a power trendline, with the cost rapidly decreasing as more units are built before slowing down as maximum gains and efficiencies are reached.
As explained in Sec. IV.A, the main difference between the 100× and the 10× line layouts is the inclusion of an additional assembly line in the 100× layout. Therefore, the throughput time at the 100× assembly plant is three times smaller compared to the 10× assembly plant (see ). The smaller throughput time is due to the higher process and labor efficiency in the 100× production scenario that ensures minimal labor dwell times. Nonetheless, the work hours associated with each workstation in the assembly plant remain the same. This indicates that the 10× production rate is relatively inefficient with significant staff downtime. Nevertheless, the assembly lines in the 10× and 100× assembly plants both result in substantially smaller durations per each task compared to the prototype 1× unit.
While the learning rate is not entirely applicable to the volume-based cost reductions in the MARVEL reactor, an estimate based on the EquationEq. (1)(1)
(1) can be derived:
where FOAK and NOAK refer to the first and the N’th of a kind, respectively, and LR is the learning rate. Based on the evolution in , a learning rate of approximately ~24% can be derived for microreactor direct costs conducted within a factory. This is slightly above but still relatively in line with the findings of 15% to 20% learning rates in industries such as aerospace, shipbuilding, and automotive.[Citation39,Citation40] References in the literature also point out that mass producing SMRs could lead to a 35% to 40% reduction in cost from FOAK to NOAK (albeit this is with learning rates closer to 5% to 15%).[Citation41]
Fig. 17. Change in the total cost of the MARVEL unit (excluding the startup activities) due to mass production. The costs are normalized by the cost of the 1× prototype MARVEL.
It is important to reemphasize that the learning rate in EquationEq. (1)(1)
(1) is only for activities at the site and excludes many items, such as fuel costs, startup operations, etc. The overall learning rate for the use case would likely be lower than this value. Based on the estimates for Ref. [Citation1], factory-based costs contribute to between 35% to 40% of the overall levelized cost of electricity of a specific heat pipe–based microreactor design. Assuming these proportions are applicable across microreactor types (taking a value of 40% here), and that a 10% learning rate is applicable to all other nonfactory components (including fuel), the true learning rate for a microreactor system can be calculated using EquationEq. (2)
(2)
(2) :
where the subscripts T, F, and O refer to the overall total system costs, the factory-based ones, and the other nonfactory ones. The resulting learning rate is expressed as a function of the number of units N. It can then be derived that the learning rate for the total system as a whole would likely to be closer to ~15%. This would be in line with other estimates for nuclear-based systems. However, a more detailed breakdown between factory and nonfactory activities is needed to verify this estimate and is considered beyond the scope of this study.
V. CONCLUSION
While several efforts are underway to execute microreactor demonstrations, mass manufacture of this class of reactor will ultimately drive commercial deployment. To this end, this paper attempted to develop an initial detailed model of a microreactor factory with varying throughputs. Established methodologies and best practices pervasive in other industries (aerospace, defense, automotive, etc.) were applied to a specific microreactor use case. A dedicated tool, Design Profit, was then used to map the workflow, determine the number of workstations, equipment needs, staffing needs, and general layouts of a potential factory. The intent was to quantify the rough order of magnitude investment levels required for such a facility and potential gains in terms of cost reductions.
The resulting evaluation led to a 242 000 sq. ft. factory layout with individual workstations producing components that are assembled in an asynchronously indexed final assembly line. Equipment costs ranged from $5 million for 10 units/year to $10 million for 100 units/year, while staffing cost estimates ranged from $6 million to $20 million for 10 and 100 units per year, respectfully.
Detailed BOMs were also generated and compared to a one-off prototype deployment baseline. While many of the largest cost-driving activities are not executed within the factory (namely, startup operations and fuel costs), activities that are conducted in a factory can expect an approximately 60% cost reduction going from a stick-built to a 10 units/year production rate, and a further 40% cost reduction when expanding production to 100 units/year. This corresponds to a learning rate of approximately 24% for factory-based activities, while the true learning rate (accounting for site activities and fuel costs) is expected to be lower. It is important to note that design-specific considerations are likely to greatly influence the applicability of these findings across microreactor types (especially for larger variants). However, this study is expected to still provide a useful starting basis for evaluating the potential benefits of microreactor mass production.
In addition to all of these quantitative analyses, this paper also included a detailed overview of key considerations and best practices for the mass production of microreactors. The purpose was to highlight important recommendations that should be incorporated early in the design process (even at the demonstration phase) to enable a concept to reap the benefits of mass production more effectively.
Acknowledgments
This paper was authored at INL by Battelle Energy Alliance LLC under contract no. DE-AC07-05ID14517 with the DOE. This work was prepared for the DOE through a collaboration between the Systems Analysis & Integration Campaign and the Microreactor Program. The U.S. government retains for itself, and others acting on its behalf, a paid-up nonexclusive, irrevocable worldwide license in said paper to reproduce, prepare derivative works, distribute copies to the public, and perform publicly and display publicly, by or on behalf of the government. The DOE will provide public access to these results of federally sponsored research in accordance with the DOE Public Access Plan: energy.gov/downloads/doe-public-access-plan.The authors would also like to acknowledge the support from Brent Dixon and John Jackson who secured the funding for this research through their DOE programs. Special thanks should be given Andrew Foss for early help with developing the scope of this study and providing feedback on the outcomes. Jason Hansen also supported the review and improvement of this paper. Last, the team would like to acknowledge the contribution of key Munro & Associates staff who aided in the development of the factory models: Miranda Alberty, David Foreman, Joe Hinkle III, and Kenneth Kutler.
Disclosure Statement
No potential conflict of interest was reported by the authors.
Notes
a In manufacturing, takt time is the time under which each product needs to be produced (on an average) to meet customer demand.
b The introduction of the moving line in the production of Ford Model T in the 1920s led to the reduction of the Model I unit cost by about 70%.[Citation13]
References
- A. ABOU-JAOUDE et al., “An Economics-by-Design Approach Applied to a Heat Pipe Microreactor Concept,” INL/EXT-21-63067, Idaho National Laboratory (July 2021).
- F. BARBOSA et al., “Reinventing Construction: A Route to Higher Productivity,” McKinsey Global Institute (2017).
- “The Future of Nuclear Energy in a Carbon-Constrained World,” MIT Future of Series, Massachusetts Institute of Technology (2018); https://energy.mit.edu/research/future-nuclear-energy-carbon-constrained-world/.
- J. MOODY, “Affordable Small Modular Reactors—Effective Integration of Modular Design, Manufacturing and Construction Techniques,” presented at the Platt’s Small Modular Reactor Conf., June 28, 2010.
- G. MARONATI, “Explaining Large Observed Cost of Nuclear Power Plants Through Correlated Random Variables,” PhD Dissertation, School of Mechanical Engineering, Georgia Institute of Technology (2018).
- B. MIGNACCA and G. LOCATELLI, “Economics and Finance of Small Modular Reactors: A Systematic Review and Research Agenda,” Renewable Sustainable Energy Rev., 118, 109519 (2020); https://doi.org/10.1016/j.rser.2019.109519.
- C. B. TATUM, J. A. VANEGAS, and J. M. WILLIAMS, “Constructability Improvement Using Prefabrication, Preassembly, and Modularization,” University of Texas, Austin (1987).
- J. SONG et al., “Considering Prework on Industrial Projects,” J. Constr. Eng. Manage., 131, 6, 723 (2005); https://doi.org/10.1061/(ASCE)0733-9364(2005).
- T. J. O’CONNOR, W. J. O’BRIEN, and J. O. CHOI, “Standardization Strategy for Modular Industrial Plants,” J. Constr. Eng. Manage., 141, 9, 04015026 (2015); https://doi.org/10.1061/(ASCE)CO.1943-7862.0001001.
- L. PRESLEY and A. N. D. B. WEBER, “Modularizing Containment Vessels in New Nuclear Power Plants,” Power, 253, 11 (2009).
- E. INGERSOLL et al., “The ETI Nuclear Cost Drivers Project: Full Technical Report,” Energy Technologies Institute, Loughborough, United Kingdom (2018).
- P. A. CHAMPLIN, “Techno-Economic Evaluation of Cross-Cutting Technologies for Cost Reduction in Nuclear Power Plants,” MS Thesis, Department of Nuclear Science and Engineering, Massachusetts Institute of Technology (2018).
- J. BUONGIORNO et al., “The Future of Nuclear Energy in a Carbon Constrained World—An Interdisciplinary MIT Study,” MIT Energy Initiative, Massachusetts Institute of Technology (2018).
- “Unlocking Reductions in the Construction Costs of Nuclear—A Practical Guide for Stakeholders,” Nuclear Energy Agency, Organisation of Economic Co-Operation and Development (2020).
- “Phase 9 Update Report for the Energy Economic Data Base Program,” U.S. Department of Energy (1988); https://www.osti.gov/biblio/7227212-phase-update-report-energy-economic-data-base-program-eedb-ix.
- M. WALD, “Advanced Reactors: Now Comes the Hard Part,” Nucl. News, 65, 1 (Jan. 2022).
- D. SHROPSHIRE, G. BLACK, and K. ARAUJO, “Global Market Analysis of Microreactors,” INL/EXT-21-63214, Idaho National Laboratory (2021).
- C. FORSBERG, A. FOSS, and A. ABOU-JAOUDE, “Fission Battery Economics-by-Design,” Prog. Nucl. Energy, 152, 104366 (2022); https://doi.org/10.1016/j.pnucene.2022.104366.
- Code of Federal Regulations, Title 10, “Energy,” Part 71, “Packaging and Transportation of Radioactive Material,” U.S. Nuclear Regulatory Commission (2004).
- “Safety Analysis Report on the HI-STAR 100 Cask System,” Rev. 18, NRC ADAMS Accession Number: ML18183A083, Holtec International, Marlton, New Jersey (2018).
- “How Many Parts Do Jet Engines Consist Of?,” Simple Flying (Mar. 22, 2023); https://simpleflying.com/how-many-parts-do-jet-engines-consist-of/ (current as of Apr. 2023).
- Code of Federal Regulations, Title 14, “Aeronautics and Space,” Part 33, “Airworthiness Standards: Aircraft Engines,” U.S. Federal Aviation Administration (1964).
- L. M. AMOO, “On the Design and Structural Analysis of Jet Engine Fan Blade Structures,” Prog. Aerosp. Sci., 60, 1 (2013); https://doi.org/10.1016/j.paerosci.2012.08.002.
- V. AGARWAL, Y. A. BALLOUT, and J. C. GEHIN, “Fission Battery Initiative—Research and Development Plan,” INL/EXT-21-61275, Idaho National Laboratory (2021).
- “International Standard for Automotive Quality Management Systems,” IATF-16949, International Automotive Task Force, Automotive Industry Action Group (2016).
- S. MUNRO et al., “Lean Design®: Value Quality Profit: 13th Edition,” CreateSpace Independent Publishing Platform (2013).
- Code of Federal Regulations, Title 10, “Energy,” Part 50, “Domestic Licensing of Production and Utilization Facilities,” U.S. Nuclear Regulatory Commission (1998).
- Code of Federal Regulations, Title 10, “Energy,” Part 52, “Licenses, Certifications, and Approvals for Nuclear Power Plants,” U.S. Nuclear Regulatory Commission (2007).
- “Rulemaking Plan on Risk-Informed Technology-Inclusive Regulatory Framework for Advanced Reactors,” SECY-20-0032, Adams Accession No: ML19340A056, U.S. Nuclear Regulatory Commission (2020).
- J. CHRISTENSEN and A. HUNING, “Regulatory Analysis of the Transportation of a Factory Manufactured Microreactor,” INL/RPT-22-69276, Idaho National Laboratory (2022).
- “Micro-Reactors Licensing Strategies—NRC Draft White Paper,” Adams Accession No: ML21235A418, U.S. Nuclear Regulatory Commission (2021).
- “Consolidated Preliminary Rule Language for the Part 53 Rulemaking,” Adams Accession No. ML22024A066, U.S. Nuclear Regulatory Commission (2022) (current as of Jan. 2023).
- Code of Federal Regulations, Title 10, “Energy,” Part 70, “Domestic Licensing of Special Nuclear Material,” U.S. Nuclear Regulatory Commission (2015).
- C. BOLISETTI et al., “Mass Production of Microreactors: A Look at Potential Scenarios and Fabrication Facility Requirements,” presented at the American Nuclear Society Winter Mtg. (2022).
- Y. ARAFAT et al., “MARVEL Test Reactor Reference Design,” Trans. Am. Nucl. Soc., Phoenix, Arizona (Nov. 2022).
- “Final Environmental Assessment for the Microreactor Applications Research, Validation, and Evaluation (MARVEL) Project at Idaho National Laboratory,” DOE/EA-2146, U.S. Department of Energy (June 2021); https://www.energy.gov/sites/default/files/2021-06/final-ea-2146-marvel-idaho-2021-06.pdf.
- T. LANG et al., “MARVEL Core Design and Neutronic Characteristics,” Trans. Am. Nucl. Soc., Phoenix, Arizona (Nov. 2022).
- “AutoCAD Architecture 2011: User’s Guide,” AutoDesk (Mar. 2010); https://images.autodesk.com/adsk/files/autocad_aca_user_guide_english.pdf.
- L. QUARTERMAN, “Learning & Experience Curves In Manufacturing,” Strategos Inc. (Oct. 2014); http://www.strategosinc.com/downloads/learning-curves-dl1.pdf.
- “Cost Reduction Through Learning in Manufacturing Industries and in the Manufacture of Mobile Source,” EPA-420-R-16-018, U.S. Environmental Protection Agency (Nov. 2016); https://19january2017snapshot.epa.gov/sites/production/files/2016-11/documents/420r16018.pdf.
- L. BOLDON and P. SABHARWALL, “Small Modular Reactor: First-of-a-Kind (FOAK) and Nth-of-a-Kind (NOAK) Economic Analysis,” INL/EXT-14-32616, Idaho National Laboratory (Aug. 2014).
- “Build for Scale Training,” U.S. Department of Energy; https://www.energy.gov/eere/amo/build4scale (accessed Dec. 22, 2022).
- T. ROULSTONE, “Nuclear at the Cross-Roads Nuclear at the Cross-Roads Nuclear Renaissance?” Research Gate (Feb. 2019); https://www.researchgate.net/publication/331131372_Nuclear_at_the_Cross-Roads_Nuclear_at_the_Cross-Roads_Nuclear_Renaissance.
- P. R. MCMULLEN, “Assembly Line Design,” Encyclopedia of Production and Manufacturing Management, Springer US, Boston, Massachusetts (2000).
- “Quality Management Systems—Requirements for Aviation, Space and Defense Organizations,” AS9100D, Society of Automotive Engineers.
- “Quality Management Systems—Requirements,” ISO 9001:2015, International Organization for Standardization.
- “Requirements for ASME NQA-1 Certification,” American Society of Mechanical Engineers (2014).
- “The Moving Assembly Line and the Five Dollar Workday,” Ford Corporation (Jan. 16, 2023); https://corporate.ford.com/articles/history/moving-assembly-line.html.
APPENDIX
A.I. DESIGN PRINCIPLES FOR ENABLING EFFICIENT MASS PRODUCTION
Factory manufacturing has been the backbone of many industries around the world. It has enabled a cost reduction in various products, making them more affordable to consumers, and as a result, drastically increasing their standard of living over the past few centuries. Manufacturing experience from industrial sectors such as automotive, shipbuilding, aviation, etc., has resulted in a large knowledge of best practices in factory manufacturing large, complex machines. This knowledge should be used in the mass production of microreactors (and factory-produced components of SMRs) as the current nuclear industry moves away from the current practice of stick-built power plants.
Cost reduction can be accomplished using various ways, but making cost-conscious design choices holds the most influence on reducing final costs (as illustrated in ); hence the need to incorporate good manufacturing principles early in the design process. This section briefly describes some well-established design principles that have contributed to the continued success of the automotive and aerospace industries in ensuring competitive mass production. Some established methods of implementation of these design principles in mass production are presented in Sec. III.B.
Fig. A.1. Shadow diagram showing the contribution of various cost categories versus their influence on the final cost. The diagram illustrates how design costs may be low (respective to total costs) but have the greatest ability to influence the final costs of a product.
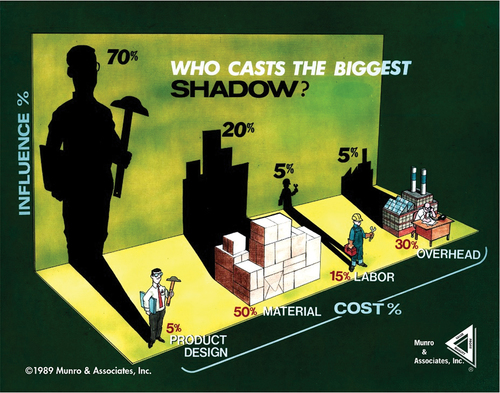
The primary challenge of manufacturing is minimizing costs while maximizing production rates and adhering to safety and quality requirements.[Citation26,Citation42] In the context of commercial microreactors in the United States, which will be regulated by the NRC, the safety and quality requirements will likely be more stringent than most industries that employ factory manufacturing. Acknowledging and managing the balance between unit costs, production rates, and meeting requirements, is especially important for the first few microreactor designs, as they will set the precedent for future technologies in this space. Naval nuclear reactors already have a track record of factory-producing small reactors for submarines and other applications.[Citation4] The implicit knowledge obtained from these endeavors could be potentially leveraged in the commercial sector (with adequate protection of classified information). Much of this knowledge transfer is expected to be operational experience rather than necessarily design specific.[Citation43]
Other industries that have been mass manufacturing products for decades ensure that manufacturability and assembly are accounted for in the early phases of the design process. This approach is called Lean Design or DFMA or DFM and DFA.[Citation26,Citation42] For large, complex, and safety-critical products, like microreactors, aspects such as ease of inspection and reliability should be considered in addition to manufacturability and assembly. DFMA can also be extended to these considerations and referred to as design for inspection, design for reliability, etc.[Citation42]
Design for manufacturability ensures that the ease of manufacturing a product has been optimized prior to tooling kick-off or qualification activities that render changes cost prohibitive. While designing parts, the impact of the design on the manufacturing process should be thought through by considering the following questions:
Can the part be practically manufactured as designed? With the multitude of manufacturing options available today, and particularly with additive manufacturing (AM), the answer to this question is most often “yes.” The answer becomes more complicated when factoring in budgets, material specifications, and performance requirements, which can limit manufacturing options. For example, if AM is the only way a certain geometry can be manufactured, the resulting material may not meet required performance metrics (such as strength or fatigue life). Therefore, the best approaches meet not only cost and quality, but also manufacturing goals. These goals drive the need to evaluate multiple manufacturing process options, often in the form of trade studies, to ensure the practicality of the design for manufacturing (e.g., forging versus welding versus AM).
Does this design enable the simplest manufacturing solution? The simplest manufacturing solution is the one that is affordable, reliable, and efficient. For example, a designer may use generative design (or topology optimization) to achieve a configuration that uses the least amount of material while ensuring performance. These designs often require AM (which can introduce limitations in the types and properties of material) since they result in complex geometries. However, a less-optimized extrusion or casting process might improve the manufacturability of the product.
Does the current design safeguard for future manufacturing? For new product introductions like microreactors that are at a lower technology readiness level, design teams might forego long-term considerations to meet strict prototype building or demonstration timelines. In such products, it is important to design for the future, i.e., in the context of manufacturing, designers should consider the implications of full-rate production (FRP) even at a preliminary design stage. This is because changing early design decisions at a later stage can become difficult and costly. It is much less expensive in the long run to scale a FRP design to a prototype build than it is to carry a prototype solution with poor manufacturability through a full product lifecycle.
The overall goal of DFM is to simplify the manufacturing process through a thorough analysis of the practicality of the manufacturing process, ensuring the simplest manufacturing process is chosen, and evaluating the manufacturing process for the future state of the manufacturing. Every manufacturing process has its advantages and disadvantages that need to be considered during the development process. DFA is just as critical as DFM considerations; difficult assembly steps will add cost to the final product and may lead to quality issues.[Citation26,Citation42] While designing parts, it is beneficial to consider how the part or assembly process would be assembled by a robot, regardless of whether the process is ultimately intended to be automated. This ensures a simple design that embodies the DFA methodology. If a design is simple enough for a robot to assembly without clever fixturing or processes, then a human operator will likely be able to assemble the product easily as well.
A.II. LEAN DESIGN SCORING
Lean Design Scoring is Munro and Associates’ standardized system to evaluate the simplicity of an assembly process. The score measures the handling difficulties for an operator to assemble a product and is used to evaluate the producibility of the product. The higher the score, the more the design needs to be optimized for assembly. Scoring the design has two substeps: get the part and put the part. Get the part focuses on picking the part up (e.g., What problems will a robot encounter when it tries to remove the part from the shipping container and gets ready to put it into place?) and the part-to-operator interface (e.g., What problems will a robot face when it is handling the part before the put into place?), and put the part evaluates issues in the part-to-part interface of the assembly.
The scoring metrics are based on design features that violate the good design principles (described in Sec. A.IV) and make the product harder to assemble. Each design feature that violates the good design principles adds to the score, and therefore, a part with a higher score needs more design improvements. All scores are independent and additive so that all metrics are considered. Note that, as mentioned in Sec. II, these concepts are based on the DFA theory that if an action is designed for a robot, it would be easy enough for a human to perform. A summary of the scoring metrics is presented in .
TABLE A.I Summary of Lean Design Scoring Metrics
A commercial microreactor design and manufacturing team should evaluate each scoring metric to determine if the issues are present for each given component. They should then work together to evaluate each part and determine ways to reduce the score, thereby eliminating the issues that a robot or operator would encounter during assembly. By eliminating the issues, the team reduces the score, which will improve the simplicity of the design related to its manufacturability. The guidance was applied to the MARVEL reactor use case in order to determine the most optimal approach for assembly and manufacture.
A.III. REDUCTION OF COMPLEXITY
Reducing the overall complexity of the product enables improvements to the manufacturing and assembly processes by eliminating processes that could bring issues. One methodology for reducing product complexity is through the part value challenge. The approach is primarily focused on eliminating nonvalue-added parts; all parts present in a design require manufacturing consideration and by eliminating the nonvalue-added parts, manufacturability will be improved. The approach asks two questions to determine if the part can be considered a good part:
Does the part have to move? If the part must move relative to all other parts, then it is a good part because there is a fundamental need for it within the product. If the part does not have to move, then it is a part that should be integrated with another part or eliminated from the product.
Does the part have to be a fundamentally different material? If there is a design-related requirement that forces a part to be a different material, then the part is a good part since, again, there is a fundamental need for it within the product.
This approach was followed for every component of the MARVEL reactor to recommend potential modifications to the design to improve manufacturability. This provided an opportunity to remove redundant parts or to combine parts, thereby improving manufacturability.
A.IV. GOOD DESIGN PRINCIPLES
The good design principles approach, developed by Munro,[Citation26] focuses on eliminating nonvalue-added parts, specifically fasteners, to improve the overall manufacturability of the product, thereby forcing design engineers to consider a robot while designing a product. The theory is the same as the part value challenge; eliminating nonvalue-added parts/processes improves manufacturability by reducing parts/processes that will have to be considered for manufacturing. The good design principles seek to eliminate fasteners, as they are poor quality drivers and require multiple operations/hands to fasten (e.g., ). The rest of the good design principles helps to drive the design to be easier for a robot to assemble. These principles, all of which are aimed toward improving manufacturability and ease of assembly, are listed as follows:
Combine separate parts and eliminate fasteners. Combining parts helps reduce part counts, which improves simplicity.
Eliminate separate fasteners. Eliminating separate fasteners reduces the overall part and step counts, which leads to a simplified process.
Reduce overall fastener variation within the product. This design principle is meant to focus on the standardization of the fastener types and lengths where possible to reduce the potential for an assembly mistake.
Reduce the parts and steps. Every part and step has an associated Lean Design score to determine the manufacturability of the product. As these parts and steps are eliminated, the overall Lean Design score of the product improves, which translates to improved manufacturability.
Follow top-down assembly (use gravity). Adding operations or steps to rotate a product for assembly increases the Lean Design score because a robot will have more handling steps. Focusing on top-down assembly will eliminate these steps and operations, thus improving the Lean Design score.
Design parts that self-locate. Parts that require an operator to locate them increases the potential for manufacturing issues. They also are not ideal for a robot, as it is unable to critically think or visually determine whether parts are in the correct location. To ensure these are properly assembled, clever processes or fixturing are developed that add cost and complexity to the manufacturing process.
Eliminate welding fixtures. Welding fixtures are complex tooling fixtures that add manufacturing complexity and cost. The complexity of the tools and the processes required to properly set up components to be welded together increase the Lean Design score.
Design for bulk material handling. A robot is only able to retrieve parts out of bulk handling packaging without incurring additional penalties from the Lean Design score. Ensuring that all parts can be handled in returnable dunnage, or another form of bulk material handling, will reduce the Lean Design score.
Integrate cabling. Wire harnesses and electrical cables require multiple hands and complex routing that are difficult for a robot. Integrating the cable by integrating interconnected line replaceable units or reducing the individual cables enables easier handling and routing, which improves the manufacturability.
Eliminate poka-yoke issues. If a poka-yoke (defined in ) issue exists, the design has created a condition in which an operator can assemble a product incorrectly without knowing. These kinds of issues would not be easily detectable by a robot, thus the Lean Design score will increase. Poka-yokes are among the worst possible design issues from an assembly standpoint and will greatly increase the Lean Design score.
Fig. A.2. Illustration of good design principles by eliminating fasteners and minimizing parts.
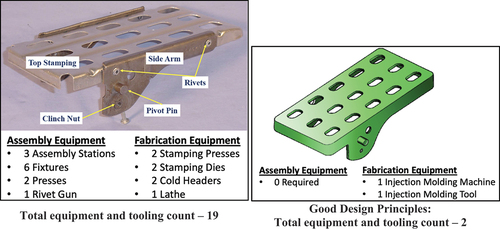
By adhering to the good design principles, the Lean Design score for the MARVEL reactor was reduced, and this reduction led to a product that was easier to assemble for a robot or operator. A design adhering to the good design principles will have optimized manufacturability and is in alignment with DFM/DFA standards. provides a hypothetical example of how a part can be modified to incorporate these design principles. In this example, while the component cost for the design on the right might be higher than the most expensive part being integrated, the total cost of the product will be lower by virtue of requiring fewer parts and less equipment and steps to assemble. This is particularly true in the nuclear industry where each part carries a substantial certification cost.
A.V. ASSEMBLY LINE LAYOUTS FOR MASS PRODUCTION
Assembly lines are a key aspect of mass production and determine the sequence in which various parts are assembled to create a product. Various types of assembly line layouts have been adopted in the industry, and the suitability of a certain type of line layout depends on the product and the required production rate. The choice of a certain line layout significantly affects the economics of the mass production process.[Citation44] There are three standard assembly line layouts commonly utilized in manufacturing facilities. These lines are classified as: static, moving, and indexing lines. These line layouts provide different advantages for various product configurations, as shown in . The layouts are briefly described here. A more detailed description of these layouts can be found in Ref. [Citation26]:
Static line. A static line is an assembly process where the product remains stationary during assembly. The product is assembled in a single location while the assembly technicians, tools, and components are brought to the line. This type of assembly line is commonly seen with low-volume production and/or assemblies that are large; this is common in the aerospace and shipbuilding industries.
Moving line. A moving line is an assembly line that is continuously moving from station to station at a fixed rate that is equal to or slightly faster than the required takt time. When the in-process assembly enters any given station, the operators at that station will move with the product as they complete the required operation. If operators at a station fails to complete the operation before the product enters the next station, they must stop the entire line to finish the operation at their station. The most common application that this type of layout is used in is the automotive industry.Footnoteb
Indexing line, An indexing line is an assembly line that can be modeled in two ways: a linear or rotary layout. Synchronous indexing lines are akin to the moving line layout, in that the movement of the product is tied directly to cycle time and the line moves simultaneously; however, in the indexing line, the product stops at each individual workstation. Conversely, in a moving line, the product will move continuously. In an asynchronous indexing line, individual stations operate on their own cycle time, driven by the time required to complete the tasks at the workstation. Asynchronous indexing is ideal when line balancing is required, when buffering is needed due to drastically varying cycle times, or if the task of a particular workstation cannot be completed on the line (e.g., welding and machining). Examples of synchronous indexing line layouts include beverage bottling operations and packaging processes. Asynchronous indexing line layouts are used in instances where the product has diverse process times.
Fig. A.3. Qualitative comparison between different line layouts.
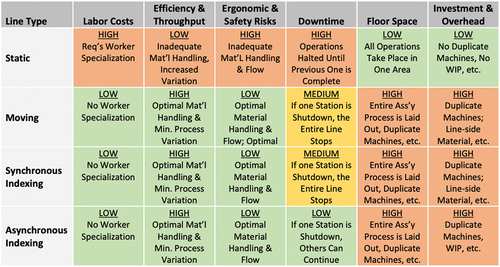
A.VI. ADVANCED PRODUCT QUALITY PLANNING
Advanced product quality planning is a structured framework for product and process design that is focused primarily on predicting and preventing failure (80%), and secondarily, on detecting it (20%). This framework is a standardized set of quality requirements that enable suppliers and manufacturers to design a product that meets the necessary quality and reliability requirements. It is typically executed by a cross-functional team involving product design, procurement, manufacturing, and quality.
APQP ensures the quality strategy is clearly understood and translated into requirements, technical specifications, and special characteristics. APQP is a standard process that is widely followed in nonnuclear sectors, such as automotive and aerospace. While sector-specific standards exist for APQP (e.g., International Automotive Task Force 16949 for automotive[Citation25] and AS9100D for aerospace[Citation45]), most APQP processes are based on the International Organization for Standardization (ISO) 9001 standard,[Citation46] which is informed by decades of experience in numerous manufacturing sectors.
Advanced product quality planning is broken into five different phases (shown in ) as complex products and supply chains present ample opportunities for failure, particularly when new products are being launched. The first three phases are focused on planning and prevention, while the remaining two are centered around validation, corrective actions, and continual improvement. These phases are as follows:
Fig. A.4. APQP process flow.
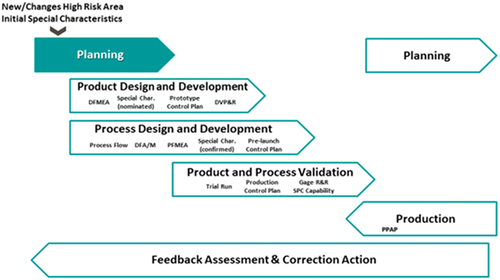
Phase 0–Preplanning. APQP begins with assumptions, concepts, and past knowledge. Bookshelf knowledge and standard work practices are listed as well as areas where significant change is expected. This phase compiles the inputs into Phase 1–Plan and Define.
Phase 1–Plan and Define. This phase links customer expectations, wants, needs, and desires to requirements. Plan development assures the output of this section is satisfactory product quality. Resource planning, process, and product assumptions are made. A list of preliminary special characteristics and design/reliability goals are also established.
Phase 2–Product Design and Development. The focus in phase 2 is on product design and development. Geometries, design features, details, tolerances, and refinements of special characteristics are all reviewed in a formal design review. Design verification through prototypes and testing are also part of this phase. Tools that typically provide great benefit in this phase are DFMA, design failure mode and effects analysis, and design verification plan and report.
Phase 3–Process Design and Development. Phase 3 explores manufacturing techniques and measurement methods that will be used to bring the design engineer’s vision into reality. Process flow charts, process failure mode and effects analysis, and control plan methodology are examples of tools used in this phase.
Phase 4–Product and Process Validation. Validation of the process quality and volume capabilities is the focus of phase 4. Statistical process control, measurement systems analysis, and process capability studies are introduced in this phase. The product part approval process is ready for submission and production begins upon approval.
Phase 5–Feedback Assessment and Corrective Action. Phase 5 includes learning from the ongoing manufacturing process, risk reduction, corrective actions (both internal and external), eight disciplines of problem solving, and the capture of information pertinent for future use.
Advanced product quality planning in the nuclear field is performed using quality assurance as prescribed by 10 CFR Part 50 Appendix B, “Quality Assurance Criteria for Nuclear Power Plants and Fuel Reprocessing Plants.”[Citation27] Specific guidance is provided in the American Society of Mechanical Engineers NQA-1 standard,[Citation47,Citation48] which is followed by suppliers and manufacturers for earning the NQA-1 certification. Although this process includes several features that are in ISO 9001 standards,[Citation46] they are still developed with an emphasis on large, stationary, stick-built reactors. Products like microreactors that are built in a factory might need a more nimble and flexible quality assurance process that involves frequent changes in design as needed when following a DFM/DFA philosophy.