
 ?Mathematical formulae have been encoded as MathML and are displayed in this HTML version using MathJax in order to improve their display. Uncheck the box to turn MathJax off. This feature requires Javascript. Click on a formula to zoom.
Abstract
In this work, a detailed reevaluation of a past power-to-melt experiment performed within the so-called High Burnup Chemistry project is provided. A pressurized water reactor–type UO2 fuel rod was base irradiated in Belgian Reactor 3 up to a peak pellet burnup of 60 MWd/kgU. After base irradiation, the rod experienced a power ramp experiment in Belgian Reactor 2, reaching a ramp terminal level of 70 kW/m (later adjusted to 66 kW/m). Extensive post-irradiation examination was performed after both the base irradiation and the power ramp experiment. After the power ramp experiment, rod cladding failure and local fuel melting were observed. Fuel melting was observed in an 85-mm region around the peak power pellet with a normalized molten fuel radius in the range r/r0 = 0.20 to 0.27. The threshold power for melting derived from this experiment was 63.0 ± 4.4 kW/m.
I. INTRODUCTION
Nuclear energy provides an important contribution to the “low carbon” energy sources in the worldwide energy mix. While renewables, such as wind and solar, are intermittent by definition, nuclear power plants are traditionally designed to work at 100% nominal power. In recent years, to better complement intermittent sources, efforts are ongoing to improve the flexibility of nuclear power plants for so-called load-following.[Citation1] However, the operational safety limits of the nuclear fuels employed today are based on potential fast incidental scenarios that are deemed too conservative for the slow transients associated with load-following, thus hindering efficient plant operation. On the other hand, there is only limited experimental data available to substantiate any relaxation of the currently applied operational limits.
In order to address this knowledge gap, the power-to-melt and maneuverability (P2M) experimental program aims at better understanding fuel phenomena during slow transients at high power. This joint experimental program was organized within the Organisation for Economic Co-operation and Development/Nuclear Energy Agency (OECD/NEA) Framework for Irradiation Experiments (FIDES).[Citation2] In the program, staircase transients at high power with high-burnup fuel segments refabricated from commercial fuel pins are planned in the Belgian Reactor 2 (BR2). The objective of the foreseen transients is to achieve local melting within the fuel pellets without failure of the cladding.
In preparation for these experiments, simulations with fuel performance codes were essential to evaluate the appropriate boundary conditions. State-of-the-art one-dimensional (1-D) and three-dimensional (3-D) fuel performance codes, such as 1-D ALCYONE,[Citation3,Citation4] 1-D TRANSURANUS,[Citation5] 1-D CYRANO3,[Citation6,Citation7] and 3-D BISON,[Citation8] etc., (see Ref. [Citation9] for all codes used in the P2M simulation exercise) were benchmarked within the P2M exercise. For this simulation benchmark, two power ramp experiments were chosen as reference; namely, the high-burnup chemistry experiment 4 (HBC4) performed in 1987 in the BR2 and the xM3 experiment performed in 2005 in the Studsvik R2. Both selected experiments represent the limiting cases for a fast transient (HBC4) and a slow staircase transient (xM3).
The present paper presents the detailed description and critical assessment of the HBC4 power ramp experiment (see Ref. [Citation10] and references therein). The aim of this test was to bring the fuel rod to sufficiently high power (70 kW/m peak level, but later adjusted to 66 kW/m) to obtain fuel melting in the central part of the rod and fuel pellet, but not aiming at clad failure. The fuel rod reached a burnup of 60 MWd/kgU during its base irradiation in the Belgian Reactor 3 (BR3).
This paper is organized as follows. Following this introduction, the fuel rod design is provided in Sec. II. Section III deals with the base irradiation conditions and post-irradiation examination (PIE) of the fuel rod. Section IV describes the power ramp and PIE. This paper is finalized with conclusions in Sec. V.
II. FUEL ROD DESIGN
A standard BELGONUCLEAIRE uranium oxide (UO2) fuel rod irradiated in the BR3 was used for the ramp experiment. The basic rod design is shown in together with its main dimensions and design parameters. The cladding tube, bottom and top end plugs, and spacer are constructed of Zircaloy 4 (Zr-4). The cladding tube was cold worked and stress relieved by annealing at 540°C for 2.5 h.
TABLE I Fuel Rod Design Parameters, Including Geometry, Fuel Pellet, and Cladding Data
The fuel had an initial enrichment of 8.25 wt% 235U, and the rod was prepressurized with helium at 20 bar. The fuel pellets and rods were fabricated by Franco-Belge de Fabrication de Combustible in Dessel, Belgium. The assembly loading was carried out by BELGONUCLEAIRE in Dessel, Belgium. The cladding tube was fabricated by VDM AG, Werk Duisburg, Germany, from an ingot provided by Teledyne Wah Chang, Albany, Oregon. The mechanical characteristics, dimensions, and roughness of the cladding tube are summarized in .
Tensile tests were performed on three samples per lot at room temperature according to American Society for Testing and Materials ASTM-E8 and at 400°C according to ASTM-E21, with a strain rate between 0.5 to 1%/min, in order to determine the 0.2% yield strength, rupture strength, and total elongation. The inner and outer surfaces of the tube were clean and bright. The surface finish was obtained by sand blasting with SiC (grain size 240 µm) for the inner surface and by wet grinding with SiC (grain size 600 µm) for the outer surface of the tubes. The obtained roughness inside and outside and the axial and transversal are reported in . The reported values are based on measurements performed at the top, middle, and bottom of the cladding tube.
The UO2 fuel pellets were fabricated from ammonium diuranate (ADU)–UO2 powder. The UO2 powder was blended and prepelletized, then broken, and after homogenization, pelletized in cold conditions, sintered, and centerless ground. The last fabrication step consisted of washing and drying the pellets. The stoichiometry of the sintered pellets was measured by the gravimetric method. The isotopic composition of the fuel was determined on the UO2 powders by mass spectrometry. The geometrical density was obtained by measurement of the height, diameter, and weight of 70 pellets from the sintering lot. The dish volume was calculated from the dish diameter and depth, measured on two pellets per sintering lot. For the densification measurement, a resintering test was performed at 1740°C for 5 h on six pellets from the same batch.
The microstructure of the pellets showed a fine homogeneously distributed porosity. The grain size measurements were performed on the ceramographies of three pellets in the batch. The mean linear intercept measurement method was applied on the outer edge, mid-radius, and center of each pellet. The average value is reported in .
The surface quality of the pellets was examined visually by comparison to standard pellets. The latter illustrate the type and magnitude of permissible surface defects. Thus, in all cases, the pellet surface quality was better than the following standard: pellets contain cracks and fissures with widths ≤0.1 mm and less than four surface pits with dimensions ≤1.0 mm; chips on the edges do not exceed 0.5 mm in depth and a total surface area of ≤10 mm2, with no single chip with a surface area >6 mm2; and hairline cracks in the pellets have a width ≤0.1 mm and length ≤10 mm.
In order to avoid the appearance of inter-pellet gaps during rod handling, a spring was inserted in the top plenum. The spring was manufactured from stainless steel DIN 1.4300, according to German specification (American Iron and Steel Institute AISI 302). Its details are provided in .
III. BASE IRRADIATION
III.A. Irradiation Conditions
The fuel rod was irradiated during three cycles in the BR3 in Mol, Belgium, in the period 1976 to 1983. The BR3 was the first prototype pressurized water reactor (PWR) in Europe and was in service between 1962 and 1987. The BR3 core consisted of a hexagonal core containing fuel assemblies composed of 28 rods. The channels in the reactor were designed to represent a reduced scale 17 × 17 lattice. The main characteristics of the BR3 are given in .
TABLE II BR3 Core Data
The power, flux, and burnup in the fuel rod for the specific BR3 core configuration were calculated using the British LWR-WIMS neutronic code.[Citation11] The power history resulting from these neutronic calculations of the fuel rod is shown in , together with its flux/power profile at the beginning, middle, and end of cycle. The same profiles were found irrespective of the specific irradiation cycle.
Fig. 1. (a) Evolution of the LHGR during the three reactor cycles and (b) Power/flux profile at the beginning, middle, and end of a reactor cycle.
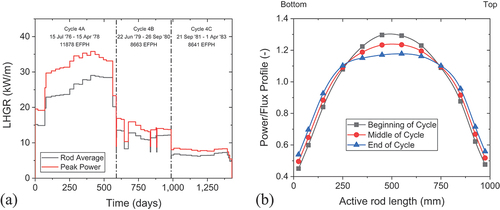
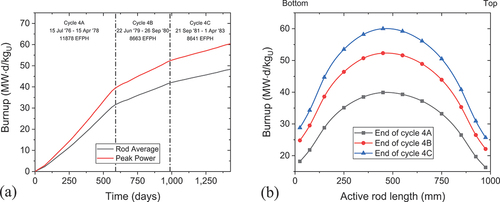
The calculated evolution of the rod burnup, i.e., the rod average and peak pellet, are shown in together with the axial burnup profile after the first, second, and third irradiation cycles.
Fig. 2. (a) Evolution of the burnup during the three reactor cycles and (b) Burnup profile at the end of cycles 4A, 4B, and 4C.
III.B. Nondestructive PIEs
As the fuel rod was used in the power ramp experiment without reprocessing, only nondestructive PIEs were performed. Detailed visual inspection of the fuel rod was performed using stereo-microscopy and eddy current testing. The waterside surface of the fuel rod appeared smooth and dark gray due to zirconium oxide. No significant defects were detected, not by visual inspection or eddy current testing. However, axial scratches as well as random bright scratch marks were observed. These scratches were introduced during rod extraction and insertion, as well as manipulations in hot cells. Analysis of the eddy current testing signals did not indicate any cladding internal defect. However, ridge formation due to pellet-cladding mechanical interaction was observed, extending over most of the fuel column length.
The overall rod length was measured taking into account temperature corrections with a precision of 0.01 mm. However, due to rod bow effects, a more conservative uncertainty of 0.1 mm was taken. The resulting rod length L was 1140.35 mm (at 20°C), corresponding to a 0.44% increase after irradiation.
Fuel rod profilometry was performed with a precision of 0.005 mm. From the profilometry measurements, the average creep down was computed at 20 equally spaced axial positions on the active rod length. Hereby, the diameter of the rod in the plenum was taken as reference, i.e., 9.508 mm, as it is confirmed (see ) not to change after irradiation. On the same grit, the clad ovality (maximum diameter minus minimum diameter) at each position was also computed. The resulting creep down and ovality along the active rod length are plotted in . The measured clad ovality was relatively small and constant along the active rod length. The cladding creep down amounts up to 0.57% at the center of the active rod.
Fig. 3. (a) Average creep down and ovality along the active rod length after base irradiation and (b) Changes in the rod geometry after base irradiation.
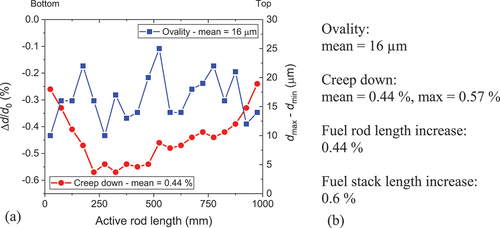
Neutronography of the fuel rod showed that the fuel column did not show any unusual features and no dish filling occurred. From the neutron radiograph, the fuel stack length was measured (accuracy ≤1 mm) and a 0.6% increase was observed after irradiation.
After a cooling time of 4 years, gamma spectroscopy was performed on the fuel rod. The activity of 137Cs (half-life 30.1 years) was measured and correlated to the burnup. The measured axial profile is compared to the calculated burnup profile in . Clearly, the calculated profile follows the measured profile closely. Gamma spectrometry was performed at mid-pellet positions, except for the peak burnup range (around 500 mm from rod bottom end) and at the bottom and top of the fuel column, where spectra were acquired with a smaller step size. One observes strong Cs activity variations in the peak burnup zone, indicating local Cs migration. Also, at the peripheral positions of the rod, higher Cs activity is observed, indicative of axial migration of Cs over longer distances and accumulation at the cold peripheral parts and end power peaking that is usual for irradiation in the BR3. For completeness, the calculated fast fluence profile is added to .
Fig. 4. (a) Comparison of the 137Cs activity profile with the calculated burnup. For completeness, the fast fluence (>1 MeV) profiles are added to the plot. (b) Comparison between the experimentally determined and calculated burnup and fast fluence.
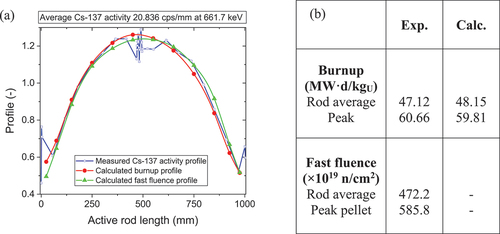
The absolute burnup axial distribution was determined by the so-called “burnotheque” system developed and validated in the 1970s at SCK CEN.[Citation12,Citation13] The principle of the method is based on the correlation between the 137Cs gamma activity of a fuel sample and its burnup. The method applies a calibration curve with the 137Cs gamma activity of the fuel samples as measured by the nondestructive gamma spectrometry equipment for fuel rods with burnup as determined by radiochemical methods of a sibling sample (usually an adjacent sample from the same rod). It is noted that the transformation of the 137Cs gamma activity into the absolute burnup takes into account the 137Cs decay correction during and after irradiation, as well as the mass of the investigated fuel material. Typically, accuracies around 3% (two sigma) can be obtained. The average rod burnup and peak pellet burnup are compared to the calculated ones in . Clearly, the calculated burnup falls well within the experimental uncertainty.
To perform an assessment of the fractional fission gas release, a puncture test and gas analysis were performed on a sibling fuel rod that was irradiated in the same assembly. The fuel rod was punctured in the plenum region and the gas extracted. The total volume and chemical content of the collected gas were determined, as well as the final free volume inside the rod. The obtained data are summarized in .
TABLE III Fission Gas Release Data Measured in the Sibling Rod
IV. POWER RAMP EXPERIMENT
IV.A. Irradiation Conditions
The power ramp experiment was performed in 1987 in the BR2 in Mol, Belgium. The BR2 is a materials testing reactor in operation since 1962.
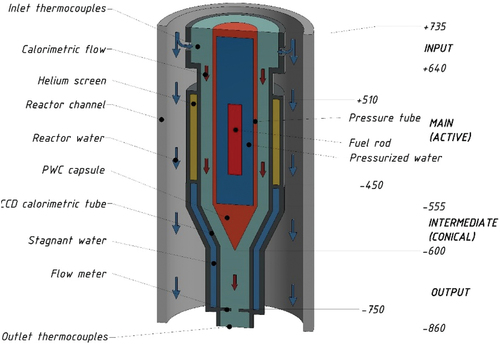
The ramp test was performed in the pressurized water capsule (PWC) and calorimetric device (CD).[Citation14] A schematic drawing of the PWC-CD irradiation rig in the reactor channel is shown in . The PWC-CD is an instrumented irradiation capsule for single fuel rod (segments) testing under steady-state or transient conditions. The target fuel rod is placed into the stainless steel capsule filled with stagnant water. For the present experiment, the water was pressurized to 142 bar. The heat generated in the rod is radially dissipated through the stagnant water toward the outer surface of the pressure capsule by natural convection, with or without boiling, depending on the irradiation conditions. Generally, boiling is considered the dominant heat transfer mechanism above 20 kW/m, resulting in a stable clad temperature at powers above this power level.
Fig. 5. Schematic drawing of PWC and CD used in the ramp test. The dimensions are in millimeters from the core mid-plane.
A correlation between the local linear power and the cladding temperature was obtained by out-of-pile measurements using an electrically heated rod equipped with thermocouples on the outer cladding surface. The obtained correlation for stagnant water at 142 bar is given as
For zero or negligible power levels (<0.5 kW/m) during the startup and shutdown of the reactor, the temperature of the cladding and capsule water were close to the temperature of the primary coolant of the BR2, which is typically between 20°C to 30°C during these phases.
The PWC capsule is cooled by the reactor water (25°C to 50°C) flowing into the CD. The normal flow rate is ~1 L/s, leading to a heat transfer coefficient of about 20 kW/(m2·K) on the outer surface of the capsule. The CD is a classic flow calorimeter allowing for monitoring the thermal performance of the coolant flowing through it (see ) using a diaphragm flowmeter and thermocouples placed at the inlet and outlet. A 1-m-high 3He screen was present on the outer surface of the CD. The 3He screen serves as a thermal neutron shield and allows for flux, and hence power changes, by pressure changes in the 3He screen (see also ).
Fig. 6. (a) Detailed evolution of the peak LHGR during the startup, preconditioning, and power ramp and (b) Power profile during the ramp test.
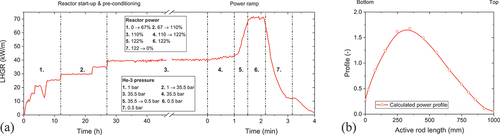
The linear heat generation rate (LHGR) during reactor startup, preconditioning, and power ramp is shown in . The power profile during the ramp terminal power stage is also shown. This power profile almost does not change during the different stages of the experiment (the power peak position shifts by only 5 mm from the preconditioning phase to the ramp terminal power stage). Based on this power history, the cladding temperature can be derived from correlation 1.
During reactor startup, the power was increased slowly (5%/min) in steps of 5 kW/m between levels 10 to 40 kW/m (steps 1 and 2 in ). The preconditioning level of 40 kW/m was maintained for 20 h (step 3 in ). This preconditioning level was chosen in order to limit fuel restructuring (mainly to avoid the formation of a central hole).
The power ramp was executed in two consecutive steps: (1) an increase in reactor power to 122% for 60 s to reach 44.1 kW/m with an average ramp rate of 0.048 kW/m/s (step 4 in ), followed by (2) depressurization of the 3He screen during 30 s to reach the ramp terminal level of 70.5 kW/m with an average ramp rate of 1.2 kW/m/s (step 5 in ). The ramp terminal level was maintained for 40 s (step 6 in ) and was followed by a reactor reverse lasting approximately 60 s with a negative ramp rate of 1.0 kW/m/s (step 7 in ).
During the 3He depressurization and the reactor reverse, the power was considered to vary at the same rate as the cobalt self-powered neutron detector (SPND) signal. Therefore, the reported ramp rates for the depressurization and reactor reverse corresponded to the relative evolutions of the SPND signals. It should be noted that these ramp rates are considered to be the average power variation rate to reach 63% of the total power variation. In , the ramp rates plotted for the depressurization and reactor reverse are the average ramp rates, although the actual power ramp rate was not constant during the power variation.
The ramp terminal power level of 70.5 kW/m was calculated from the average linear heat generated by the fuel rod and an axial power distribution factor of 1.68. The respective power shape factor and the axial power distribution were calculated from the measured relative axial thermal flux distribution, the residual enrichment profile, the unperturbed thermal and epithermal neutron fluxes, the nuclear heating, and the 3He pressure in the CD screen. The position of the peak pellet can then be determined from the axial power distribution. The accuracy of the calculated peak pellet heat generation is 10% or better, including a 4% relative error for the determination of the power shape factor.
IV.B. Post-Irradiation Examination
IV.B.1. Nondestructive Examination
Detailed visual inspection and eddy current testing were performed on the fuel rod. illustrates the axial locations of the different cracks, which are documented with pictures in the same figure. Eddy current testing clearly indicated the severely damaged cladding in the fractured area. In addition, the eddy current tests indicated fuel clad interaction (ridges) that were much more pronounced than before the ramp test, but without significant clad defects.
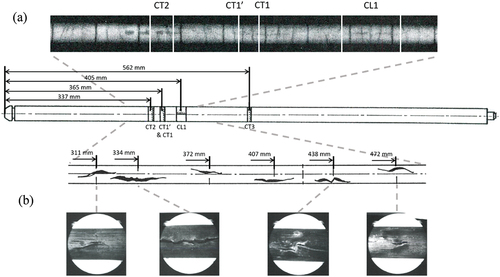
Fig. 7. (a) Neutron radiographs of the same section. The cutting scheme based on the nondestructive analysis is indicated on the fuel rod and (b) Locations of the damaged rod sections enriched with images of the cracks.
Profilometry was applied to the fuel rod, although it was severely damaged. The obtained diameter along the rod length is plotted in . In the cracked area, the mean diameter increased from 9.45 mm to more than 9.75 mm over the cracks. The locations of the six cracks (see also ) were well identified by the six high peaks in the outer clad diameter and extended from 300 to 500 mm from the bottom of the rod. The mean diameter increase due to the ramp test amounted to 25 to 30 µm on both sides of the defected zone.
Fig. 8. Cladding outer diameter along the rod length from profilometry measurements. The molten zone, failed zone, and cut sections are indicated in the plot.
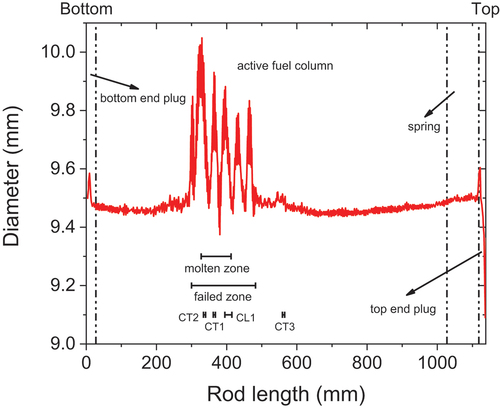
Somewhat unexpectedly, a diameter increase (40 µm) was also observed slightly above the zone with clad failure at 560 mm from the bottom of the rod and was interpreted as due to a slightly higher local power at the position of the BR3 spacer grid during base irradiation. At that position, local burnup was lower by about 5%, as indicated by a gross gamma scan of the rod.
Neutron radiographs of the damaged section of the fuel rod are presented in . The neutron radiographs show dish filling and severe pellet cracking in the high-power zone, as well as the three zones where voids were observed in the peak power region of the fuel column, i.e., CT1 (and CT1’), CT2, and CL1, indicated in . These voids are separated by completely filled sections and are likely the result of fuel melting. The central voids cannot be the result of columnar grain formation because in that case, they should be continuous along the column with respect to their quite large diameter (more than 1 mm).
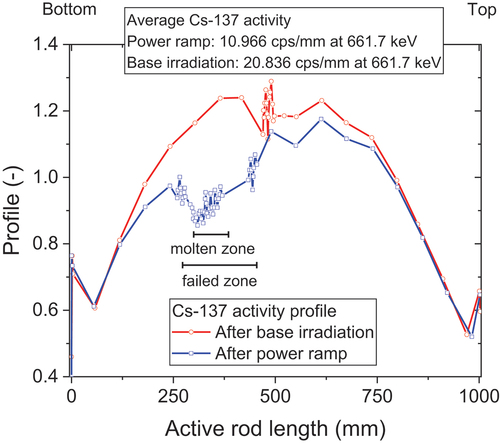
After about 5 months of cooling, gamma spectroscopy was performed on the fuel rod. The axial 137Cs (half-life 30.0 year–volatile) activity profiles before and after the power ramp are compared in . The profiles show an important depression of 137Cs between levels 260 and 460 mm from the bottom of the fuel stack after the power ramp due to the washing of 137Cs through the cladding cracks. The total loss of 137Cs (over the complete active rod length) was evaluated to be 8% (±1%).
Fig. 9. Axial 137Cs profiles after base irradiation and the power ramp. The molten and failed zones are indicated in the plot.
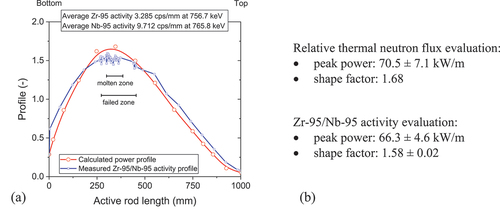
The axial 95Zr and 95Nb (half-life 64.05 days–nonvolatile) activity profile is compared to the power profile calculated from the thermal neutron flux in the channel in . These short-lived isotopes are proportional to the integral power profile applied during the power ramp experiment. The profiles differ by around 6%, and the experimental curve is understood to be more reliable than the calculated profile. The power shape factor obtained from the 95Zr5/95Nb activity profile is 1.58 ± 0.02. By applying this shape factor, the ramp terminal level becomes 66.3 kW/m, which is estimated with a relative accuracy of 7% or better.
Fig. 10. (a) Comparison between 95Zr/95Nb activity profile and the power profile calculated from thermal neutron flux in the reactor channel. The molten and failed zones are indicated in the plot. (b) Comparison between the peak power and shape factor obtained by both methods.
IV.B.2. Destructive Examination
Four fuel rod samples were cut following the scheme presented in and further detailed in for the ceramographic-metallographic and autoradiographic examinations. The samples were selected based on the nondestructive examinations; namely, CT1, CT1’, and CT2, which are transversal sections where local melt and cladding failure were observed; CL1, which is a longitudinal section through the centerline where local melt and cladding failure were observed; and CT3, which is a transversal section where significant swelling but no local melt or cladding failure were observed. Section CT1’ is the same as CT1 after ~1 mm of polishing.
TABLE IV Sample Details for Destructive Analyses, Where the Reported Ramp Terminal Level Was Obtained from the 95Zr/95Nb Activity Profiles
Macrographs and alpha- and beta-gamma autoradiographs of the selected cross sections are presented in . In the figure, the highly restructured fuel corresponding to the molten zone is indicated by red dashed lines. The alpha autoradiographs clearly show the central voids and indicate uniform activity across the sections with increased activity at the pellet rim. Electron probe microanalysis across a pellet showed a homogeneous Nd distribution across the pellet diameter (0.9 r0) and enhanced Nd concentration at the pellet rim (0.1 r0). The Nd buildup (burnup indicator) indicates enhanced burnup due to Pu buildup in the rim of the pellet.
Fig. 11. Macrographs and alpha- and beta-gamma autoradiographs of the cross-sections CT1, CT2, CT3, and CL1. The molten fuel zone is indicated by red dashed lines. The zones in green show the pellet-pellet interface.
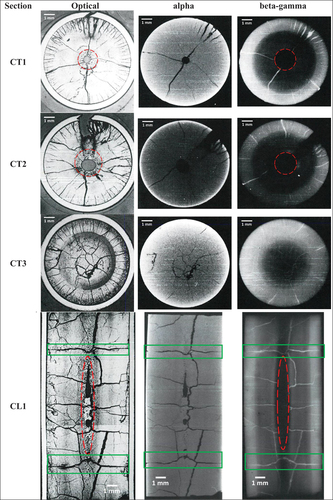
The beta-gamma autoradiographs show a well-defined dark activity zone inside and adjacent to a gray activity-depleted ring that is surrounded by a light activity zone adjacent to the clad in sections CT1, CT2, and CL1. The dark activity boundary in the center corresponds to the highly restructured fuel (associated with local melting) around the central voids observed in the macrographs CT1, CT2, and CL1. Section CL1 shows that the dark activity zone is spindle shaped and is larger at pellet mid-height. The radii of these dark zones correspond to (maximum) ,
, and
for CT1, CT2, and CL1, respectively.
The higher activity in the outer region of all cross sections suggests that the volatile fission products migrated to the cooler outside region. The gray activity-depleted zone extends up to in the sections CT1, CT2, and CL1 and up to
in section CT3.
The macrographs of the CT1 and CT2 cross sections (see ) show the cladding ruptures that are typically low-ductile stress-corrosion cracking failures. The cross sections are located, respectively, at the end (CT1) and at the middle (CT2) of a longitudinal crack. The fuel pellet at the position of the fractured cladding is very badly cracked, with lost fuel fragments (likely during the metallographic preparation) from the pellet opposite to the cladding defect in CT2.
Radial cracking predominates in the fuel with thermally induced large radial cracks extending from the pellet rim toward the inner surface of the central hole. In addition, abundant radial cracking due to thermal and mechanical stresses is observed in the outermost pellet region of all transversal sections (CT1, CT2, and CT3).
The pellet diameter measured on the macrographs showed an increase of about 6% (taking into account a correction for the surface increase due to fracturing) in the molten fuel region, whereas the diameter increased by 2% in the nonmolten fuel zone (CT3). The significant fuel swelling in the molten zone was partly attributed to the 9.6% phase-change volume expansion of UO2 during melting.[Citation15]
A zoom-in and more detailed analysis of the transversal sections (CT1, CT1’, CT2, and CT3) and longitudinal section (CL1), where local melting was observed, are shown in and .
Fig. 12. Images of the transversal sections CT1, CT1’, and CT2 where molten zones were observed. The molten zone is encircled with red dashed lines. The blue dash-dotted line indicates the boundary between the fuel at the periphery with the original microstructure and the highly restructured fuel due to fission gas release. All images were taken as polished, except for the zoom-ins, which were taken from etched samples.
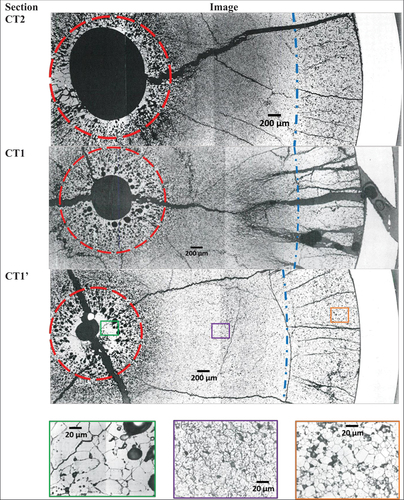
Fig. 13. Image of the longitudinal section CL1 and zoom-in of the molten zone. The molten zone is indicated in by a red dashed line. The zones in green show the pellet-pellet interface.
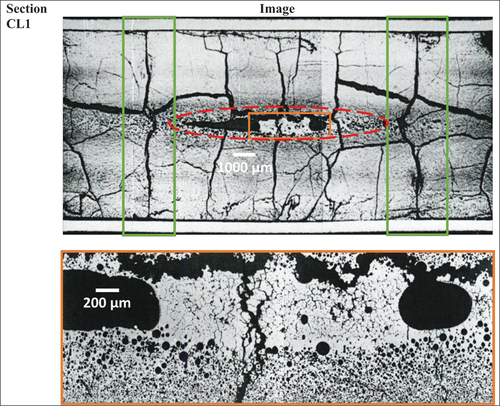
At the fuel periphery (, indicated by the blue dash-dotted line), the as-fabricated fuel microstructure is recognized (note that significant grain pullout occurred in that zone). Inside the grains, second-phase acicular precipitates (black dots in the grains), generally attributed to local formation of U4O9, were often observed.[Citation16,Citation17]
A sharp transition in fuel restructuring, characterized by massive intragranular fission gas bubble precipitation, is observed for . The radial location of that transition corresponds to the outer circumference of the gray activity zone on the beta-gamma autoradiographs (see ). Continuing toward the pellet centerline, the size of the intragranular bubbles increases and bubble precipitation at grain boundaries, pore coalescence, and metallic fission product precipitation are observed. In that intermediate zone, the grain size seems to remain unchanged, although it is difficult to evaluate due to the intense bubble precipitation.
The central void is surrounded by a well-defined highly restructured fuel zone (limited by the red dashed line). The highly restructured fuel is characterized by very large and highly dense UO2 grains (>50 µm), the appearance of large spherical or pear-shaped pores oriented in a radial direction, and the agglomeration of metallic fission products into large spherical ingots and/or in the central void.
Here, the structural boundary between the high-density UO2 fuel containing large spherical or pear-shaped pores and the surrounding fuel restructuring zone was defined as the melt radius.[Citation15,Citation18] The radius of this zone also corresponds to the dark activity-depleted core observed in the beta-gamma autoradiographies. We note that these estimates are based on visual interpretation.
The formation of the central void resulted from shrinkage and slumping of the molten fuel during shutdown. Axial fuel relocation is evidenced by examining the CT1 and CT1’ cross sections (CT1’ was obtained by incremental downward polishing of CT1). Although the radius of the restructured central zone is equivalent, CT1’ shows a smaller central void surrounded by a larger amount of high-density and pore-free UO2 fuel. In CL1, the irregular profile of the central void, which occupied about 33% of the pellet length, illustrates the relocation of the molten fuel.
A zoom-in and detailed analysis of the transversal section CT3, where no local melting or clad failure was observed, is shown in . Similar to the cases where melt was observed, at the fuel periphery (, limited by the blue dash-dotted line), the as-fabricated fuel microstructure with acicular second phase precipitates (black dots in the grains) is observed.
Fig. 14. Images of the transversal section CT3 where no melt was observed. The central region is encircled by the dashed line. The blue dash-dotted line indicates the boundary between the fuel at the periphery with the original microstructure and the highly restructured fuel due to fission gas release. All images were taken as polished, except for the zoom-ins, which were taken from etched samples.
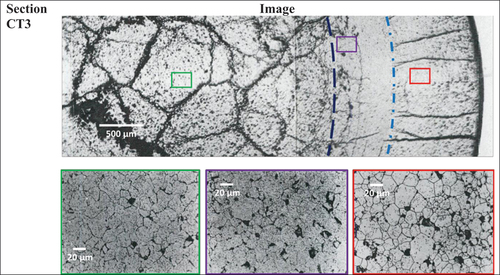
For , a transition zone from inside the peripheral region to the highly restructured central region is characterized by abundant intragranular fission product precipitation and pore formation (≤1 µm). The central region (
, limited by the dashed line) exhibits an irregular pattern of circumferential cracks and less-defined radial cracks. Significant porosity developed at the grain boundaries, which could have led to grain separation during the heavy transient. In turn, this could have led to the formation of the network of cracks caused by pellet contraction after post irradiation.
The neutronography, supported with ceramography and alpha- and beta-gamma autoradiographs, combined with the power profile derived from 95Zr/95Nb gamma spectroscopy, led to the best-estimate threshold power for melting of 63.0 ± 4.4 kW/m.[Citation10]
IV.C. Fuel Rod Failure
During the power ramp experiment, the detection of possible fuel rod failure was made through the follow up of the activity of the PWC capsule water. At different moments in time during the experiment, 20 cm3 of PWC water samples were taken from one of two sampling locations within the PWC (see ). Each sample was taken via one of two lines located either at the top of the PWC (~1 m above the fuel rod) or at the bottom of the PWC (just below the fuel rod). At each location and moment in time, two samples (A and B) were taken for later analysis at two different labs at SCK CEN. The results of the analyses are provided in . At the moment of sampling, only the reading of a radiation detector along the sampling lines at the top and bottom of the PWC were available. Based on experience from previous transient experiments, these readings were not interpreted as rod failure. During depressurization, 5 h after the power ramp, increased activity due to fission product release was clearly observed.
TABLE V Isotopic Analyses of the 20-cm3 PWC Water Samples Taken at Different Locations and Moments of the Experiment
The isotopic analyses of the PWC water samples indicated substantial amounts of activity for the first samples (1A and 1B) taken at the bottom of the PWC. These measurements indicated leaks in the rod cladding before the end of step 2 (see ), i.e., at a peak power level lower or equal to 35 kW/m.
The PIE confirmed the presence of numerous incipient cracks, generally propagating 10 to 30 µm into the cladding, sometimes deeper. It should be kept in mind that the power increments to reach the preconditioning power were performed with intermittent holding times varying between 20 min and several hours (see ) and the power increment rates were 5%/min for the power variations during the preconditioning stages. This scenario was implemented to avoid clad damage. Nevertheless, the very low terminal power at the end of base irradiation (8 kW/m peak power during 12 months and declining to 5 kW/m at the end of the last BR3 cycle), and the PWC operating conditions (saturation temperature was reached at 22 kW/m or higher) led, respectively, to a high hoop stress state and low stress relaxation rate during the preconditioning stage. The precautions taken during the preconditioning stage therefore may have been insufficiently effective.
As shown in , many nonpenetrating incipient cracks were observed in the cladding. However, as evidenced by the contamination of the PWC water in the later stage of preconditioning (see ), at least one incipient crack penetrated the cladding (such a crack is not shown in ). No indications were observed of any fuel degradation, indicating that the small penetration of the cladding did not enable significant water ingress during the remainder of the preconditioning stage. The fuel remained in strong pellet-clad contact until the end of the experiment because no power dips occurred in the late stages of preconditioning.
Fig. 15. Image of the transversal section CT1 showing incipient cracks next to the cladding failure. The zoom-in shows three radial incipient cracks.
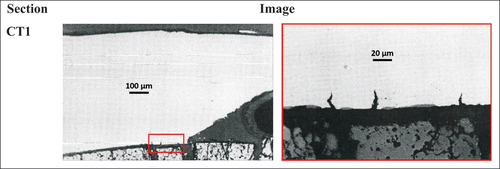
During the subsequent fast power transient, mechanical overload resulted in multiple macroscopic clad failures (see ), which were interpreted as being initiated from incipient cracks.[Citation10] The latter is illustrated in , where a radial incipient crack developed into mechanical failure of the cladding (45-deg crack).
Only the first samples (1A and 1B), taken via a sampling line close to the rod, revealed substantial amounts of activity from short-living fission products. The concentrations were close to, but below the alarm threshold. In subsequent samples, taken from a sampling line at the top of the PWC, only very minor activities were detected, far below the alarm level. The discrepancy between sampling at the two different positions was attributed to problems with the top-level sampling. The absence of alarms and the absence of activity from samples 2 through 6 may also be attributed to sampling problems.
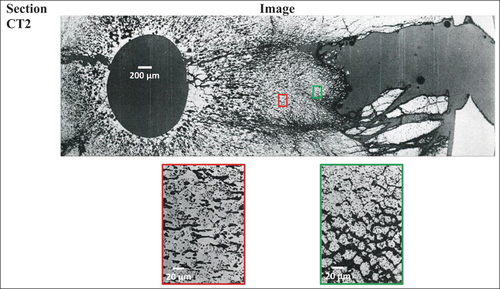
shows the examination of the fuel microstructure next to the cladding failure. The figure shows extremely swelled fuel with extensive grain boundary separation and radially oriented pores away from the center toward the failed cladding. This observation suggests displacement of the central once-molten zone toward the cladding defect and is consistent with dramatic rod failure during the power ramp.
Fig. 16. Images of the transversal section CT2 near the failed cladding. The zoom-ins show extremely swelled fuel that could correspond to once molten fuel.
V. CONCLUSIONS
The selected fuel rod for the power ramp experiment was a PWR-type rod with standard pelletized UO2 fuel pellets irradiated in a reduced scale 17 × 17 assembly (BR3) up to a final peak pellet burnup of 60 MWd/kgU.
After nondestructive characterization (thermomechanical behavior after base irradiation and experimental burnup determination), the rod was used for the power ramp in a PWC in the BR2.
The target power of ~70 kW/m (66.3 ± 4.6 kW/m as derived from the 95Zr/95Nb gamma spectrometry PIE analysis) was reached during the power ramp and maintained for 40s. At the end of the experiment, cladding failure was detected.
Fuel melting during the power ramp was evidenced through the neutronography, ceramography, and beta-gamma autoradiographic examinations. In the peak power region of the fuel column, voids were observed. These voids are separated by sections that were completely filled, which indicates local fuel melting. The threshold power for melting derived from this experiment was 63.0 ± 4.4 kW/m (power derived from the 95Zr/95Nb gamma spectrometry PIE analysis).[Citation10]
The large central voids that result from shrinkage and slumping of the molten fuel during shutdown are surrounded by well-defined highly restructured fuel zones composed of high-density fuel, large spherical or radially oriented pear-shaped bubbles, and agglomeration of metallic products into large ingots. Besides the radial relocation, axial relocation of molten fuel also was observed.
A significant increase in pellet diameter was measured in the molten fuel region of about 6%, compared to 2% in the adjacent nonmolten fuel zone. That marked fuel swelling was partly the result of the 9.6% phase-change volume expansion of UO2 during melting.
Fuel melting was observed in an 85-mm region around the peak power pellet (300 to 385 mm from the bottom of the rod). The molten fuel radii in the investigated samples were in the range r/r0 = 0.20 to 0.27.
Incipient cracks were likely formed during the preconditioning stage (≤35 kW/m). The sampling performed at 35 kW/m indicated that at least one of these incipient cracks penetrated the cladding. Upon reaching the ramp terminal level, they led to multiple macroscopic clad failures at six axial locations. No evidence was observed for fuel degradation related to water ingress into the incipient cracks or during the clad failures at the ramp terminal level. The fuel melting behavior during the terminal ramp (melting threshold, radial or axial extent) was not affected by the incipient crack formation. It is noted that this reassessment of the failure analysis was not available at the start of the simulation exercise of which the results are described in this special issue.
With respect to the planned power ramp within the P2M program, the following recommendations and conclusions are made:
The preconditioning power level should be similar to the power level of the last cycle of the rod during base irradiation. A preconditioning power significantly exceeding the last cycle base irradiation power (40 kW/m versus 8 kW/m) likely contributed to the early clad penetration.
A slow staircase power ramp is preferred over a fast one. The slow staircase power ramp allows for stress relaxation in the cladding, thereby reducing the risk of clad failure at the ramp terminal level.
The threshold power for melting derived from this experiment was 63.0 ± 4.4 kW/m.
Acknowledgments
The P2M experimental program is an activity conducted and funded through the NEA joint international project FIDES. Dr. V. D’Ambrosi is kindly acknowledged for fruitful discussions during the preparation of this paper.
Disclosure Statement
No potential conflict of interest was reported by the authors.
References
- “Nuclear Power in a Clean Energy System,” International Atomic Energy Report (May 2019); https://www.iea.org/reports/nuclear-power-in-a-clean-energy-system.
- “Power to Melt and Maneuverability (P2M)–FIDES Joint ExpErimental Programme (JEEP)” Nuclear Energy Agency (2020); https://oecd-nea.org/jcms/pl_70378/power-to-melt-and-maneuverability-p2m-fides-joint-experimental-programme-jeep.
- B. MICHEL et al., “Modeling of Pellet Cladding Interaction,” J. Nucl. Mater., 3, 677 (2012); http://dx.doi.org/10.1016/B978-0-08-056033-5.00074-4.
- J. SERCOMBE, B. MICHEL, and C. RIGLET-MARTIAL, “2.14—Modelling of Pellet Cladding Interaction,” Comprehensive Nuclear Materials, R. KONINGS and R. STOLLER, Eds., Elsevier, Oxford (2020).
- A. MAGNI et al., “The TRANSURANUS Fuel Performance Code,” Nuclear Power Plant Design and Analysis Codes, pp. 161–205, Elsevier (2021); http://dx.doi.org/10.1016/B978-0-12-818190-4.00008-5.
- D. BARON et al., “CYRANO3: The EDF Fuel Performance Code Especially Designed for Engineering Applications,” Proc. WRFPM 2008, Paper No.8032, Seoul, Korea, October 19–23, 2008.
- R. LARGENTON and G. THOUVENIN, “CYRANO3: The EDF Fuel Performance Code—Global Overview and Recent Developments on Fission Gas Modelling,” Proc. WRFPM 2014, Paper No.100032, Sendai, Japan, September 14–17, 2014.
- R. WILLIAMSON et al., “Multidimensional Multiphysics Simulation of Nuclear Fuel Behavior,” J. Nucl. Mater., 423, 1–3, 149 (2012); http://dx.doi.org/10.1016/j.jnucmat.2012.01.012.
- V. D’AMBROSI et al., “P2M Simulation Exercise on Past Fuel Melting Irradiation Experiments,” Nucl. Technol., 210, 2, 189 (2023); https://doi.org/10.1080/00295450.2023.2194270.
- P. BLANPAIN, “HBC Task 3 Power-to-Melt Experiment,” HBC 89/10, BN 06324/221, Belgonucleaire, Dessel, Belgium (1989).
- M. J. HALSALL, “LWR-WIMS, a Computer Code for Light Water Reactor Lattice Calculations,” AEEW-R–1498, UKAEA Atomic Energy Establishment, Winfrith,United Kingdom (1982).
- H. ADACHI, J. BASSELIER, and L. LEENDERS, “Burnotheque—A Valuable Standard for Accurate Burnup Determination by Non-Destructive Examination,” Proc. First ESARDA Symp., p. 162 (April 1979).
- P. BLANPAIN, L. LEENDERS, and H. U. ZWICKY, “Non-Destructive Burnup Determination: Experimental Investigation on Low Burnup Gadolinia Fuel,” IAEA Technical Committee Mtg. Burnup Determination Water Reactor Fuel, Karlsruhe, Germany, June 13–16, 1988.
- B. BOER and M. VERWERFT, “Qualification of the New Pressurized Water Capsule (PWC) for Fuel Testing at BR2,” Proc. RRFM 2021, Helsinki, Finland, September 26–30, 2021.
- M. D. FRESHLEY, “Operation with Fuel Melting,” Nucl. Eng. Des., 21, 254 (1972); http://dx.doi.org/10.1016/0029-5493(72)90076-3.
- B. E. SCHANER, “Metallographic Determination of the UO2-U4O9 Phase Diagram,” J. Nucl. Mater., 2, 2, 110 (1960); http://dx.doi.org/10.1016/0022-3115(60)90038-6.
- A. LEENAERS et al., “Oxidation of Spent UO2 Fuel Stored in Moist Environment,” J. Nucl. Mater., 317, 2–3, 226 (2003); http://dx.doi.org/10.1016/S0022-3115(03)00104-1.
- J. A. CHRISTENSEN, “Thermal Expansion and Change in Volume on Melting for Uranium Dioxide,” HW-75148, Hanford Atomic Products Operation, United States (Oct. 1962).