
Abstract
Measurements of high-energy neutrons through shield penetration and maze streaming were performed at the Conseil Européen pour la Recherche Nucléaire (CERN) High-energy Accelerator Mixed-Field (CHARM) facility. The protons of 24 GeV/c were injected onto a 50-cm-thick copper target and the released neutrons were transmitted through shields and a maze in the facility. The transmitted neutrons in the shield and maze were measured using activation detectors placed behind various materials and thicknesses of the shields and at several locations in the maze. From the radionuclide production rates in the activation detectors, the attenuation profiles though the shield thickness and along the maze were obtained for the reactions of 209Bi(n,xn)210-xBi(x = 4–9), 27Al(n,α)24Na, 115In(n,n’)115mIn, and 12C(n,2n)11C. Monte Carlo simulations were performed with three codes, PHITS, FLUKA, and GEANT, which had good agreement with the measurements within a factor of 2 for the production rates.
I. INTRODUCTION
A number of particle accelerator facilities have been constructed for physics, medical, and industrial use. Accelerator specifications have been upgraded to enhance the intensity and energy of the particle beam to provide better statistics and more efficient irradiation. To ensure radiation safety in such facilities, the prompt and residual radiation levels should be predicted from the data of secondary neutrons generated by beam irradiation. The neutrons from high-power accelerators are highly penetrative and require a massive shield to suppress the radiation levels outside the facility. As the radiation shield occupies a considerable portion of the total construction costs, the shielding design is very important when constructing high-intensity and high-energy accelerator facilities. Recently, Monte Carlo simulation have been widely used for the shielding designs in such facilities. Therefore, reliable benchmark experimental data are indispensable for clarifying the accuracy of the simulation results. However, this has not been well validated because reliable experiments are scarcely reported.
In the Takasaki Ion Accelerators for Advanced Radiation Application (TIARA) of the Japan Atomic Energy Research Institute (currently the National Institutes for Quantum and Radiological Science and Technology), 40- and 65-MeV quasi-monoenergetic neutrons have been produced by proton beams, and the neutron energy spectra have been measured behind concrete,Citation1 iron,Citation2 and polyethyleneCitation3 shields. At the Alternating Gradient Synchrotron (AGS) in Brookhaven National Laboratory, a shielding experiment with a mercury spallation target bombarded with 24-GeV protons was performed, and attenuation lengths for concrete and iron were experimentally evaluated.Citation4 At the High Energy Accelerator Research Organization (KEK) spallation neutron source (KENS) facility using a 500-MeV proton beam, the attenuation of neutrons in the forward direction through the concrete shield was measured.Citation5 In the Conseil Européen pour la Recherche Nucléaire (CERN)-European Union High Energy Reference Field (CERF) facility, a 120 GeV/c positive-hadron beam was directed at a thick copper target and the neutron energy spectra between 32 and 380 MeV were measured behind lateral shields of concrete and iron.Citation6
A number of measurements of neutron streaming at mazes have also been conducted, but most of them have been for fission neutrons. For high-energy neutrons above 20 MeV, experimental data of maze streaming are very scarce. A measurement of high-energy neutron streaming at a maze was conducted by Tanaka et al.Citation7 at the TIARA. In the experiment, neutrons were produced at a thick copper target bombarded by a 68-MeV proton beam, and the neutron energy spectra along the maze were measured using an organic liquid scintillator and Bonner spheres. It was reported that dose-equivalent distributions estimated from the experimental results agreed within a factor of 3 with that calculated by the empirical formula. However, the accuracy of Monte Carlo calculations was not confirmed with the experiment.
This paper reports on the study of experimentally evaluated high-energy neutron fluxes for a lateral shield and a maze at a high-energy proton accelerator facility. At the CERN High-energy AcceleRator Mixed-field (CHARM) facility,Citation8,Citation9 benchmark experiments of a bulk shield penetration in 2015 (CitationRefs. 10, Citation11, and Citation12), a modified shield from 2016 to 2022 (CitationRefs. 13 and Citation14), and a maze streaming in 2018 (CitationRef. 15) were performed. The Monte Carlo simulations were carried out and comparisons with the experimental results are discussed.
II. EXPERIMENT
II.A. Facility
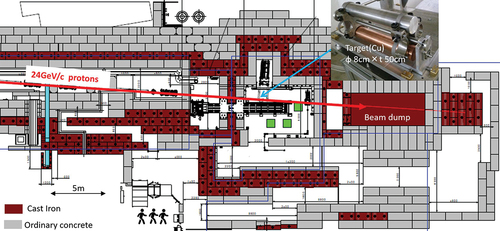
shows the horizontal structure of the CHARM facility in the east hall at CERN. The 24 GeV/c protons are transported from the proton synchrotron and injected into a copper target (8-cm diameter × 50-cm thickness) located at the center of the facility. The protons not interacting with the target are transported into an iron beam dump placed downstream. The proton beam line and target room are surrounded by ordinary concrete and cast-iron shields. The target room can only be accessed through a maze.
Fig. 1. Horizontal structure of the CHARM facility.
and show the vertical shielding structure of the CHARM facility for the original shield structure in 2015 and the one modified at the beginning of 2016, which is perpendicular to the beam axis at the target location. The target center is positioned on the beam line, which is 129 cm above the floor. To the right of the target in and , there is a four-layer movable shield wall of iron and concrete. Each of the shield layers is 20 cm thick. Above the ceiling of the target room, located 240 cm above the beam line, a bulk shield is constructed of 80-cm-thick cast iron and 360-cm-thick ordinary concrete. A 10-cm-thick marble ceiling is installed 185 cm above the beam line (below the iron ceiling). The densities of the concrete, the cast iron, and the marble of the bulk shield are 2.4, 7.2, and 2.71 g/cm3, respectively.
Fig. 2. Vertical cross section of the original shield structure in the CHARM facility perpendicular to the beam axis at the target location. The beam travels from the front to back of this figure.
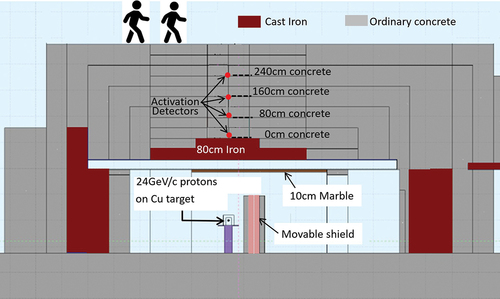
Fig. 3. Vertical cross section of the modified shield structure in the CHARM facility perpendicular to the beam axis at the target location. The beam travels from the front to back of this figure.
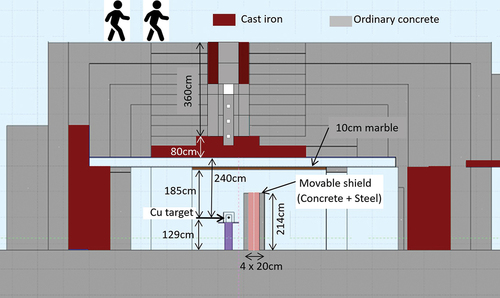
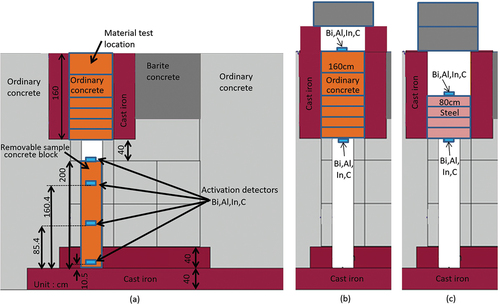
As shown in the modified shield of and , two setups of the shielding experiment, a removable sample block and a material test location, are arranged in the vertical shield just above the target. The removable sample block, made of ordinary concrete with three detector holes at different heights, is placed on a 40-cm-thick iron slab just above the target room ceiling. In the material test location, positioned just above the removable sample block, various test shield blocks can be installed.
Fig. 4. Locations of the activation detectors and configurations of the measurement in the modified shield structure showing shielding experiments with (a) the removable sample concrete block, and (b) concrete and (c) steel shields in the material test location.
II.B. Activation Detector Samples and Experimental Setup
The neutrons transmitted upward through the original bulk shield were measured by activation detector samples composed of bismuth and aluminum, which are widely used in high-energy neutron measurements.Citation16 The bismuth and aluminum detectors were each prepared in two sizes: 8.0-cm diameter × 1.0-cm thickness and 4.0-cm diameter × 0.4-cm thickness. The sample size was varied because the neutron intensity varies inside the shielding. Parts of the concrete blocks were removed from the top of the shield, and the samples were placed at concrete shield depths of 0, 80, 160, and 240 cm, as shown in . After setting the samples, the removed blocks were replaced for the beam irradiation.
For the modified shielding structure shown in and , neutrons were measured using activation detectors of bismuth, aluminum, indium, and graphite, and the two sizes mentioned previously were placed at various shield locations. As shown in , the samples were placed at four locations (three holes and the top of the removable block). On the other hand, for the material test location experiment in and , samples were placed upon ordinary concrete slabs of 40- to 160-cm thicknesses, and steel slabs of 20- to 80-cm thicknesses were equipped by changing the material and the thickness. The densities of the concrete and the steel of the test shielding material were 2.23 and 7.77 g/cm3, respectively.
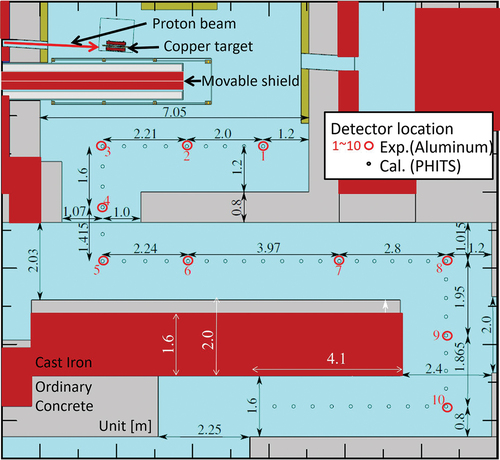
The streaming neurons through the maze were measure by aluminum activation detector of the two sizes, which were varied depending on the neutron intensity. The detectors were placed at 10 locations () at the beam line height and the horizontal center along the five legs of the maze.
Fig. 5. Maze structure and detector locations.
Generally, from the radionuclide production rate in the activation detectors, the attenuation profiles through the various shielding materials were obtained for the reactions of 209Bi(n,xn)210-xBi(x = 4–9), 27Al(n,α)24Na, 115In(n,n’)115mIn, and 12C(n,2n)11C.
II.C. Beam Irradiation
The intensity of the 24 GeV/c proton beam at CHARM was 6.7 × 10¹⁰ proton/s (CitationRef. 17) in the maximum. The relative beam intensity was monitored by a secondary emission chamber. In the bulk shielding experiment, the beam irradiation was carried out for about 1 to 18 h, including the night period, depending on the sample. The beam was temporarily stopped after the irradiation period to remove the irradiated samples and to install new samples at the corresponding locations. In the maze experiment, the beam irradiation was carried out for about 2.5 days over the weekend.
II.D. Radioactivity Measurements
The removed samples were transported to the CERN gamma-spectrometry laboratory, and the energy spectra of the photons from the radionuclides generated in the samples by the 209Bi(n,xn)210-xBi (where x = 4 to 9), 27Al(n,α)24Na, 115In(n,n’)115mIn, 27Al(n,α)24Na, and 12C(n,2n)11C reactions were measured by a high-purity germanium-semiconductor detector (Ge-detector). To estimate the radioactivity of the corresponding nuclides with short (201Bi and 202Bi), medium (203Bi and 204Bi), and long (205Bi and 206Bi) half-lives, the bismuth samples were measured continuously three times for 3, 15, and 24 h, respectively. The aluminum samples were measured for times between 3 and 24 h, depending on the peak count rates of the photons from 24Na. For others, measuring times were 4 h for the indium samples and 15 to 30 min for the graphite samples.
II.E. Data Analysis
lists the analyzed radionuclide production reactions, half-lives, and photon energies with their emission ratios. The net counts of the photopeak at the corresponding photon energies were analyzed, and the production rates of the radionuclides in the activation detector samples per proton beam irradiation were estimated from the photopeak efficiencies of the Ge-detector and the beam intensity fluctuations during the irradiation. The efficiencies of the Ge-detector were estimated in LabSOCS softwareCitation18 (Mirion Technologies, Canberra KK).
TABLE I Production Reactions, Half-Lives, and Photon Energies of the Radionuclides in the Activation Detectors
III. MONTE CARLO SIMULATIONS
A Monte Carlo simulation was performed with the Particle and Heavy Ion Transport code SystemCitation19 (PHITS) Version 3.02 to simulate neutron flux distribution in the original bulk shield. For the reactions of neutrons above 20 MeV and protons, the evaporation model GEM (CitationRef. 20) was used; for neutrons up to 3 GeV, the intranuclear cascade model INCL (CitationRef. 21) was used; and for high-energy nuclear reactions above 3 GeV, the JAM modelCitation22 was used in the PHITS code. For neutrons below 20 MeV, the JENDL-4.0 data libraryCitation23 was used.
Since the structure of the original upper bulk shield in this facility was comparatively simple and wide, the calculation of two steps was performed with a simplified geometry to shorten the calculation time. First, the angular and energy spectra of the neutrons above 1 MeV produced from the copper target injected by the 24 GeV/c proton beam were simulated. The obtained energy spectrum at 90 deg was chosen as the source term for the second-step calculation with the deep shield. Disk-shaped slabs with a sufficiently wide radius (10 m), including a 10-cm-thick marble, an 80-cm-thick iron, and 800-cm-thick concrete were placed in order from the source position.
A pencil beam of the source neutrons was injected into the center of the marble slab. To ensure good neutron statistics in the deep-shield region, a variance reduction technique (importance method) was applied in the second-step calculation. Using surface-crossing estimators in a 40-cm-thick interval in the concrete, the neutrons in the whole planes of the 10-m radius at the same depths were integrated, and the neutron energy spectra were estimated. This method was equivalent to the one-dimensional calculation for a plane source. The absolute values of the energy spectra were finally divided by the square of distances between the target and the corresponding estimator planes to obtain the results as a point source.
For the modified shielding structure, Monte Carlo simulations were performed with the FLUctuating KAskade code (FLUKA) version 4-2.2 distributed by the FLUKA.CERN collaboration,Citation24,Citation25 the PHITS version 3.24, and the GEometry ANd Tracking (GEANT) version 4.10.07-02 (CitationRefs. 26 and Citation27). In the simulations, the geometries of the detailed shield structure were described. A track-length estimator was used for scoring the particle in the detector regions to estimate particle fluxes. An importance method for the variance reduction technique was also used to get better statistics. For all simulations, the energy spectra of the scored particles were estimated above thermal energy for FLUKA, 0.1 MeV for PHITS, and 0.315 MeV for GEANT4 calculations.
Simulations for the maze were performed with PHITS version 3.10 and FLUKA. The geometries of the detailed shield structure, shown in , were described in the simulations. The neutron energy spectra were obtained using track-length estimators that were placed at the horizontal center of the maze at the beam line height along the five legs. The locations of these estimators included the corresponding 10 experimental positions.
The radionuclide production rates were estimated by folding (multiplying and integrating) the simulated energy spectra with the cross-section data for 209Bi(n,xn)210-xBi (x = 4–9), 27Al(n,α)24Na, 115In(n,n’)115mIn, and 12C(n,2n)11C evaluated by Maekawa et al.Citation28
IV. RESULTS AND DISCUSSIONS
The experimental attenuation profiles of the radionuclide production rates through the original bulk shield are shown in , and those through the modified shield structure are shown in , and , while those along the maze are shown in . The errors in these figures are the statistical errors of the photon counting data. The uncertainties in the Ge-detector efficiency by LabSOCS (CitationRef. 18) and the beam monitor calibrationCitation10 (4.3% and 7%, respectively) are not included in the figures. For comparison, the simulation results are also shown in the figures.
Fig. 6. Comparison of experimental and simulated attenuation profiles of the radionuclide production rates in the original shield structure in the CHARM facility.
Fig. 7. Attenuation profile of experimental and calculated production rates as a function of concrete thickness for the removable block configuration.
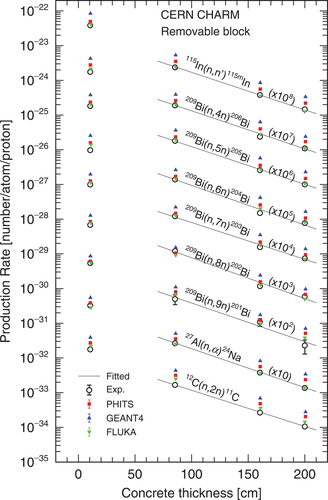
Fig. 8. Attenuation profile of experimental and calculated production rates as a function of concrete thickness in the material test location.
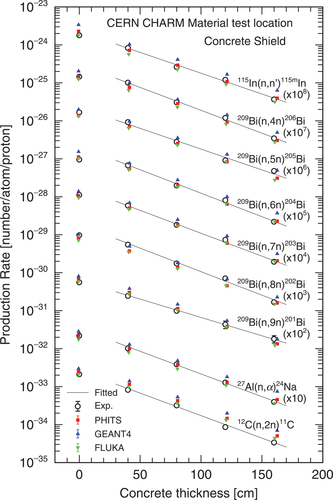
Fig. 9. Attenuation profile of experimental and calculated production rates as a function of steel thickness in the material test location.
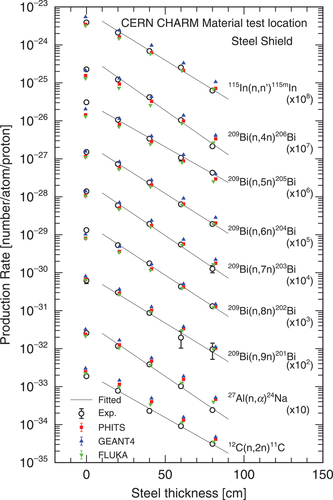
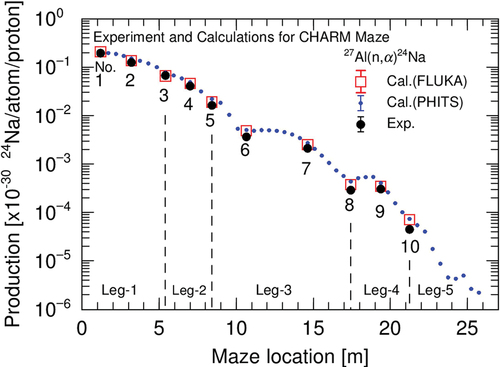
Fig. 10. Attenuation profile of experimental production rates along the maze compared with the calculated ones.
In , the production rates decreased exponentially with increasing depth through the original bulk shield. The simulated production rates generally agreed with the measured values, especially for 24Na and 206Bi. The simulated and experimental production rates of 24Na and 206Bi agreed within ~20%, and those of 205Bi, 204Bi, and 203Bi agreed within 30% to 50%. Although the simulated production rates of 202Bi and 201Bi showed overestimation, they deviated within a factor of 2 from the measured rates.
For the modified shielding structure, simulated production rates were compared with the experimental data, as shown in , and for the removable block, concrete, and steel shield, respectively. For the removable block, FLUKA gave good agreement with the experiment within around 10%. On the other hand, overestimations by 35% to 60% for PHITS and by a factor of 2 for GEANT4 can be found. For the concrete and steel shields, agreements can be seen within 30% for FLUKA, within 20% for PHITS, and within 40% for GEANT4.
For the maze streaming shown in , it is observed that the 24Na production rates decreased with the distance from the target along the maze. The simulated production rates generally agreed with the measured values, especially in the first and second legs. Although overestimations of the simulation can be seen in the third and fourth legs, the discrepancies are up to a factor of 2. Around experimental location 9, higher production rates than those around location 8 can be observed both in the experimental and simulated data. It was clarified by the simulation that this phenomenon is caused by a contribution of high-energy neutrons penetrating a direct path through the 0.8-m-thick shield between the first and third legs.
V. CONCLUSION
The attenuation of neutrons through the original bulk concrete shield, various thicknesses of the concrete and steel shields, and along the maze were measured using activation detectors in the CHARM facility at CERN with a 24 GeV/c proton beam. The radionuclide production rates of the 209Bi(n,xn)210-xBi (x = 4–9), 27Al(n,α)24Na, 115In(n,n’)115mIn, and 12C(n,2n)11C reactions were measured. The results of Monte Carlo simulations reasonably agreed with the measured data within a factor of 2. This work provides useful benchmark experimental data for a deep-shield penetration and maze streaming in a high-energy proton accelerator facility. The results are expected to improve our understanding of shielding design in future high-energy accelerator facilities.
Acknowledgments
The authors are deeply grateful to the accelerator operation staff and the experimental groups at the IRRAD and the CHARM facilities for their helpful support with the experiment. They are also grateful to the staff of the gamma-spectrometry laboratory at CERN for their support in the measurement and analysis of the Ge-detectors.
Disclosure Statement
No potential conflict of interest was reported by the authors.
References
- N. NAKAO et al., “Transmission Through Shields of Quasi-Monoenergetic Neutrons Generated by 43- and 68-MeV Protons: Part I—Concrete Shielding Experiment and Calculation for Practical Application,” Nucl. Sci. Eng., 124, 228 (1996); https://doi.org/10.13182/NSE96-A28574.
- H. NAKASHIMA et al., “Transmission Through Shields of Quasi-Monoenergetic Neutrons Generated by 43- and 68-MeV Protons: Part II—Iron Shielding Experiment and Analysis for Investigating Calculation Methods and Cross Section Data,” Nucl. Sci. Eng., 124, 243 (1996): https://doi.org/10.13182/NSE96-A28575.
- N. NAKAO et al., “Measurements and Calculations of Neutron Energy Spectra Behind Polyethylene Shields Bombarded by 40- and 65-MeV Quasi-Monoenergetic Neutron Sources,” J. Nucl. Sci. Technol., 34, 4, 348 (1997); https://doi.org/10.1080/18811248.1997.9733674.
- H. NAKASHIMA et al., “Research Activities on Neutronics Under ASTE Collaboration at AGS/BNL,” J. Nucl. Sci. Technol., 39, Supplement 2, 1155 (2002); https://doi.org/10.1080/00223131.2002.10875307.
- N. NAKAO et al., “Arrangement of High-Energy Neutron Irradiation Field and Shielding Experiment Using 4 M Concrete at KENS,” Proc. 10th Int. Conf. on Radiation Shielding (ICRS10), pp. 553–557, Madeira, Portugal, May 9–14, 2004 (2005).
- N. NAKAO et al., “Measurement and Calculation of High-Energy Neutron Spectra Behind Shielding at the CERF 120 GeV/c Hadron Beam Facility,” Nucl. Instr. Meth. B, 266, 93 (2008); https://doi.org/10.1016/j.nimb.2007.09.043.
- S. TANAKA et al., “An Experimental Study on Radiation Streaming Through a Labyrinth in a Proton Accelerator Facility of Intermediate Energy,” Health Phys., 81, 4, 406 (2001); https://doi.org/10.1097/00004032-200110000-00005.
- R. FROESCHL, “Radiation Protection Assessment of the Proton Irradiation Facility and the CHARM Facility in the East Area,” Technical Report CERN-RP-2014-008-REPORTS-TN, EDMS 1355933, Conseil Européen pour la Recherche Nucléaire (2014).
- R. FROESCHL, M. BRUGGER, and S. ROESLER, “The CERN High Energy Accelerator Mixed Field (CHARM) Facility in the CERN PS East Experimental Area,” Proc. SATIF12, NEA/NSC/R(2015), p. 14, Batavia, Illinois (2014).
- E. ILIOPOULOU et al., “Measurements and FLUKA Simulations of Bismuth and Aluminum Activation at the CERN Shielding Benchmark Facility (CSBF),” Nucl. Instr. Meth., A855, 79 (2018); https://doi.org/10.1016/j.nima.2017.12.058.
- T. KAJIMOTO et al., “Neutron Energy Spectrum Measurement Using an NE213 Scintillator at CHARM,” Nucl. Instr. Meth., B429, 27 (2018); https://doi.org/10.1016/j.nimb.2018.05.024.
- N. NAKAO et al., “Attenuation Length of High Energy Neutrons Through a Thick Concrete Shield Measured by Activation Detectors at CHARM,” J. Nucl. Sci. Technol., 57, 9, 1022 (2020); https://doi.org/10.1080/00223131.2020.1751740.
- E. ILIOPOULOU et al., “Measurements and FLUKA Simulations of Bismuth and Aluminum Activation at the CERN Shielding Benchmark Facility (CSBF),” Nucl. Instr. Meth., A855, 79 (2018).
- E. LEE et al., “Energy Spectra of Neutrons Penetrating Concrete and Steel Shielding Blocks from 24 GeV/c Protons Incident on Thick Copper Target,” Nucl. Instr. Meth., A998, 165189 (2021); https://doi.org/10.1016/j.nima.2021.165189.
- N. NAKAO et al., “Measurements and Monte Carlo Simulations of High-Energy Neutron Streaming Through the Access Maze Using Activation Detectors at 24 GeV/c Proton Beam Facility of CERN/CHARM,” J. Nucl. Sci. Technol., 58, 8, 899 (2021); https://doi.org/10.1080/00223131.2021.1887003.
- N. NAKAO, Y. UWAMINO, and K. TANAKA, “Measurement of the Neutron Angular Distribution from a Beryllium Target Bombarded with a 345-MeV/u 238U Beam at the RIKEN RI Beam Factory,” Nucl. Instr. Meth., B423, 27 (2018); https://doi.org/10.1016/j.nimb.2018.02.036.
- L. GATIGNON, “Beam Properties for the East Area Irradiation Facility in the T8 Beam Line,” Technical Report EAT8, EDMS, CERN 1270807 (2013).
- F. L. BRONSON, “Validation of the Accuracy of the LabSOCS Software for Mathematical Efficiency Calibration of Ge Detectors for Typical Laboratory Samples,” J. Radioanal. Nucl. Chem., 255, 137 (2003); https://doi.org/10.1023/A:1022248318741.
- T. SATO et al., “Features of Particle and Heavy Ion Transport Code System PHITS Version 3.02,” J. Nucl. Sci. Technol., 55, 684 (2018); https://doi.org/10.1080/00223131.2017.1419890.
- S. FURIHATA, “Statistical Analysis of Light Fragment Production from Medium Energy Proton-Induced Reactions,” Nucl. Instrum. Meth. B, 171, 251 (2000); https://doi.org/10.1016/S0168-583X(00)00332-3.
- A. BOUDARD et al., “New Potentialities of the Li‘ege Intranuclear Cascade Model for Reactions Induced by Nucleons and Light Charged Particles,” Phys. Rev. C, 87, 014606 (2013); https://doi.org/10.1103/PhysRevC.87.014606.
- Y. NARA et al., “Relativistic Nuclear Collisions at 10A GeV Energies from p+Be to Au+Au with the Hadronic Cascade Model,” Phys. Rev. C, 61, 2, 024901 (2000); https://doi.org/10.1103/PhysRevC.61.024901.
- K. SHIBATA et al., “JENDL-4.0: A New Library for Nuclear Science and Engineering,” J. Nucl. Sci. Technol., 48, 1 (2011); https://doi.org/10.1080/18811248.2011.9711675.
- C. AHDIDA et al., “New Capabilities of the FLUKA Multi-Purpose Code,” Front. Phys., 9, 788253 (2022); https://doi.org/10.3389/fphy.2021.788253.
- G. BATTISTONI et al., “Overview of the FLUKA Code,” Ann. Nucl. Energy, 82, 10 (2015); https://doi.org/10.1016/j.anucene.2014.11.007.
- J. ALLISON et al., “Recent Developments in GEANT4,” Nucl. Instr. Meth., A835, 186 (2016); https://doi.org/10.1016/j.nima.2016.06.125.
- S. AGOSTINELLI et al., “Geant4—A Simulation Toolkit,” Nucl. Instr. Meth. A, 506, 250 (2003); https://doi.org/10.1016/S0168-9002(03)01368-8.
- F. MAEKAWA et al., “Production of a Dosimetry Cross Section Set Up to 50 MeV,” Proc. 10th Int. Symp. on Reactor Dosimetry, p. 417, Osaka, Japan, September 12–17, 1999, American Society for Testing and Materials ( 2001).