
ABSTRACT
The desmid Oocardium stratum is restricted to short sections of active limestone-precipitating springs (LPS) and adjacent headstreams. We studied the succession of photoautotrophic biofilms on artificial substrate at three sites in an LPS stream in spring, summer and autumn. We exposed frosted glass slides between 3 and 12 weeks, and measured calcium carbonate precipitation (CCP), nutrients and environmental parameters. Relative amounts of O. stratum, Bacillariophyceae and Cyanobacteria to overall biomass of the photoautotrophic biofilm were estimated by means of class-specific photosynthetic pigments. Overall, 77% of the photoautotrophic biomass consisted of diatoms, 20% were related to O. stratum and 3% were related to Cyanobacteria. Biomass of O. stratum and diatoms showed a significant correlation with CCP (r = 0.61 and 0.46), while for Cyanobacteria there was no significant correlation. CCP increased exponentially over time and peaked in late summer and late autumn (maximum CCP measured as ash mass was around 10 µg mm−2 week−1). We applied generalised multiple linear regression models (GLM) to evaluate the influence of stream site, weeks of exposure, season and CCP on biofilm development. According to GLM, the biomass of O. stratum was associated with site, exposure time, season and CCP, while the biomass of Cyanobacteria and Bacillariophyceae were not associated with the input variables. The negative standardised beta coefficient of cyanobacterial biomass in the multivariate regression model for the biomass of O. stratum suggest a competition between the two taxa. This likely explains the restricted occurrence of O. stratum within a short section of the active LPS stream.
INTRODUCTION
Carbonate precipitation due to biomineralisation occurs in the sea, in inland waters and soils (Martinez et al. Citation2010). Pelagic marine microorganisms have the greatest impacts on carbonate sedimentation (Field Citation1998; Martinez et al. Citation2010) and marine animals and seaweeds contributed to mountain formation, such as the Dolomite Alps (Bosellini et al. Citation2003; Faupl Citation2003). Besides macrophytes and animals, biomineralisation in inland waters is caused by microbial mats, which control mainly the equilibrium between organic and inorganic carbon (Dupraz et al. Citation2009). A clear distinction between biogenic- and abiogenic-induced calcium carbonate precipitation (CCP) is not always obvious (Merz-Preiß & Riding Citation1999), especially if the deposition is linked to Cyanobacteria or microalgae such as the desmid Oocardium stratum Nägeli. Dupraz et al. (Citation2009) listed three different types of biomineralisation processes: biologically induced (Bazylinski Citation2003; Weiner Citation2003), biologically controlled, and biologically influenced mineralisation. Additionally, CaCO3 deposition, exclusively related to abiotic processes such as reduced solubility of CO2 due to heating and/or atmospheric degassing of CO2 from supersaturated groundwater, occurs in aquatic habitats.
In active limestone-precipitating springs (LPS; Cantonati et al. Citation2016) and adjacent headwaters, CaCO3 precipitates on any available surface, a condition which was termed by Sanders et al. (Citation2010) as spring-associated limestone (SAL). Meteogene calcium carbonate is formed due to degassing of supersaturated carbon dioxide originating from soil and root respiration, which was originally fixed from the atmosphere. According to Pentecost (Citation2005, Citation1991), the mean deposition rate of meteogene limestone is around 5 mm yr−1, and may increase to 9 mm yr−1 when eukaryotic algae are involved to a greater extent. CCP rates of 2.2 mm yr−1 for LPS streams with Cyanobacteria were observed by Merz-Preiß & Riding (Citation1999).
Oocardium stratum is found exclusively in active meteogene LPS with ambient water temperature, and growing on various surfaces encrusted with SAL. Cells resemble those of Cosmarium and Cosmocladium (width 15–20 µm, length 10–20 µm) and are located at the ends of gelatinous stalks encrusted with carbonate (Golubić & Marčenko Citation1958; Linhart & Schagerl Citation2015; Sanders & Rott Citation2009; Schagerl & Pröschold Citation2007; Wallner Citation1933, Citation1934). The stalk system consists of extracellular polymeric substances, and proved to be an ideal nucleation site for CCP (Pentecost Citation1985). ‘Oocardium tufa’ is even known from rock formations. Wallner (Citation1935) reported a deposition rate of 5 mm a−1 in thickness for Oocardium-associated limestone. Studies focusing on formation and lamination induced by O. stratum have been carried out by Sanders & Rott (Citation2009) and by Trobej et al. (Citation2017), who measured deposition rates in the presence of O. stratum between 1 and 10 mm yr−1. It still remains unclear if O. stratum shows influenced, controlled or induced biomineralisation (Pentecost Citation1991; Rott et al. Citation2010; Sanders & Rott Citation2009; Wallner Citation1934).
The few studies of this peculiar taxon focused mainly on SAL formation, and ecological demands of O. stratum were largely neglected. Sanders & Rott (Citation2009) suggested that seasonal changes in irradiance supply control the occurrence of O. stratum, resulting in SAL lamination. CCP was high during warmer periods (up to 5 mm), coinciding with intense growth of O. stratum, followed by a strong reduction caused by the massive development of benthic diatoms during autumn and winter, with only a few colonies of O. stratum persisting during the cold season. Linhart & Schagerl (Citation2015) identified hydrogen carbonate and water temperature as key variables for growth of O. stratum in a small LPS stream. In comparison with LPS, Trobej et al. (Citation2017) found O. stratum exclusively at higher CCP rates linked to soluble reactive phosphorus concentrations below 3 µg l−1.
The current study focused on the succession of photoautotrophic biofilms in an LPS stream. Specifically, we evaluated key parameters responsible for the development of O. stratum. Factors could be either biotic interactions, i.e. competition, grazing and/or environmental factors such as CCP, nutrients and/or specific physical conditions. We hypothesised that higher O. stratum growth during summer is caused mainly by increased incoming irradiance and warmer temperature. We also assumed that O. stratum was dominant during periods of increased CCP, which can be seen as a competitive benefit in such environments.
MATERIAL AND METHODS
Study site
We studied a small LPS stream discharging into the Mayrbach, which is located in the south-west faced slope of the Mayrgraben system in Lunz am See (47°15ʹ N, 15°04ʹ E; 714 m above sea level). The area is part of the limestone alps of Lower Austria (). Bedrock of the Mayrgraben system is a sandstone and shale formation of the Lunzer beds. The riparian vegetation consists of annual herbs, e.g. Fraxinus excelsior Linnaeus, Fagus sylvatica Linnaeus, Picea abies Karst, and Rubus subgen. rubus Linnaeus. Mean annual precipitation is about 1740 mm yr−1 and the mean annual air temperature is 7.4 °C. After a heavy storm event in 2007 (winter storm ‘Kyrill’, January 2007), most SAL layers were destroyed, leading to a collapse of the O. stratum population. This disturbance provided the opportunity to study the succession of the system including recolonisation of O. stratum. The three study sites were located along the LPS stream (), which can be characterized as a spring system of small diffuse helocrenes with the adjacent headwater (Vannote et al. Citation1980) of stream order 1 of the Strahler system (Strahler Citation1957). Site S was located next to the spring; here, SAL deposition starts. This site was also characterised by high incident irradiance. Site C was located about 25 m downstream in the centre of the LPS stream stretch; artificial shading was constructed at this site to mimic former canopy cover. Site M was located 10 m downstream towards the mouth of the LPS stream, where it discharges into the Mayrbach. This site is also characterised by high irradiance; it is located on an SAL cascade.
Fig. 1. Altitude profile of study site with locations of sampling sites S, C, and M. The spring of the Oocardium headwater is 714 m above sea level. After a few m aboveground, the headwater flows mostly underground. Inactive and cemented travertine indicates the former spring course. At an altitude of 703 m above sea level, the rivulet again flows aboveground and active precipitation starts. The Oocardium zone starts 65 m downstream of the spring and ends after 84 m.
Experimental set-up and data collection
The study took place between March 2008 and July 2009. We collected water samples in weekly intervals from March 2008 to November 2008, and from April 2009 to July 2009. Sampling was not possible in the winter season due to snow cover > 1 m. At each site, a set of environmental data was collected according to standard procedures (Linhart & Schagerl Citation2015; for an overview of methods see Table S1).
We installed sets of 25 frosted glass slides fixed in acrylic glass frames at each of the sites S, C and M. Frames were mounted on the limestone surface so that the slides were submerged in stream water. Slides were combusted before exposure (450 °C, 4 h) and then handled only with rubber gloves. Slides were exposed from 2 to 12 weeks to observe the initial state of carbonate precipitation, and to measure CCP rate, algal biomass and algal community composition. Slides were placed in situ on 15 July 2008, and the last retrieval was on 15 November. Slides were exposed again between 7 April and 30 June 2009. Every 2 weeks, five slides were randomly replaced, in order to collect carbonate and biomass samples.
For analysis, slides were carefully removed from the glass frames and transported in sterile 50-ml centrifuge tubes to the nearby laboratory. The cover was scraped with a scalpel and rinsed back into the tubes. In order to determine CCP rate, and levels of chlorophyll a (Chla) and accessory pigments, samples were homogenised (PT 1600 E disperser) and separated into subsamples. Subsamples were gently vacuum filtered on pre-combusted and pre-weighted glass fibre filters (Whatman GF/F, GE Healthcare, Chicago, Illinois, USA). One set of subsamples was subsequently oven-dried (90 °C, 24 h), weighed for dry mass (DM) and incinerated (450 °C, 4 h) to determine ash mass (AM) and to calculate particulate organic matter (POM = DM – AM). AM was treated as CCP. We analysed AM samples with X-ray diffraction (XRD) in order to determine mineral fractions of the precipitate.
Filters for pigment analysis were kept frozen at −80 °C until extraction, which took place in the Vienna laboratory. Filters were ground in 90% acetone and the extract stored in the dark for 8 h in a refrigerator (4 °C). After centrifugation (15 min, 1000 × g, 10 °C), the supernatant was analysed using high performance liquid chromatography (HPLC system Hitachi Elite LaChrom, Diode Array Detector Hitachi L-2455, column thermostat L-2300 with temperature of 35 °C, column Superspher RP–18, 100 LIChrocart, pre-column LIChrocart rP-18 end-capped, peak integration with EZChrom Elite Client Version 3.2) according to a modified protocol of Wright et al. (Citation1991). Peaks were quantified at 440 nm and identified by comparing retention times, absorption peaks and co-chromatography with authentic standards (DHI Bioproducts, Hørsholm, Denmark). In order to determine the percentages of O. stratum (the dominating streptophyte), Bacillariophyceae, and Cyanobacteria in samples, we first had to evaluate class-specific pigment ratios (Table S2). For O. stratum we used species-specific pigment ratios of clonal cultures, and for Bacillariophyceae and Cyanobacteria we took the average of class-specific pigment ratios from literature (Brotas & Plante-Cuny Citation2003; Mackey et al. Citation1997; Schagerl & Donabaum Citation2003; Schlüter et al. Citation2000). Both the pigment ratio matrix and the field-sample matrix were taken as input data to estimate algal class abundance relative to Chla as a surrogate for total algal biomass (see data analysis). Chla was also measured spectrophotometrically (see Talling & Driver Citation1963) and this served as a control for HPLC pigment analyses. Qualitative observations of the biofilm were performed with a confocal laser scanning microscope (Zeiss LSM710, Zeiss, Oberkochen, Germany) and a Zeiss Axio Imager.M1 compound microscope (camera: Axio Cam MRc5, computer application: Axio Vision Release 4.7.2).
Data analysis
Data analysis was done using R statistical software v3.5.1 (R Core Team Citation2018). Continuous variables were presented as medians with interquartile range (IQR) and categorical variables as percentages. Data were first tested for normal distribution using the Kolmogorov–Smirnov test. Non-normally distributed data such as environmental data, biomass (Chla ng mm−2), CCP (µg mm−2), and community composition were transformed with y = log10(x + 1) function (Burns & Walker Citation2000; Ramette Citation2007) to achieve normality.
Two-way ANOVA followed by a post hoc test (Tukey test) was used to compare environmental factors between the three sites and three seasons. Correction for multiple testing (post hoc tests and Welch correction) was applied where necessary. Community composition by means of HPLC data was performed with BCE, (Bayesian compositional estimator; Van Den Meersche et al. Citation2008). Descriptive statistics, correlation, regression analysis and graphical prediction analysis were performed with jtools, ggpubr, ggplot2 and apaTables.
For correlation, regression and prediction analysis, data were standardised to zero mean and unit variance. First, Pearson’s bivariate correlations were performed on transformed CCP and biomass data. Then, a multivariate generalised linear regression model (GLM) was performed to identify the impact of site-related factors, exposure time, season and CCP on biomass data of O. stratum, Bacillariophyceae and Cyanobacteria (GLM1). We used ‘site’ as an independent factor representing the downstream gradient in water chemistry while the factor ‘season’ characterised changes over the year of water temperature, radiation and sky openness. We additionally calculated a GLM2 with only O. stratum biomass as a dependent variable to consider impacts of both abiotic factors and biotic interactions with other photoautotrophs on O.stratum biomass. Model evaluation and test for over-dispersion were done by the analysis of deviance using the anova() function. Homoscedasticity of the models was confirmed using the Breusch–Pagan test (Breusch & Pagan Citation1979). Model evaluation and the final selection were based on comparisons of r2, adjusted r2, AIC and BIC (Zuur et al. Citation2009). We considered P < 0.05 as statistically significant. Biomass was predicted graphically over time with the function geom_smooth in the ggplot package, providing a LOESS function to model untransformed data of a polynomial surface through the local fitting.
RESULTS
Environmental parameters
Water temperature ranged from 3.6 °C to 16.1 °C with a mean (x̅) of 10.7 °C (standard deviation, s = 2.9). Sky openness ranged from 13.9% to 48.8% with a mean of 30.9% (s = 8.9); pH was slightly alkaline (8.1–8.4). Ca2+ was the dominant cation ranging from 54.1 to 92.7 mg l−1 with a mean of 79.8 (s = 6.1). K+ and Na+ were less than 1 mg l−1. Free carbon dioxide ranged from 0.8 to 4.8 mg l−1 with a mean of 2.2 mg l−1 (s = 9.4). HCO3− was the dominant anion with a mean of 4.4 mg l−1 (s = 0.3) followed by SO43− (x̅ =2.8 mg l−1, s = 0.3) and Cl – (0.3 to 0.9 mg l−1). Nutrient levels were generally low; soluble reactive phosphorus was below 3.6 µg l−1 with a mean of 0.7 µg l−1 (s = 0.8; Tables S3, S4).
Water chemistry (ions and nutrients), irradiance, water temperature and discharge differed significantly by season (Table S4, top). The factor site is reflected mainly through differences of variables involved in the carbonate equilibria. Downstream we found a significant decline of free carbon dioxide, HCO3− and conductivity (P < 0.001). Also, sky openness differed significantly among sites (P < 0.001), but incoming irradiance did not (P = 0.091). Moreover, a significant downstream gradient was obtained for N-NH4 (P = 0.023), but seasonal differences were higher than site-specific differences (Table S4, bottom).
CCP development
XRD showed the same mineral fractions for all AM samples: calcite (60%), aragonite (39%), and also low amounts of quartz (1%); crystal diameter was about 10 µm (). In both years, CCP was not detectable in the initial 2 weeks of exposure. The lowest CCP was detected at site S in spring (0.02 µg mm−2; ), the maximum was measured at site M in autumn (116.7 µg mm−2; ). At all sites CCP precipitation started slowly in spring, but increased exponentially at sites C and M until late summer. After reaching a maximum in late summer, CCP decreased at sites C and M in early autumn but showed a strong increase in late autumn. In contrast, CCP at site S increased slightly throughout the study period with no decline in early autumn (). CCP indicated significant differences within sites (F(2,132) = 37.68, P < 0.001) and seasons (F(2,132) = 99.93, P < 0.001). It was significantly lower at site S compared to sites C and M (post hoc Tukey test; P < 0.002), but CCP did not differ from the more downstream sites C and M (post hoc Tukey test; P < 0.915). CCP was significantly lower during spring than in summer and autumn at all three sites (post hoc Tukey test; P < 0.001).
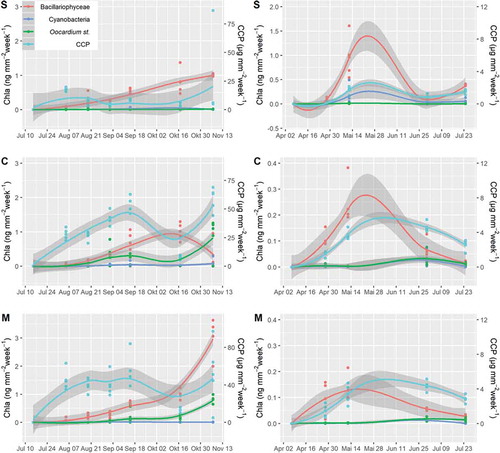
Fig. 2. Biofilm development on artificial substrata (frosted glass slides) along headwater for sites S (spring), C (centre) and M (stream mouth) from April to July 2009 (mean ± s).
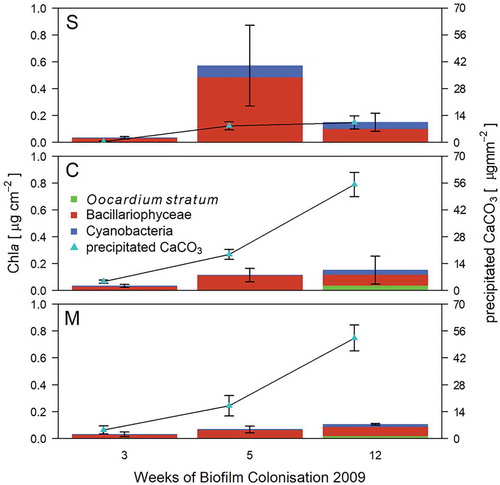
Fig. 3. Biofilm development on artificial substrata (frosted glass slides) along the headwater for sites S (spring), C (centre) and M (stream mouth) from July to November 2008 (12 weeks) (mean ± s).
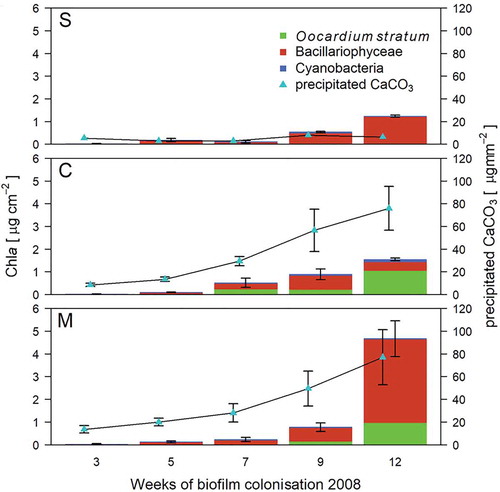
Furthermore, CCP displayed a strong and positive correlation with biomass of O. stratum (r(135)= 0.61, P < 0.001), whereas Bacillariophyceae were only weakly correlated with CCP (r(135) = 0.46, P < 0.001); cyanobacteria showed no zero-order correlation to CCP (r(135) = 0.12, P = 0.172, Table S5). CCP rates ranged from 0.01 µg mm−2 week−1 measured at site S in spring 2009 to 9.80 µg mm−2 week−1 at site C in summer 2008 (, ).
PHOTOAUTOTROPHIC BIOFILM SUCCESSION
Chla was not detectable in the first 3 weeks of exposure in summer and autumn 2008, nor in spring 2009. Chla ranged from 0.04 µg cm−2 (site C) in summer to 5.55 µg cm−2 (M) in autumn (, ). Diatoms were dominated by a brownish mucous-like coating of Encyonema minutum (Hilse) D.G.Mann. For Cyanobacteria, only small Synechococcus-like forms were observed, while filamentous taxa were absent (). Diatoms comprised the most abundant biofilm fraction, at 28%–98% of algal biomass (–). However, in late summer, O. stratum caught up, and towards late autumn even exceeded Bacillariophyceae (, –). On average, O. stratum contributed 11% of total Chla (range 0.1–92.8%). Cyanobacteria were never the most abundant photoautotrophs (x̅ = 4.3%, 0.1–33.0%).
Figs 4–8. Composite three-colour CLSM images of glass slides in summer at site S showing autofluorescence of photosynthetic microorganisms and polarised CCP under 405 nm. Abbreviations: Ooc, Oocardium stratum; Cyano, cyanobacteria; Bac, diatoms.
Fig. 4. Auto-fluorescence of initial diatoms (red) and CCP after 3 weeks (mean thickness of biofilm: 30 µm, range: 8–54 µm).
Fig. 5. First cell of O. stratum (red, larger cell surrounded by calcified EPS in blue) plus cyanobacterial colonies visible after 5 weeks.
Fig. 6. Same slide but other spot: development of a more solid carbonate layer (blue) and increase in diatom biomass after 5 weeks (mean thickness of biofilm: 60 µm, range: 15–150 µm).
Fig. 7. Single cells of O. stratum with calcified gelatinous stalk surrounded by diatoms after 7 weeks (mean thickness of biofilm: 90 µm, range: 20–230 µm).
Fig. 8. Colonies of O. stratum after 9 weeks beneath diatoms and cyanobacteria, which occurred at deeper levels of highly structured CCP architecture (mean thickness of biofilm: 150 µm, range: 60–300 µm. Scale bar: 50 µm).

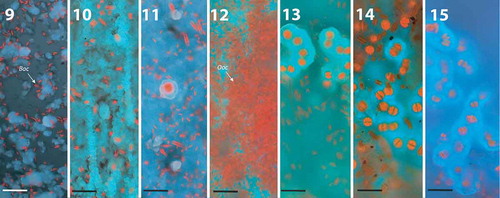
Figs 9–15. Composite three-colour CLSM images of glass slides from summer 2008 at site C showing autofluorescence of photosynthetic microorganisms and polarised CCP under 405 nm. Scale bar: 50 µm. Abbreviations: Ooc, Oocardium stratum; Bac, diatoms.
Fig. 9. Auto-florescence of initial diatoms (red) and CCP after 3 weeks (mean thickness of biofilm: 56 µm, range: 15–170 µm).
Figs 10–11. Development of a solid carbonate layer after 5 weeks (blue) shaped by stream flow. Single diatom (11) cells and (12) first single O. stratum cells with calcified EPS stalks on the top of the calcium carbonate layer (mean thickness of biofilm: 134 µm, range: 20–240 µm).
Fig. 12. Thick diatom mat developed after 7 weeks on solid CCP layer (mean thickness of biofilm: 190 µm, range: 70–400 µm).
Fig. 13. Colonies of O. stratum developed beneath first collapsing diatom mats after 7 weeks. Diatoms were observed also in deeper levels of the highly structured CCP architecture (mean thickness of biofilm: 280 µm, range: 110– 450 µm).
Figs 14–15. In November 2008, after 12 weeks, diatom mats collapsed, and colonies of O. stratum increased. Biomass of O. stratum exceeded the biomass of diatoms (mean thickness of biofilm: 580 µm, range: 200–2400 µm).
Early colonists were diatoms, followed by Cyanobacteria and finally O. stratum (–). Isolated cells of O. stratum were observed at C and M after 5 weeks; colonies formed after 7 weeks (–). Site S showed a delayed occurrence of O. stratum. Single cells were visible after 7 weeks followed by colony formation after 9 weeks (–). Growth of Oocardium occurred in two maxima during late summer and late autumn at sites C and M; S had only a small increase in biomass in autumn. Cyanobacteria reached a maximum in spring after 5 weeks at site S, while O. stratum peaked after 12 weeks at site C. Diatom biomass also reached its maximum after 12 weeks at site M.
Figs 16–19. Composite three-colour CLSM images of glass slides of the growth experiment in spring at site C showing autofluorescence of photosynthetic microorganisms and polarised CCP under 405 nm. Scale bar: 50 µm. Abbreviations: Ooc, Oocardium stratum; Cyano, cyanobacteria; Bac, diatoms.
Fig. 16. First diatoms (red) and first single calcium carbonate crystals (blue) are visible after 3 weeks (mean thickness of biofilm: 55 µm, range: 20–85 µm).
Fig. 17. Diatom mat developed after 5 weeks (mean thickness of biofilm: 70 µm, range: 15–150 µm).
Fig. 18. Diatom mats collapsed after 12 weeks, followed by rising of cyanobacterial colonies and formation of fine carbonate layer (blue).
Fig. 19. Same slide but other spot: The base of the biofilm consisted of a homogenous cyanobacterial mat. First single cells of O. stratum occurred on more homogenous CCP layer (mean thickness of biofilm: 155 µm, range: 15–210 µm).
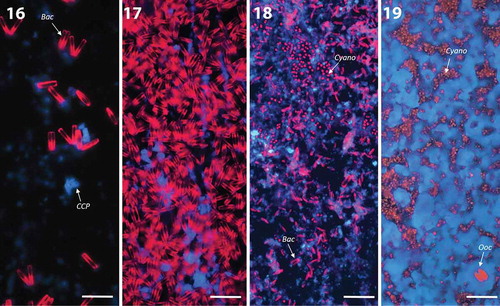
Fig. 20. Predicted biofilm development calculated separately for the sites S (spring), C (centre) and M (mouth) and years 2008 and 2009.
At site S, Cyanobacteria showed significantly higher biomass than O. stratum (F(2,132) = 13.01, P = 0.001). Biomass of O. stratum was lowest at site S and higher at C and M (F(2,132) = 13.01, S-C: P < 0.001, S-M: P < .034). Occurrence followed an unimodal distribution (, ) with maximum occurrence at site C; sites S and M did not differ in biomass of Oocardium (F(2,132) = 13.01, P < 0.401).
GLM1 revealed that the factors: site, exposure time, season and CCP, were significantly associated with biomass of O. stratum and explained 58% of its growth (r2 = 0.58, P < 0.001). A positive association was found with season and CCP, while the factors site and exposure time showed a significant negative association. Diatom biomass was positively associated with exposure time and CCP (R2 = 0.38, P < 0.001).
The multivariate model (GLM1) further showed that season and CCP were positively associated with Cyanobacteria biomass, while the factor site showed a negative association (r2 = 0.24; P < 0.001; Table S5).
GLM2, focusing on the biomass of O. stratum, confirmed the significant impact (P< .001) of site, exposure time, season and CCP. Furthermore, cyanobacteria biomass was significantly and negatively linked to O. stratum (P < 0.001, Table S6). The model explained 63% of O. stratum occurrence.
DISCUSSION
Biofilm development started with diatoms and an initial carbonate layer paired with Cyanobacteria, which was then replaced by O. stratum. Lamination of SAL developed through alteration of biofilm composition from thick diatom mats and calcified stalks of O. stratum. Community shifts were caused by seasonal changes. We assumed that CCP was mainly of abiotic origin, but it was also promoted by increased excretion of extracellular polymeric substances, because of the larger surface area.
This study revealed new and interesting patterns of photoautotrophic biofilm succession of the dominant groups Bacillariophyceae, Cyanobacteria and Streptophyta, the latter represented by only O. stratum. Chla amounts were comparable to Domozych & Domozych (Citation2008), who focused on freshwater biofilms comprising desmids grown on artificial substrate. High CCP and comparably low nutrient availability might explain the low periphyton cover than in other forest streams, which usually show a tenfold higher biomass (Roberts et al. Citation2004; Sabater et al. Citation1998). Discharges of around 6 l s−1 after snowmelt and after heavy rains, paired with water temperature below 10 °C until the end of May, likely caused a delay of biofilm development.
Proportions of green algae, diatoms and Cyanobacteria were comparable to former studies on epilithic biofilms in alpine regions, with diatoms being the dominant photosynthetic group followed by Cyanobacteria and green algae (Zancarini et al. Citation2017). We observed an initial colonisation by diatoms and cyanobacteria; O. stratum growth was delayed (–, –). We assume that extracellular polymeric substances excreted by pioneer microorganisms, i.e. beta proteobacteria and certain diatoms, have a fundamental function in biofilm succession, as this was shown in other stream systems (Battin et al. Citation2003; Besemer et al. Citation2007; Stolz Citation2000; Zancarini et al. Citation2017). These initial colonisers provide a matrix for subsequent organisms (Roeselers et al. Citation2007; Zancarini et al. Citation2017). Although cyanobacteria were only a minor fraction of the biofilm community, they probably play a pivotal role in initial colonisation of O. stratum (–). This process is reflected in the results of GLM2, which showed a significant negative association between Cyanobacteria and biomass of O. stratum (Table S6). Cyanobacterial, extracellular, polymeric substances provide a possible explanation. According to Dupraz et al. (Citation2009), cyanobacteria can influence initial CCP, especially at pH levels below 7, where negatively charged groups within the matrix of extracellular polymeric substances of picocyanobacterial origin, such as carboxylic acids and hydroxyl groups, bind large amounts of cations. As bound Ca2+ is removed from the running water, it leads to reduced precipitation (Dittrich & Sibler Citation2010; Dupraz et al. Citation2009; Zhu & Dittrich Citation2016). We likely observed this phenomenon (–, 19), especially at site S during spring, when pH was significantly lower than at sites C and M. We assume that primary CCP inhibition caused by Cyanobacteria and/or physical conditions (e.g. degassing of supersaturated carbon dioxide increased downstream) delayed colonisation of O. stratum (–, –).
After about 5 to 7 weeks, cyanobacteria were outcompeted by O. stratum. We observed characteristic green pinhead-like colonies after 2 months of exposure in summer. High occurrence of O. stratum in summer was also observed by Trobej et al. (Citation2017), who studied Austrian LPS streams. After settling, O. stratum takes the major role of ‘biofilm architect’ along a certain SPL stream stretch due to its high excretion of extracellular polymeric substances. This is a strategy to escape being buried in carbonate.
The occurrence of O. stratum was linked to the warmer season, site and CCP (highest at station C). The factor season represents mainly increased water temperature, light supply, nutrient availability, and decreased discharge. We assume that discharge is the background variable for both water temperature and nutrient availability, and is highly dependent on melting water during spring, and occasionally high current velocity after heavy rainfall. Main variables characterising the factor site are free carbon dioxide, and sky openness (both of which increased close to the spring, Tables S3, S4).
Biomass of O. stratum was much more sensitive to environmental conditions than were diatoms and cyanobacteria, which was studied by Trobej et al. (Citation2017). In our study, a similar pattern was observed for O. stratum indicating its very site-specific preferences along the LPS stream, which merges into the Mayerbach. Although the Mayerbach offers only slightly increased nutrient levels and lower CCP, Oocardium was not observed there (Linhart & Schagerl Citation2015). The taxon can persist only in small sections, where its growth habit provides a competitive advantage.
During periods of low discharge combined with high irradiance, diatom mats developed thick, brownish, mucous-like coatings. At site S, CCP precipitation might have been too low to result in a competitive advantage for O. stratum; thus cyanobacteria and heterotrophic bacteria dominated (). Our results indicated a spatial-temporal niche differentiation for O. stratum and cyanobacteria. While cyanobacteria were greater at site S and during spring, O. stratum developed best at site C during late summer and late autumn (). In contrast, diatoms were linked neither to spatial (site) nor to temporal (season) factors. Except for site M during late autumn, this group dominated the photoautotrophic biofilm (Table S5), which agrees with Zancarini et al. (Citation2017).
Colonies of O. stratum were macroscopic along a certain stretch downstream from where SAL precipitation started. This pattern was observed in former studies (Linhart & Schagerl Citation2015; Rott et al. Citation2010; Wallner Citation1934), but the reasons for this were unclear. Our survey suggests that very specific abiotic conditions are fundamental for the occurrence of this desmid. If these criteria are met, biotic interactions come into play. Consumers like ciliates, flagellates, nematodes and young instar insects are apparently not a critical factor, as we did not find feeding traces. We assume that calcification of colonies acts as protection against grazing.
Schagerl & Wukovits (Citation2014) revealed in a culture that O. stratum does not use HCO3−, but has very efficient carbon dioxide uptake. The cultures showed high production of extracellular polymeric substances and a patchy growth pattern in hemispherical colonies, but without carbonate precipitation. This points to mainly abiotic calcification in its natural environment. The stalks promote calcite nucleation in HCO3− and Ca2+ oversaturated waters, thus increasing CCP (see Merz-Preiß & Riding Citation1999; Pentecost Citation1985). High amounts of CCP requires O. stratum to develop stalks in order to prevent carbonate covering. Higher abiotic precipitation, therefore, leads to increased excretion of extracellular polymeric substances and vice versa. As a consequence, the biomass of O. stratum is very likely regulated by the amount of CCP.
Supplemental Material
Download Zip (72.2 KB)Acknowledgements
We thank Hubert Kraill for ion analysis; the Institute of Applied Geology (IAG) of the University of Natural resources and Life Science, Vienna, for mineral determination by X-ray diffractometry; and staff of the Wassercluster Lunz for hosting us, nutrient analyses and technical support.
Supplementary material
Supplemental data for this article can be accessed on the publisher's website.
Additional information
Funding
References
- Battin T., Kaplan L., Newbold J., Cheng X. & Hansen C. 2003. Effects of current velocity on the nascent architecture of stream microbial biofilms. Applied and Environmental Microbiology 69: 5443–5452. DOI: 10.1128/AEM.69.9.5443-5452.2003.
- Bazylinski D.A. 2003. Biologically controlled mineralisation in prokaryotes. Reviews in Mineralogy and Geochemistry 54: 217–247. DOI: 10.2113/0540217.
- Besemer K., Singer G., Limberger R., Chlup A.-K., Hochedlinger G., Hödl I., Baranyi C. & Battin T.J. 2007. Biophysical controls on community succession in stream biofilms. Applied and Environmental Microbiology 73: 4966–4974. DOI: 10.1128/AEM.00588-07.
- Bosellini A., Gianolla P. & Stefani M. 2003. Geology of the Dolomites. Episodes 26: 181–185.
- Breusch T.S. & Pagan A.R. 1979. A simple test for heteroscedasticity and random coefficient variation. Econometrica 47: 1287–1294. DOI: 10.2307/1911963.
- Brotas V. & Plante-Cuny M.R. 2003. The use of HPLC pigment analysis to study microphytobenthos communities. Acta Oecologica 24: 109–S115. DOI: 10.1016/S1146-609X(03)00013-4.
- Burns A. & Walker K. 2000. Effects of water level regulation on algal biofilms in the River Murray, South Australia. Regulated Rivers: Research and Management 16: 433–444. DOI: 10.1002/1099-1646(200009/10)16:5<433::AID-RRR595>3.0.CO;2-V.
- Cantonati M., Segadelli S., Ogata K., Tran H., Sanders D., Gerecke R., Rott E., Filippini M., Gargini A. & Celico F. 2016. A global review on ambient limestone-precipitating springs (LPS): hydrogeological setting, ecology, and conservation. Science of the Total Environment 568: 624–637. DOI: 10.1016/j.scitotenv.2016.02.105.
- Dittrich M. & Sibler S. 2010. Calcium carbonate precipitation by cyanobacterial polysaccharides. Geological Society, London, Special Publications 336: 51–63. DOI: 10.1144/SP336.4.
- Domozych D.S. & Domozych C.R. 2008. Desmids and biofilms of freshwater wetlands: development and microarchitecture. Microbial Ecology 55: 81–93. DOI: 10.1007/s00248-007-9253-y.
- Dupraz C., Reid R.P., Braissant O., Decho A.W., Norman R.S. & Visscher P.T. 2009. Processes of carbonate precipitation in modern microbial mats. Earth-Science Reviews 96: 141–162. DOI: 10.1016/j.earscirev.2008.10.005.
- Faupl P. 2003. Historische Geologie: eine Einführung, ed. 2. UTB, Stuttgart, Germany. 272 pp.
- Field C.B. 1998. Primary production of the biosphere: integrating terrestrial and oceanic components. Science 281: 237–240. DOI: 10.1126/science.281.5374.237.
- Golubić S. & Marčenko E. 1958. Zur Morphologie und Taxonomie der Desmidiaceengattung. Oocardium. Schweizerische Zeitschrift für Hydrologie 20: 177–185.
- Linhart C. & Schagerl M. 2015. Seasonal succession of the travertine-forming desmid Oocardium stratum. Journal of Phycology 51: 1055–1065. DOI: 10.1111/jpy.12345.
- Mackey M.D., Higgins H.W., Mackey D.J. & Wright S.W. 1997. CHEMTAX user’s manual: a program for estimating class abundances from chemical markers – application to HPLC measurements of phytoplankton pigments. Report 229. 41 pp.
- Martinez R.E., Gardés E., Pokrovsky O.S., Schott J. & Oelkers E.H. 2010. Do photosynthetic bacteria have a protective mechanism against carbonate precipitation at their surfaces? Geochimica et Cosmochimica Acta 74: 1329–1337. DOI: 10.1016/j.gca.2009.11.025.
- Merz-Preiß M. & Riding R. 1999. Cyanobacterial tufa calcification in two freshwater streams: ambient environment, chemical thresholds and biological processes. Sedimentary Geology 126: 103–124. DOI: 10.1016/S0037-0738(99)00035-4.
- Pentecost A. 1985. Association of cyanobacteria with tufa deposits: identity, enumeration, and nature of the sheath material revealed by histochemistry. Geomicrobiology Journal 4: 285–298. DOI: 10.1080/01490458509385936.
- Pentecost A. 1991. A new and interesting site for the calcite encrusted desmid Oocardium stratum Naeg. in the British Isles. British Phycological Journal 26: 297–302. DOI: 10.1080/00071619100650261.
- Pentecost A. 2005. Travertine. Germany, Springer, Berlin. 446 pp.
- R Core Team. 2018. R: a language and environment for statistical computing. R Foundation for Statistical Computing, Vienna.
- Ramette A. 2007. Multivariate analyses in microbial ecology. FEMS Microbiology Ecology 62: 142–160. DOI: 10.1111/j.1574-6941.2007.00375.x.
- Roberts S., Sabater S. & Beardall J. 2004. Benthic microalgal colonization in streams of differing riparian cover and light availability. Journal of Phycology 40: 1004–1012. DOI: 10.1111/j.1529-8817.2004.03333.x.
- Roeselers G., Van Loosdrecht M.C.M. & Muyzer G. 2007. Heterotrophic pioneers facilitate phototrophic biofilm development. Microbial Ecology 54: 578–585. DOI: 10.1007/s00248-007-9238-x.
- Rott E., Holzinger A., Gesierich D., Kofler W. & Sanders D. 2010. Cell morphology, ultrastructure, and calcification pattern of Oocardium stratum, a peculiar lotic desmid. Protoplasma 243: 39–50. DOI: 10.1007/s00709-009-0050-y.
- Sabater S., Gregory S.V. & Sedell J.R. 1998. Community dynamics and metabolism of benthic algae colonizing wood and rock substrata in a forest stream. Journal of Phycology 34: 561–567. DOI: 10.1046/j.1529-8817.1998.340561.x.
- Sanders D. & Rott E. 2009. Contrasting styles of calcification by the micro-alga Oocardium stratum Naegeli 1849 (Zygnematophyceae) in two limestone-precipitating spring creeks of the Alps. Austrian Journal of Earth Sciences 102: 34–49.
- Sanders D., Wertl W. & Rott E. 2010. Spring-associated limestones of the Eastern Alps: overview of facies, deposystems, minerals, and biota. Facies 57: 395–416. DOI: 10.1007/s10347-010-0252-y.
- Schagerl M. & Donabaum K. 2003. Patterns of major photosynthetic pigments in freshwater algae. 1. Cyanoprokaryota, Rhodophyta and Cryptophyta. Annales de Limnologie - International Journal of Limnology 39: 35–47. DOI: 10.1051/limn/2003003.
- Schagerl M. & Pröschold T. 2007. Rediscovery of Oocardium stratum Naeg. in Austria and its preliminary taxonomic position within the Desmidiales. In: Proceedings - Biology and Taxonomy of Green Algae V. Smolenice-Castle.
- Schagerl M. & Wukovits J. 2014. Cultivation and inorganic carbon uptake of the rare desmid Oocardium stratum (Conjugatophyceae). Phycologia 53: 320–328. DOI: 10.2216/13-228.1.
- Schlüter L., Møhlenberg F., Havskum H. & Larsen S. 2000. The use of phytoplankton pigments for identifying and quantifying phytoplankton groups in coastal areas: testing the influence of light and nutrients on pigment/chlorophyll a ratios. Marine Ecology Progress Series 192: 49–63. DOI: 10.3354/meps192049.
- Stolz J.F. 2000. Structure of microbial mats and biofilms. In: Microbial sediments (Ed. by R.E. Riding & S.M. Awramik), pp. 1–8. Springer, Berlin, Heidelberg, Germany. 331 pp.
- Strahler A.N. 1957. Quantitative analysis of watershed geomorphology. Eos, Transactions American Geophysical Union 38: 913–920. DOI: 10.1029/TR038i006p00913.
- Talling J.F. & Driver D. 1963. Some problems in the estimation of chlorophyll a in phytoplankton. In: Proceedings of the conference on primary productivity measurement, marine, freshwater. University of Hawaii, Honolulu, Atomic Energy Commission TID-7633, 142–146 pp.
- Trobej M., Bednar J., Waringer J. & Schagerl M. 2017. Algal communities of spring-associated limestone habitats. Aquatic Microbial Ecology 80: 61–75. DOI: 10.3354/ame01836.
- Van Den Meersche K., Soetaert K. & Middelburg J.J. 2008. A Bayesian compositional estimator for microbial taxonomy based on biomarkers. Limnology and Oceanography Methods 6: 190–199. DOI: 10.4319/lom.2008.6.190.
- Vannote R.L., Minshall G.W., Cummins K.W., Sedell J.R. & Cushing C.E. 1980. The river continuum concept. Canadian Journal of Fisheries and Aquatic Sciences 37: 130–137. DOI: 10.1139/f80-017.
- Wallner J. 1933. Oocardium stratum Naeg., eine wichtige tuffbildende Alge Südbayerns. Planta 20: 287–293. DOI: 10.1007/BF01909569.
- Wallner J. 1934. Über die Verbreitungsökologie der Desmidiacee Oocardium. Planta 23: 249–263. DOI: 10.1007/BF01925450.
- Wallner J. 1935. Eine gesteinsbildende Süßwasser-Alge Deutschlands. Natur und Volk 66: 85–91.
- Weiner S. 2003. An overview of biomineralization processes and the problem of the vital effect. Reviews in Mineralogy and Geochemistry 54: 1–29. DOI: 10.2113/0540001.
- Wright S.W., Jeffrey S.W., Mantoura R.F.C., Llewellyn C.A., Bjørnland T., Repeta D. & Welschmeyer N. 1991. Improved HPLC method for the analysis of chlorophylls and carotenoids from marine phytoplankton. Marine Ecology Progress Series 77: 183–196. DOI: 10.3354/meps077183.
- Zancarini A., Echenique-Subiabre I., Debroas D., Taïb N., Quiblier C. & Humbert J.F. 2017. Deciphering biodiversity and interactions between bacteria and microeukaryotes within epilithic biofilms from the Loue River, France. Scientific Reports 7: 4344. DOI: 10.1038/s41598-017-04016-w.
- Zhu T. & Dittrich M. 2016. Carbonate precipitation through microbial activities in natural environment, and their potential in biotechnology: a review. Frontiers in Bioengineering and Biotechnology 4: 4. DOI: 10.3389/fbioe.2016.00004.
- Zuur A.F., Ineo E.N., Walker N.J., Saveliev A.A. & Smith G.M. 2009. Mixed effects models and extensions in ecology with R. Springer, New York, United States. 574 pp.