
Abstract
It remains unknown how different types of sources affect the reconstruction of life courses and families in large-scale databases increasingly common in demographic research. Here, we compare family and life-course reconstructions for 495 individuals simultaneously present in two well-known Dutch data sets: LINKS, based on the Zeeland province’s full-population vital event registration data (passive registration), and the Historical Sample of the Netherlands (HSN), based on a national sample of birth certificates, with follow-up of individuals in population registers (active registration). We compare indicators of fertility, marriage, mortality, and occupational status, and conclude that reconstructions in the HSN and LINKS reflect each other well: LINKS provides more complete information on siblings and parents, whereas the HSN provides more complete life-course information. We conclude that life-course and family reconstructions based on linked passive registration of individuals constitute a reliable alternative to reconstructions based on active registration, if case selection is carefully considered.
Introduction
Demographic research is increasingly conducted using large-scale longitudinal data sets. Underlying these databases are sources such as population registers, parish registers, vital event registrations, censuses, and genealogical databases. Names, ages, birthplaces, and other personal characteristics in these sources are used to link life-course events, such as marriage or migration, to individuals (life-course reconstruction), and to link individuals to each other into family networks (family reconstruction). Together, life-course and family reconstructions form the basis of the practice known as family reconstitution, which is the process of reconstructing historical data on family membership and the events occurring to these family members during the course of their lives (Campbell Citation2015).
Characteristics of the underlying data sources may affect the completeness and quality of life-course and family reconstructions in databases (see e.g. Henry Citation1970; Ruggles Citation1999 (footnotes 12 and 21); Song and Campbell Citation2017). This is particularly the case for comparisons between: (1) databases derived from active registration where individuals are followed continuously over time, registering specific events as they happen; and (2) databases produced from passive registration where individuals are observed only when specific events, such as a birth or marriage, are registered and the separate documents linked together (Gill Citation1997; Alter et al. Citation2009; see for an overview of active and passive registration). Well-known examples of databases based on active registration include the Roteman Database for Stockholm in Sweden and the Scanian Economic Demographic Database (SEDD). Databases based on passive registration include the Utah Population Database, the English Family Reconstitutions, and Knodel’s German village family reconstitutions.
Table 1 Overview of data sources and position in the active/passive registration framework
Databases based on passive registration can more easily miss a vital event, such as the birth of a child. Migration movements are not registered, making it unclear whether, where, and when an individual experiences vital events in another region. In active registration, observations generally contain relatively complete information on individuals and their families, as households or individuals are followed actively during their lives. Out-migration is commonly observed, so when individuals leave the municipality or region of residence, they can easily be traced to their new place of residence. Thus, both differences in source material and strategies for following individuals across data sources are likely to be crucial for the quality of reconstructed lives and families in historical databases. The extent to which they result in differently reconstructed life courses and families remains unexplored in the literature, however, due to a lack of data enabling cross-checks of the same life courses and families using different sources, with the exception of Wisselgren et al. (Citation2014).
In this paper, we show a comparison of life-course and family reconstructions for the same individuals in demographic data sets derived from two different independent data sources: one based on the Dutch population registers, reflecting active registration, and one based on Dutch vital event registers, reflecting passive registration. Our purpose is twofold: (1) to investigate to what extent life-course and family reconstructions are represented similarly in databases based on active vs. passive registration; and (2) to determine the suitability of the two types of data for different research questions, including questions on lifespan and mortality, marriage behaviour, and fertility. The results are of interest to researchers working with individual-level longitudinal demographic data of either sort.
An overview of the literature
Earlier research focusing on the quality of individual-level, large-scale longitudinal demographic databases has used a variety of approaches that consider the characteristics of the source material and the logic of the construction of the database (Delger and Kok Citation1998; Gavrilov and Gavrilova Citation2001; Mandemakers, Citation2002; Kok et al. Citation2009). Other studies have used approaches based on internal consistency of databases and comparisons with external data sources, such as mortality statistics in life tables. Schellekens and Van Poppel (Citation2016) compared population register data with national statistics and reported that in the Historical Sample of the Netherlands (HSN), cohort life expectancy at age 30 may be overestimated for men, but not for women. Adams et al. (Citation2002) concluded that observations on migration in vital event registrations reflect migration information in population registers well.
One of the main drawbacks of data based on passive registration is that analysis is usually restricted to the residentially stable part of the population and excludes those without an age at out-migration or age at death, raising issues of representativeness (Gill Citation1997; Hacker Citation1997; Voland and Dunbar Citation1997; Alter et al. Citation2009). Importantly, Ruggles (Citation1992) observed that migration causes underestimation of population-level demographic indicators, such as age at marriage, age at first and last birth, and number of children. After migration, migrants are right-censored and their demographic events are no longer observed, causing an underestimation of the number of events as well as of the mean age at the corresponding events; this is all the more problematic when the date of migration is not recorded, meaning that only the last recorded observation can be used. If the last observation is not a death, a potential source of bias is introduced, because individuals are still at risk of experiencing events after their last observation in the population. Statistical inferences have been developed to estimate dates of last observation when censoring occurs (Gill Citation1997; Jonker and Van der Vaart Citation2001, Citation2007; Alter et al. Citation2009). However, there may be true differences between the migrating and non-migrating parts of the population (Kasakoff and Adams Citation1995; Hacker Citation1997).
While approaches based on external data sources are useful instruments for judging the quality of databases, they provide insight into deviations only at the aggregate level, for example differences in mortality rates. Whether individual life courses and families are reconstructed accurately remains an open question. Some efforts have been made in this direction, as linkage success and percentages of correct matches across sources—such as parish records and census material—have been used as an indicator of data quality (Thorvaldsen Citation2011; Wisselgren Citation2014; Van Dijk Citation2019). In addition, several studies have explored the success of linking strategies by comparing databases (see, for instance, Wisselgren et al. (Citation2014) for comparisons between Swedish censuses and parish registers, and Massey (Citation2017) for historical United States data). Ruggles et al. (Citation2018) have emphasized that most studies focus on missed links (type II errors), so false links (type I errors) are given too little attention. Both errors may introduce bias into life-course and family reconstructions. However, missed and false links affect not only whether individuals are included in demographic databases, but also whether the correct children, spouses, and parents are linked to them. By paying proper attention to false links, life-course transitions may be more accurately incorporated in databases. False matches and failed matches occur mostly in sources based on passive registration, where individuals are not continuously followed over time. However, direct comparisons with sources based on active registration may reveal areas where passive registration provides more complete data.
Data
In the Netherlands, a unique opportunity has opened up to compare individuals’ life-course and family reconstructions in two different types of data sets. For individuals born between 1863 and 1872 in Zeeland, demographic information can be found in two indexed civil administration systems. The first (LINKS) is based on the civil registry of Zeeland and contains linked civil certificates of births, marriages, and deaths (passive registration). The second (the HSN) is based on a sample of birth certificates and contains active registration of households originating from the nationwide population registers. Individuals born in Zeeland who were included in the HSN can be identified in LINKS through an identifying combination of the municipality, year, and sequence number provided on each civil certificate.
The civil registry and LINKS
The civil registry. The Dutch civil registry is one of the oldest in the world, and has covered the entire country since 1812. Birth, marriage, and death certificates were kept in separate books, made in duplicate, controlled by local judiciaries, and stored at separate locations (see Vulsma Citation1988). The Dutch civil registry of birth, marriages, and deaths is a good source for life-course and family reconstructions. All certificates contain the date of the event, the date of the registration (birth and death certificates), the place of registration, the name and age of the person reporting the event, and the names and places of residence of the witnesses. The birth certificates contain the name of the father, if known, as well as the name of the mother, and the name and sex of the child. The marriage certificates contain the age, occupation, civil status before marriage, and place of residence of the bride and groom, as well as the names of their parents, and—if the parents were alive—their age, place of residence, and occupation. For death certificates, one of the two informers (or one informer after 1935) reporting the death is often a spouse or parent; they report the name, occupation, age, and place of residence of the deceased person. The civil registers of births, marriages, and deaths become public after 100, 75, and 50 years, respectively (Burgerlijk Wetboek [Dutch civil code], article 1:17A).
The LINKing System for historical family reconstruction (LINKS)
LINKS is based on digitized certificates from the civil registries, as indexed by the WieWasWie project, to reconstruct families. The Zeeland 2017.01 release of the database contains around 700,000 birth certificates, 200,000 marriage certificates, and 650,000 death certificates. Multigenerational families were built by Mandemakers and Laan (Citation2017) using linked marriage certificates to reconstruct life courses and families (see ). Of the births detailed in LINKS, 81 per cent are linked to the marriage of their parents. In total, the data set contains almost 2 million persons covering a maximum of seven generations. Individual life-course reconstructions were obtained by linking civil birth, marriage, and death certificates: 68 per cent of all birth certificates and 66 per cent of all marriage certificates were linked to a subsequent death certificate (Van Dijk Citation2019). The scope of the database is large regarding intergenerational networks of family members (Van den Berg et al. Citation2019), but the successful reconstruction of life courses and families depends on the linkage of passively registered data sources. In addition, LINKS does not contain information on addresses, co-residence of individuals, migration movements, or religion.
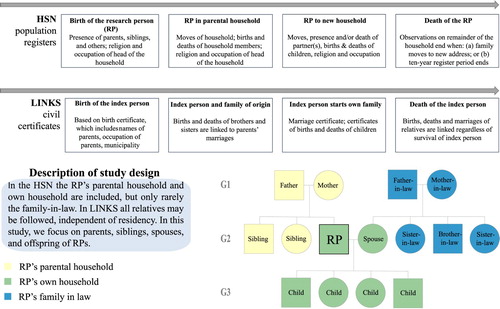
Figure 1 Data structure of the HSN and LINKS
Notes: Both LINKS and the HSN can be used for life-course and family reconstruction. The top row shows the information used for life-course reconstruction in the HSN in chronological order, while the second row shows the information used for family reconstruction in LINKS, also in chronological order. The family reconstruction shows an example of the available family members in LINKS and the HSN. The boxes showing ‘RP’s own household’ represent the selection for the paper, which resembles the family structure that can be derived from the HSN.
Indexes of civil birth, marriage, and death certificates were linked together using combinations of at least two pairs of names of individuals, spouses, and parents, combined with time constraints based on age (Mandemakers and Laan Citation2017). Variations in the spelling of names, name changes, and the non-uniqueness of many names renders family reconstruction a complicated task. To prevent missed matches due to spelling variations, all first and last names were corrected for minor known variations in spelling. All name combinations for at least two persons—the individual and one or two of their parents, and possibly a spouse or child—were matched. In the data release used here, certificates were linked only within the province of Zeeland, so certificates of individuals who out-migrated from Zeeland to another province in the Netherlands or abroad were missed. This concerns a sizable part of the population, for example, those who migrated to Rotterdam and Belgium (Priester Citation1998).
Population registers and the HSN
Population registers. Population registers were introduced in the Netherlands in 1850. The population registers were maintained by each municipality, in large books organized by street or neighbourhood. This makes it possible to follow households, and the persons in them, over time. For each household, the registers contain information on the address, household composition, and each individual’s family name, given names, sex, marital status, birth date, death date, birthplace, profession, and religious denomination. For married couples, the head of the household is the male spouse. After his death, his widow would become the head of the household until her death or remarriage, or until she moved into a household with an existing male head (Knotter and Meijer Citation1995; Stadsarchief Amsterdam Citation2018). Relationships between the members of the household are included from the perspective of the head of the household, allowing the reconstruction of relationships between other household members. Movements into and out of the household were actively tracked, as were births and deaths. The books containing the population registers were replaced every ten years and updated with a coinciding nationwide census. This active registration allows the follow-up of households for longer periods of time.
In the period of research of this paper, two important changes in the population registries were implemented. In 1920—and earlier in the large cities—population registration was no longer ordered by street or neighbourhood, but by individual household, in a card system with separate documents. From 1939 onwards, the registration was no longer focused on households, but on individuals, by means of personal cards. Later, in 1994, this personal card system was completely digitized. Nowadays, the system is known as the Personal Records Database (Basisregistratie Personen, or BRP, in Dutch) and is maintained at the national level. One year after a person’s death, a summary of personal and family information becomes available for scientific and genealogical research (CBG Citation2019), and for specific research purposes a request can be made to the Dutch government to access the BRP directly.
The Historical Sample of the Netherlands (HSN)
The HSN enables research on the detailed life courses of a representative group of individuals in the Netherlands in the nineteenth century (Mandemakers Citation2000, Citation2002). The HSN is based on a sample of birth certificates of all individuals living in the Netherlands, stratified by ten-year cohorts for the period between 1811 and 1922 and according to regional levels of population density. The sample consists of 0.75 per cent of the births for the period 1812–72 and 0.5 per cent of the births for the period 1873–1922. In total, the sample consists of about 85,500 individuals (IISG Citation2018). Up to now, about 40,000 of these 85,500 persons have been followed in the population registers throughout their life course. In the HSN these persons are referred to as ‘Research Persons’ (RPs). The population register information in the HSN is supplemented with information from the Dutch birth and marriage certificates.
In the 2010.01 HSN release, entries in population registers and on personal cards were made available for 37,137 RPs (Mandemakers Citation2002). For some regions, including Zeeland, the HSN had already started in 1850, when the population registers were introduced. The database includes information about the RP’s household, including co-residents and the occupation and religion of household members. Households were, in principle, only followed as long as the RP was present in that household. Siblings and other kin were eventually lost from observation when the RP moved out of the household or died, after a follow-up to the end of the ten-year population register period. For the period after the implementation of family cards for individual households, the remaining family members were followed for up to 40–50 years.
Structural differences between the HSN and LINKS
Because of the sampling procedure and independent sources of information, structural differences exist between the databases in terms of the life-course and family reconstructions (see and ). In the HSN, sibling and parent information is only available to the extent to which family members cohabited with RPs. Therefore, questions with topics such as intergenerational and horizontal kin relationships—for instance, sibling similarities in mortality—cannot be answered. Second, in LINKS individuals were observed only when vital events occurred to them, their spouses, or their children. Consequently, the HSN is primarily focused on life-course reconstruction and less on family reconstruction, whereas the opposite applies to LINKS, in the sense that observations on life events are used to trace family members. We will explore to what extent events of fertility, marriage, migration, mortality, and occupational careers were observed and differ between the HSN and LINKS.
Table 2 Expected availability of demographic indicators in the HSN and LINKS
First, in contrast to the HSN, LINKS does not encompass unmarried cohabitation or extramarital children, which may lead to an underestimation of the number of children or siblings. Second, the lack of continuous follow-up of individuals in the civil registry makes it necessary to link certificates. The automatic record linking procedure might occasionally miss matches between vital event certificates. Moreover, certificates were linked only within the geographic area of a province, so persons were lost if they migrated to another province or country. Thus, mortality in early life is most likely measured quite accurately, but certificates of deaths and marriages occurring later in life are more likely to be unavailable. Finally, key indicators, such as occupation and place of residence, were observed only in concordance with vital events of individuals, their spouses, or their children. Death certificates contain occupational information only if the deceased person had an occupation at the time of death. However, migration patterns and occupational careers can be reconstructed from an individual’s civil certificates, as well as from their children’s civil certificates. Hence, more observations on occupation and place of residence are available for RPs who married or had children. Moreover, most of these vital events occur relatively early in life, so later changes in place of residence and occupation can easily be missed. For unmarried individuals, only vital events in the family of origin and their death certificate will be observed.
In the HSN, there were no systematic observations of events before the sampled RP was followed. Observations on RPs do not always start at birth, leading to gaps in life-course and family reconstructions. The implication is that siblings who reside elsewhere or died young may not be included in the register in which the RP first appears. As a result, the count of all known siblings reflects the count of surviving siblings (net fertility) rather than the count of all siblings ever born (total fertility). At the same time, RPs’ children were identified very accurately in the HSN because RPs were, in principle, followed for their entire life course. This is illustrated by Janssens (Citation1993), who showed for Tilburg (1849–99) that 99.8 per cent of the children found in the birth registers were identified in the population registers. At the same time, stillbirths and children who died very soon after birth (hereinafter, ‘lifeless reported infants’) were not usually included in the birth or population registers, but only in the death registers. These characteristics limit opportunities for research on events early in the life course—such as exposure to sibling mortality or the length of birth intervals—and research on intergenerational relationships in longevity, mortality, and fertility.
Data construction and approach
For the comparison between the HSN and LINKS, we used persons identified in both databases who were born between 1863 and 1872. Earlier and later cohorts were disregarded because population registers were of limited quality until 1860 and birth certificates relating to events after 1915 are not yet included in LINKS.
Drawing on data from LINKS 2017.01 (Mandemakers and Laan Citation2017) and the HSN 2010.01 release (HSN Citation2010a, Citation2010b), we traced the 495 Zeeland-born individuals included in the HSN in LINKS via the unique identifiers on the birth certificates. We analysed differences in life-course and family reconstructions of these RPs in the estimation of key demographic and socio-economic indicators, and we tested whether the characteristics of the databases might have led to an underestimation in the number of links. Demographic linking strategies tend to go for precision (few false matches) at the expense of recall (few missed matches) (Fu et al. Citation2014; Wisselgren et al. Citation2014). Moreover, biases in the registration procedure lead to omissions in the data. Therefore, differences in observations between the HSN and LINKS are most likely indicative of false negatives, that is, missed observations.
An overview of available information in both data sets and expected completeness is provided in . For our analyses, we used the following indicators: sex, start and end dates of observation (HSN) or first and last observation (LINKS), birth year, and death year. We counted the number of siblings and children known, and the birth order of the RP in their family of origin. With regard to the number of siblings and children, stillbirths and infants reported lifeless at civil registration were excluded, as they were unavailable in the HSN. In addition, we measured ages at first and last childbirth for men and women. Furthermore, we noted whether RPs married or not and had children or not; calculated their ages at first marriage and at death; traced whether they migrated within Zeeland, outside Zeeland (HSN), or never; and tested their socio-economic position for consistency between the two data sets using HISCLASS, a social class scheme to classify historical professions (Van Leeuwen and Maas Citation2011; Mandemakers et al. Citation2018).
Results
presents the number of RPs for whom parents, siblings, spouses, and children could be identified. Because entire households of individuals are actively registered in the source material underlying the HSN and observations are available for the entire country, information on parents, spouses, and children is more often available in the HSN than in LINKS, which is based on linked civil certificates from Zeeland only. In the HSN, 96 per cent of the RPs had available parent information, for a total of 932 parents. In LINKS, parent information was available for 82 per cent of RPs (814 parents). In the ||HSN 1,060 children were identified (for 40 per cent of the RPs), whereas in LINKS 810 children were identified (for 31 per cent of the RPs). However, fewer siblings were known in the HSN than in ||LINKS (1,447 and 2,804 siblings, for 72 and 83 per cent of RPs, respectively), as these were observed only if they lived together with the RP in a household. A smaller proportion of the spouses was known in the HSN than in LINKS, because marriages were registered in the civil records in the first place, and may not always have been registered correctly in the population registers. A total of 233 spouses were found in the HSN (28 per cent of the RPs), while 188 spouses were identified in LINKS (36 per cent of the RPs). Hence, active registration increases the number of RPs with known family relatives, but may be related to missed events that occurred outside an RP’s household or in other registers. This difference between events within and outside the household does not exist for passively registered sources. For both data sets, the number of individuals without spouses and children appears to be high. However, many individuals in Zeeland did not reach reproductive age, as infant and child mortality in Zeeland was very high, reaching up to 50 per cent in some municipalities and years (Van Poppel et al. Citation2005; Van Dijk and Mandemakers Citation2018).
Table 3 Family members available in the HSN and LINKS for the selected 495 RPs from the 1863–72 Zeeland cohort
Comparisons between the databases were conducted in two ways. First, we compared all individuals for whom relevant observations could be expected in both databases separately, with the purpose of exploring all life-course and family reconstructions (, panel (a)). Because the mean scores in this table are based on different RPs, these means must be interpreted for each data set separately. Second, we analysed only the subsets for which we could reconstruct life courses in an identical way, hence, we selected individuals for whom a relevant observation would be expected in both databases (, panel (b)). Both tables show key demographic information for all RPs with available information on whether they experienced the demographic event. Cases without information on the relevant selection criteria were not included. Differences between the HSN and LINKS in demographic indicators in panel (b) indicate differences in the reconstructions of life courses and families between the HSN and LINKS, whereas differences in these indicators in panel (a) may also be caused by differences between the subsets of individuals for whom information is available.
Table 4 Number of available cases and means/proportions for demographic indicators after selection of best cases in the HSN and LINKS (a) separately and (b) simultaneously
Comparisons of demographic indicators in the HSN and LINKS
Table 4, panel (a), shows that the mean number of siblings and birth order were lower in the HSN (3.9 and 1.8) than in LINKS (6.7 and 4.2). These results were similar for the 186 identical cases. These differences are mainly a consequence of the research design of the HSN, in which siblings are only observed if they are part of the RP’s household. Therefore, information on siblings who died young or who did not live in the household is often missing, leading to an underestimation of sibship size in the parental household of the RP.
Within the population register release of the HSN, information on marriages was available for 55.2 per cent of the RPs aged 30+, whereas in LINKS, this was available for 84.9 per cent of the selected RPs. , panel (b), shows that for the 138 ‘common’ RPs (present in both data sets), marital information was available for 44.9 per cent in the HSN and 85.5 per cent in LINKS, which indicates that marriages were often not included in the population registers. For all ever-married persons, the mean ages at marriage in the HSN and LINKS were 28.4 and 26.3, respectively. The higher mean age at marriage in the HSN is partly caused by right-censored observations in LINKS. Out-migration is known to cause underestimation of the number of events as well as the age at which demographic events occur (Ruggles Citation1992). Nevertheless, the number of known marriages was higher in LINKS than the HSN after we selected only individuals who married in Zeeland, that is, marriages which were available in LINKS. In the HSN the age at first marriage in panel (b) was lower than in panel (a), at 27.7 years. The mean age at first marriage in LINKS was, at 26.8 years, higher than in the LINKS-only selection, as shown in panel (a). The higher age at first marriage in the HSN (panel (b)) may be related to left truncation in the HSN, as not all RPs were followed for their entire life course, so some second marriages were counted as first marriages, resulting in overestimation of the mean age at first marriage. After combining the HSN population registers with the marriage certificates, we observed that marriages were available for 87.0 per cent of the RPs with a mean age at first marriage of 27.7 years (see notes to ). There is no evidence that passive registration leads to biased estimates. Differences between the data sets originate from registration procedures and censoring due to migration.
, panel (a), shows that the mean number of identified children in the families of the RPs was similar in both data sets: 5.4 children for RPs in the HSN and 5.2 in LINKS. However, the number of RPs with identified children was higher in the HSN (N = 196) than in LINKS (N = 152) than in the HSN. Furthermore, the mean ages at first and last birth in the HSN (27.0 and 37.4 years) were higher than in LINKS (26.5 and 36.6 years). The percentage of married couples without identified children was 9.5 per cent in the HSN and 14.6 per cent in LINKS. These differences are probably caused by observations right-censored in LINKS due to out-migration. Panel (b) shows that for the 146 RPs included in both data sets, the mean age at first childbirth was 26.8 in the HSN and 26.6 in LINKS. This selection of common cases also shows the same mean number of children (5.4), although the mean age at last birth was higher in the HSN than in LINKS and the percentage of married couples without identified children was 12.9 per cent in the HSN and 15.5 per cent in LINKS. Apparently, the automatic linking procedure failed to pick up specific certificates. Later-born children and entire families might be missing, as differences in mean age at last birth and mean number of children remain after selecting identical RPs.
The HSN and LINKS also include different information on migration behaviour, as out-migration from Zeeland was not observed in LINKS. , panel (a), shows that, according to the HSN, 95 (40.3 per cent) of the RPs who were alive at age 18 migrated out of the province at some point in their lives. The HSN indicates that 140 RPs (59.6 per cent) never lived outside Zeeland, comprising 62 (26.3 per cent) who never moved at all, and 78 (33.1 per cent) who only moved within Zeeland. In LINKS, 157 death certificates are available for the RPs who lived at least until age 18, suggesting that these RPs either never left Zeeland or returned to Zeeland at a later age. Vital events outside the place of birth of the RP, indicating migration between municipalities within Zeeland, were identified for 67 RPs in LINKS. This pattern was similar when we compared identical individuals (panel (b)). According to the HSN, 56 RPs (37.6 per cent) remained in their municipality of birth, 71 (47.7 per cent) moved within Zeeland, and 21 (14.1 per cent) lived outside Zeeland at some point in their lives. In LINKS, we can see that 63 RPs (42.3 per cent) who were observed after age 18, died in another municipality than their municipality of birth, whereas both vital events occurred in the municipality of birth for 86 RPs (57.7 per cent). As about one in seven adults who were born and died in Zeeland lived outside Zeeland at some time, assumptions about interprovincial migration behaviour or the lack thereof should not be based on the presence of a death certificate in LINKS alone. The passive registration of individuals in the source material of LINKS means that migration movements can easily be missed.
The bottom rows in , panel (a), present the number and mean age of death for all RPs for whom an age at death was known and also the mean ages at death for individuals reaching at least 18 and 50 years. Because persons out-migrating from Zeeland are known in the HSN but not in LINKS, we expected that more ages at death would be known in the HSN and that the mean age at death would be higher. Indeed, fewer ages at death were known for RPs in LINKS than in the HSN, resulting in a higher mean age at death in the HSN (40.8 years) than in LINKS (34.7 years). The difference between the databases in the mean ages at death was smaller at higher ages. For those surviving until age 18, the mean age at death was 69.4 in the HSN and 67.4 in LINKS; after survival to age 50, the mean ages at death were 75.1 and 73.6, respectively. An important reason for the declining difference with age is the falling likelihood with age that individuals will out-migrate (Kok Citation1997). Differences between the HSN and LINKS were mitigated after identical cases were selected, which supports our assumption that selective availability of information for out-migrated individuals plays an important role. Hence, passive registration itself does not seem to cause biases in mortality estimates.
Comparing life-course and family reconstructions for RPs between the HSN and LINKS
Here, we take a closer look at deviations in individual life-course and family reconstructions. shows whether estimations of outcomes in the HSN are higher, lower, or identical to those in LINKS. Because information may be more complete for some subsets of individuals, four groups are included: (a) all individuals, that is no subgroups selected; (b) those with known marriage certificates for parents (when comparing siblings) or known death certificates for RPs (when comparing children); (c) those with known migration inside Zeeland only; and (d) those with known migration outside Zeeland. Different estimations are seen as indicative of missed observations, as the chance of producing false positives is low in the matching procedures in both data sets.
Figure 2 Matching of number of siblings and children in the HSN and LINKS
Notes: The figure shows the matching of numbers of siblings and children of RPs in the HSN and LINKS. Colours indicate whether the number of siblings or children of RPs were higher, equal, or lower in the HSN than LINKS. The bar in the middle indicates that an equal number of siblings or children was found in both datasets, bars on the left side show that more siblings or children were identified in the HSN than in LINKS, whereas bars on the right side illustrate that more siblings or children were identified in LINKS than in the HSN. The y-axis shows the percentage of matches corresponding to the x-axis. Number of RPs (N) per panel: (a) = 495, (b) = 407, (c) = 372, (d) = 123, (e) = 203, (f) = 116, (g) = 123, (h) = 80. Source: Authors’ analysis of HSN and LINKS data.
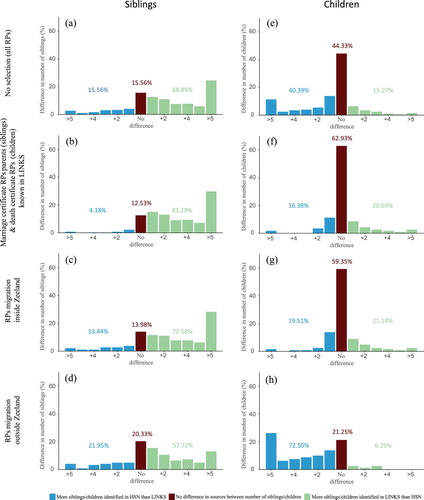
The HSN misses siblings that were not living in the RP’s household. Without any selections on the data (panel (a)), the number of siblings was higher for 69 per cent of the RPs in LINKS, whereas 16 per cent of the RPs in the HSN contained more siblings. However, LINKS also contains missed observations. The differences between the number of siblings in the HSN and LINKS were even more pronounced if a marriage certificate of the parents was known in LINKS (panel (b)). Family reconstructions in LINKS are better when a marriage certificate of the parents is available, as the marriage certificate could imply that the parents spent a larger part of their lives in Zeeland, leading to the identification of more siblings. In LINKS, fewer siblings were found in 4 per cent of cases compared with the HSN, the same number of siblings was found in 13 per cent of cases, and more siblings were found in 83 per cent of cases. Migration within Zeeland did not affect these results substantially (panel (c)), whereas for RPs who migrated out of Zeeland, the pattern was different: the number of siblings in LINKS was lower than in the HSN in 22 per cent of cases, identical in 20 per cent of cases, and higher in the remaining 58 per cent (panel (d)). The availability of a parental marriage certificate is an independent observation that hints at successful matches between parents and their children. In general, reconstructions of sibships can be considered complete if an independent observation like this is available.
Similarity between the data sets in number of children of RPs is greater than for number of siblings. Panels (e)–(h) in show the difference between the HSN and LINKS in number of children, which was calculated for RPs who had children identified in either or both data sets. The active registration in the HSN source data initially returned better results than the passive registration in LINKS. With no selections on the data, the HSN provided the most accurate results (panel (e)). For 40 per cent of all RPs more children were found in the HSN than in LINKS, for 44 per cent of all RPs the same number of children was found in both data sets, and in the remaining 15 per cent, more children were found in LINKS than in the HSN. These differences between family size in the HSN and LINKS may have been caused by interprovincial migration, as births outside Zeeland are not included in LINKS. To indicate the quality of the linking process, RPs who were known to have married, had children, and died in Zeeland were selected. The availability of a Zeeland death certificate for the RP and at least one Zeeland certificate for their children indicates that the RP has spent a large part of their life in the province, thus reducing the chance that the RP migrated out of Zeeland to a minimum. These cases were contrasted with individuals who, according to the HSN, always lived in Zeeland. For RPs with a Zeeland death certificate and those who migrated within Zeeland, the same number of children was found in the HSN and LINKS in 63 per cent and 59 per cent of cases respectively (panels (f) and (g)). Where the number differed between the HSN and LINKS, there was no clear distinction in performance between the databases: the HSN performed better in some cases, whereas LINKS performed better in the others. If RPs moved out of Zeeland, a larger number of children was found in the HSN for 73 per cent of RPs, the same result was found in both sets in 21 per cent of cases, and a smaller number in the other 6 per cent. Hence, the differences in family size between the HSN and LINKS are caused by migration rather than quality of linking. Thus, the availability of a death certificate in LINKS indicates that observations on childbirth are likely available as well. This shows that passive registration can approach the quality of active registration when a later observation is available, for example a death certificate.
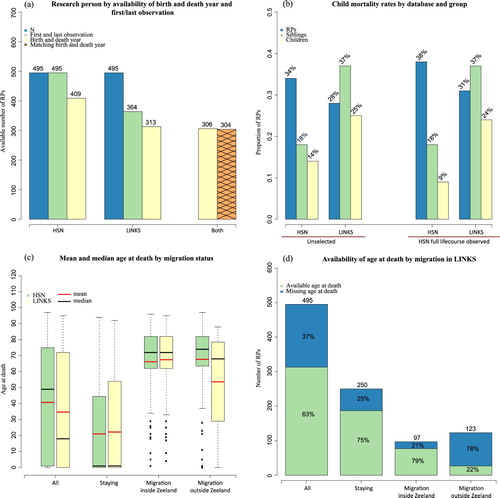
shows four comparisons between the available mortality information in the two data sets. The HSN returns more observations than LINKS, whereas the quality of matches is highly similar in both data sets. Panel (a) shows that the year of death was known for 409 RPs (83 per cent) in the HSN but for only 313 RPs in LINKS (63 per cent). The year of death overlapped in 304 cases (99 per cent) for whom a death certificate was available in both databases. Panel (b) presents childhood mortality for the RPs, their siblings, and their children. In the HSN, childhood mortality for RPs was estimated to be 6–7% per cent higher than in LINKS, reflecting the good coverage of RP information in the HSN. However, observations on sibling and offspring mortality are of lower quality in the HSN. Childhood mortality was estimated to be twice as high for siblings and children in LINKS compared with the HSN. When selecting RPs with full life course observations, differences between the HSN and LINKS were similar for siblings and more pronounced for children. Panel (c) shows that adult mortality estimates were influenced by migration outside Zeeland. Among individuals who stayed in their municipality of birth or who moved within Zeeland, both the mean and median ages at death were similar in the two data sets. However, death certificates were not linked for 25 per cent of the individuals who were marked as stayers or 21 per cent of the individuals who were identified as internal migrants in the HSN. Some of these individuals might have survived the observation period, as death certificates are not available after 1962. For other cases the death certificates could not be linked due to spelling and age variations on the death certificates. There is also evidence of a ‘salmon bias’ effect, which refers to the idea that a relative health advantage of migrants compared with the native population—the healthy migrant effect—may at least partially be caused by the return of unhealthy migrants to their place of origin. For RPs who left Zeeland according to the HSN, the mean and median age at death was lower in LINKS than in the HSN. The date of death was known for only 22 per cent of RPs recorded by the HSN as living outside Zeeland at some point in their life (panel (d)). Age at death for these return migrants in LINKS was significantly lower than for interprovincial migrants who died outside Zeeland. Thus, passive registration returns fewer observations, but we find no proof for systematic biases related to the linking process. In addition, LINKS contains a selective group of stayers and return migrants, of which especially the latter may affect population estimates.
Figure 3 Comparisons of mortality data in the HSN and LINKS
Notes: Panel (a) shows RPs by year of birth and death in absolute numbers. A birth and death year might be missing because either population records were lost (HSN only), or individuals were born before the observation period (HSN only), survived the observation period, or migrated out of Zeeland (LINKS only). Panel (b) shows the percentage of childhood (under-five) mortality by database (HSN and LINKS) and group (unselected (all cases) and full life course). Full life course indicates that HSN RPs are observed from birth. Panel (c) shows the mean and median age at death by migration status (staying, migration inside Zeeland, and migration outside Zeeland) and database (HSN and LINKS). Panel (d) shows the availability of age at death by migration status only for the LINKS database in absolute numbers and percentages. Migration status of RPs is determined based on the HSN since migration in LINKS is not available by definition. Source: As for .
shows the differences in socio-economic position between the HSN and LINKS based on the HISCLASS scheme (Van Leeuwen and Maas Citation2011). We present social class on the abbreviated HISCLASS-5 scale with five categories: (1) elite; (2) lower middle class; (3) skilled workers; (4) farmers and fishermen (referred to as ‘farmers’ from now on); and (5) unskilled workers (Kok and Mandemakers Citation2009). , panel (a), further shows whether RPs in the HSN with an available HISCLASS-5 score had no score, the same score, or a different score in the LINKS data set. In general, the active registration in the HSN returns more cases than passive registration in LINKS. Panel (a) shows that in total 73 RPs—33 women and 40 men—had known socio-economic information in the HSN but not in LINKS. The share of missing values in LINKS varied between 38 and 45 per cent for unskilled workers, skilled workers, and the lower middle class; the share missing was slightly higher for the elite, at 56 per cent, and was only 14 per cent among the farmers. Panel (b) shows that HISCLASS scores were identical for 80 per cent of the RPs with known occupational information in both data sets. All farmers in the HSN were also identified as farmers in LINKS. However, differences in social position were found for 22 per cent of the other RPs. Most discrepancies with the HSN occurred for the elite (43 per cent), more than for the lower middle class (24 per cent) and skilled workers (29 per cent). Fewer differences with the HSN were found for the unskilled workers (16 per cent). Underestimation of socio-economic status generally occurs when information on occupational status is unknown after marriage (Delger and Kok Citation1998). These problems with censoring are probably caused by migration, rather than by passive registration in the source. Geographic mobility is known to be higher for individuals with a better socio-economic position (Ekamper et al. Citation2011), so observations of those who reach a higher social position in society are more likely to be censored. Therefore, local data sets will underestimate the social position of migrants, as less occupational information is available at higher ages, and are biased towards stayers who, on average, reach a lower social standing.
Figure 4 HISCLASS scores for RPs in the HSN and LINKS
Notes: shows the 192 RPs (131 males, 61 females) with available occupational information in the HSN. Information on 32 RPs (7 males, 25 females) who are available in LINKS but not in the HSN are excluded from the analyses. Panel (a) shows the proportion of RPs according to whether available socio-economic status in the HSN is equal, different, or missing for the same RPs in LINKS (no data selection). Panel (b) shows the same information but without the 73 RPs missing in LINKS. Panels (c) and (d) show the proportion of RPs according to whether available socio-economic status in the HSN is equal to or different from in LINKS with only information from death or marriage certificates, respectively. Panel (e) shows similar proportions but with only information from marriage and death certificates of the RP’s children used in LINKS. Source: As for .
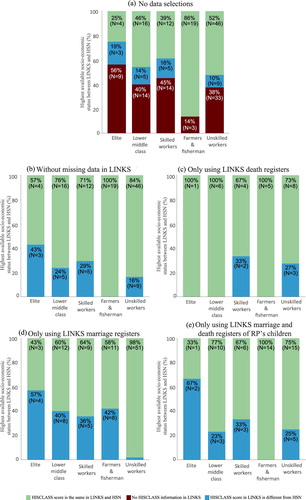
Panels (c)–(e) in show comparisons of the occupational score in the HSN with the LINKS score on the RP’s death certificate, their marriage certificate, and the marriage and death certificates of the RP’s children. The choice of certificate type determined the sample size. Occupations were recorded on death certificates only if the deceased held an occupation at the time of death. As a result, occupational information on death certificates was limited and only available for 29 cases, but the HISCLASS scores were very similar in both data sets (panel (c)). Marriage certificates were available for 112 RPs, of whom 52 were identified as unskilled workers in the HSN; 98 per cent of these cases were also identified as unskilled labourers on their marriage certificates. However, marriage certificates are less concordant with the HSN for socially mobile individuals. Between 36 and 42 per cent of the farmers, skilled labourers, and lower middle class had a different occupational position on their marriage certificate than in the HSN. This difference was larger for the elite (57 per cent). The 59 RPs with marriage and death certificates of children in the LINKS data set (panel (e)) showed a better balance between sample size and matching quality in socio-economic position than those compared in panel (d). Similarly, farmers showed no differences at all between the HSN and LINKS data sets. For the other groups, socio-economic positions ranged from 23 per cent to 33 per cent of unskilled workers, skilled workers, and the lower middle class. For the elite two out of the three observations were different. More observations of socio-economic status are available for individuals with more children, and for this group HSN and LINKS reflect each other better. More generally, because in passive registration databases the number of observations depends on the number of linked events, passive registration databases reflect the active registration database better when more events are linked.
Conclusion and discussion
In this paper, we compared life-course and family reconstructions for 495 individuals available in two different types of data sources: the HSN, based on active registration in the population registers, and LINKS, based on passive registration from civil certificates. We found that differences between the HSN and LINKS were caused by censoring due to migration, rather than by the nature of the administrative process (which seems to induce more random missingness). Selecting specific cases made most differences in demographic estimates between the databases based on active and passive registration disappear, but only for estimates at the individual level.
In general, the identification of children appears to be more complete when databases are based on active registration. The total number of families with children and the number of identified children per family were higher in the HSN than in LINKS. However, after adjustments to exclude interprovincial migration, the number of children identified was usually identical in the two databases. This finding illustrates that for non-migrants the identification of children using passive registration is of similar quality to that using active registration. In line with our expectations, the number of RPs with known siblings and the size of the RP’s sibling set were smaller in the HSN than in LINKS. Sibling reconstructions in LINKS were complete when the parents’ marriage certificate was available. Due to the research design of population registers and the HSN, not all siblings were found in the population registers in which the RPs appeared. Apart from missing some migrants, LINKS seems to contain well-reconstructed families, meaning that not only the correct numbers of children, but also siblings were identified in the data set. For databases based on sources with either passive or active registration, it seems best to include observations on siblings or offspring only when separate indicators suggest that life courses and subsequent observations on sibships or offspring are not censored.
Population estimates of demographic behaviour are strongly affected by whether observations are missed due to migration. Ruggles (Citation1992) used simulation methods to show that—even in the absence of ‘healthy migrant’ effects—cessation of observation on individuals due to out-migration causes underestimation of the ages at which demographic events occur. As more individuals were lost from observation due to migration in LINKS than in the HSN, due to the provincial scope of LINKS and the national scope of the HSN, we expected that the mean age at which life-course transitions occur would be lower in LINKS than in the HSN. Indeed, we found that not only age at death, but also ages at first marriage, first childbirth, and last childbirth were higher in the HSN than in LINKS. More generally, this implies that mean estimates, such as average age at death of a study population, show a stronger downward bias when the loss of observation due to migration increases. However, estimates of age at marriage are much less affected by migration. This is in line with earlier work, which has shown that in some populations migration patterns may not distort estimations of age at marriage at all, as individuals migrating out may migrate for marriage specifically, or very early in life, before they are at risk of marrying (Desjardins Citation1995; Voland and Dunbar Citation1997). Migration at young ages, or because of a marriage at the same age as in the population of origin, does not bias estimations of age at marriage (Desjardins Citation1995). In addition, more men and women had no identified children in LINKS than in the HSN. Censoring of observations due to migration—and not passive registration—thus has a significant effect on population estimates.
Ages at death were identical in the HSN and LINKS for 304 out of 306 cases, indicating the validity and comparability of the life-course reconstructions in both databases. In line with earlier observations from Hacker (Citation1997), migration seemed to have a strong effect on mortality estimates. We expected to find a lower mean age at death in LINKS than in the HSN, as it has been shown that migrants are often healthier than the native population. Indeed, we found a lower mean lifespan for the RPs in LINKS than in the HSN, attributable to the almost 100 extra observations of lifespans available in the HSN compared with LINKS. These observations mainly concerned out-migrated adults, increasing mean lifespan in the HSN. Moreover, we found that individuals who were observed outside the province of Zeeland during their life course, but who returned to Zeeland, died at earlier ages than individuals who never migrated or who migrated within the province of Zeeland. This suggests that return migration occurred because of health considerations, contributing to the problem of underestimation of ages at death in LINKS. In sum, this means that reliable estimates of mortality rates in the general population cannot be derived from regions with pronounced out-migration, unless subgroups are studied (e.g. infants or those aged 50+) or moments of censoring after the last observation are inferred (Gill Citation1997; Jonker and Van der Vaart Citation2001, Citation2007; Alter et al. Citation2009). However, we may wonder how useful the latter method is, seeing as it only corrects mortality estimates for when individuals migrate, (i.e. at ages 15–50) and not for when migrants have left (ages 50+).
In the literature, a number of earlier studies have reported findings in line with the salmon bias theory, which states that the relative health advantage of migrants compared with the native population may at least partially be caused by the return migration of unhealthy migrants. Earlier work has found that healthier individuals tend to migrate more and move further, in contemporary as well as historical populations (Alter and Oris Citation2005; Lassetter and Callister Citation2009). Work from England has shown that migrants affected by pulmonary tuberculosis tended to return to their regions of origin, leading to high mortality rates in sending regions and relatively low mortality rates in receiving regions (Hinde Citation2015). At the same time, a historical study on Rotterdam did not find evidence for either healthy migrant or salmon bias effects (Puschmann et al. Citation2017). However, evidence from the current data is in line with both healthy migrant and salmon bias effects. Possibly, in Rotterdam, healthy migrant effects were counterbalanced by a heavy urban penalty affecting migrants’ health, which was absent in the small towns of Zeeland. Alternatively, for salmon bias to occur, a disease must be chronic rather than causing a sudden death (Reid and Garrett Citation2018); the occurrence of salmon bias may therefore be related to spatial differences in disease patterns.
This paper has illustrated that life-course and family reconstructions based on linked passive registration on individuals constitute a reliable alternative to such reconstructions based on active registration. First, through the further integration of existing sources, databases for innovative new research may be generated. Information from different data sets can be combined to gain new and more complete insights into demographic behaviour. The extensive family networks found in LINKS can contribute more detailed kinship information to the HSN with regard to, for instance, lifeless reported infants (siblings and children) or more detailed observations on socio-economic status. In current versions of the HSN, marriage certificates—which are also included in LINKS—are already used to enrich the information on relationship formation found in population registers. Second, differences between the two databases may themselves be of interest to family historians and historical demographers. Diverging information on siblings and children within households in the HSN and regardless of household in LINKS may provide researchers with clues about non-co-resident kin, a phenomenon on which neither database alone provides information. Similarly, supplemental observations on socio-economic status in the HSN may enrich our understanding of the development of the status of individuals over time. As the current analyses have shown, it should be taken into account that information for certain types of individuals, such as index persons from LINKS who remained in their province of origin, may more readily be matched between databases.
Notes
1 First authorship is shared between Niels van den Berg, Ingrid K. van Dijk, and Rick J. Mourits. Please direct all correspondence to Ingrid K. van Dijk, Department of Economic History, Box 7080, S-220 07 Lund, Sweden; or by E-mail: [email protected]
2 Niels van den Berg is based at the Department of History, Radboud University Nijmegen, and the Department of Molecular Epidemiology, Leiden University Medical Centre, both in the Netherlands. Ingrid K. van Dijk is based at the Department of History, Radboud University Nijmegen, the Netherlands, and the Centre for Economic Demography and Department of Economic History, Lund University, Lund, Sweden. Rick J. Mourits is based at the Department of History, Radboud University Nijmegen, and also the Department of History, Utrecht University, both in the Netherlands. P. Eline Slagboom is based at the Department of Molecular Epidemiology, Leiden University Medical Centre, the Netherlands, and the Max Planck Institute for Biology of Ageing in Cologne, Germany. Angelique A. P. O. Janssens is based at the Department of History, Radboud University Nijmegen, and the Department of History, Maastricht University, both in the Netherlands. Kees Mandemakers is based at the International Institute of Social History, Amsterdam, and the Erasmus School for History, Culture and Communication, Erasmus University, Rotterdam, both in the Netherlands.
3 Funding for this paper is from the Nederlandse Organisatie voor Wetenschappelijk Onderzoek, grant no. 360–53–180.
References
- Adams, J. W., A. B. Kasakoff, and J. Kok. 2002. Migration over the life course in XIXth century Netherlands and the American North: A comparative analysis based on genealogies and population registers. Paper presented at the Annales de démographie historique.
- Alter, G., I. Devos, and A. Kvetko. 2009. Completing life histories with imputed exit dates: A method for historical data from passive registration systems, Population 64(2): 293–318. doi: 10.3917/pope.902.0293
- Alter, G., and M. Oris. 2005. Childhood conditions, migration, and mortality: Migrants and natives in 19th century cities, Social Biology 52(3-4): 178–191. doi: 10.1080/19485565.2005.9989108
- Burgerlijk Wetboek [Dutch civil code] (2019-01-01). Available: https://wetten.overheid.nl/BWBR0002656/ (accessed: 10 June 2019)
- Campbell, C. D. 2015. Demographic techniques: Family reconstitution, in N. J. Smelser & Baltes (eds), International Encyclopedia of the Social Science & Behavioral Sciences (Second Edition). Amsterdam: Elsevier, pp. 138–142. doi: 10.1016/B978-0-08-097086-8.31012-1
- CBG (Centraal Bureau voor Geneaologie) 2019. Uittreksels PK/PL’s. Available: cbg.nl/diensten/uittreksels-pkpl.
- Delger, H., and J. Kok. 1998. Bridegrooms and biases: A critical look at the study of intergenerational mobility on the basis of marriage certificates, Historical Methods: A Journal of Quantitative and Interdisciplinary History, 31(3): 113–121. doi: 10.1080/01615449809601194
- Desjardins, B. 1995. Bias in age at marriage in family reconstitutions: Evidence from French-Canadian data, Population Studies 49(1): 165–169. doi: 10.1080/0032472031000148306
- Ekamper, P., F. Van Poppel, and K. Mandemakers. 2011. Widening horizons? The geography of the marriage market in the nineteenth and early-twentieth century Netherlands, in E. R. Merchant, G. D. Deane, M. P. Gutmann and K. M. Sylvester (eds.), Navigating Time and Space in Population Studies. Dordrecht: Springer, pp. 115–160.
- Fu, Z., H. M. Boot, P. Christen, and J. Zhou. 2014. Automatic record linkage of individuals and households in historical census data, International Journal of Humanities and Arts Computing 8: 204–225. doi: 10.3366/ijhac.2014.0130
- Gavrilov, L. A., and N. S. Gavrilova. 2001. Biodemographic study of familial determinants of human longevity, Population: An English Selection 13(1): 197–221. doi: jstor.org/stable/3030266
- Gill, R. D. 1997. Nonparametric estimation under censoring and passive registration, Statistica Neerlandica 51(1): 35–54 doi: 10.1111/1467-9574.00036
- Hacker, J. D. 1997. Trends and determinants of adult mortality in early New England: Reconciling old and new evidence from the long eighteenth century, Social Science History 21(4): 481–519. doi: 10.1017/S014555320001782X
- Henry, L. 1970. Manuel de Démographie Historique, 2nd edn. Geneva: Droz.
- Hinde, A. 2015. Sex differentials in phthisis mortality in England and Wales, 1861–1870, The History of the Family 20(3): 366–390, doi: 10.1080/1081602X.2015.1051077
- HSN 2010a. Historical Sample of the Netherlands (HSN): Data set civil certificate release 2010.01 [Data file and code book].
- HSN 2010b. Historical Sample of the Netherlands (HSN): Data set life courses release 2010.01 [Data file and code book].
- IISG 2018. About HSN: Sampling. Available: https://socialhistory.org/en/hsn/sampling
- Janssens, A. 1993. Family and Social Change. The Household as a Process in an Industrializing Community. Cambridge: Cambridge University Press.
- Jonker, M. A., and A. W. van der Vaart. 2001. A semi-parametric model for censored and passively registered data, Bernoulli 7(1): 1–31. doi: 10.2307/3318600
- Jonker, M. A., and A. W. van der Vaart. 2007. Correcting missing-data bias in historical demography, Population Studies 61(1): 99–113. doi: 10.1080/00324720601048228
- Kasakoff, A. B. and J. W. Adams. 1995. The effect of migration on ages at vital events: A critique of family reconstitution in historical demography, European Journal of Population 11(3): 199–242. doi: 10.1007/bf01264948
- Knotter, A., A. C. Meijer, F. W. J. Scholten, J. Tabak, and G. M. Welling. 1995. De gemeentelijke bevolkingsregisters, 1850–1920 [The municipal population registers, 1850–1920], in Broncommentaren [Source Commentaries]. Den Haag: Instituut voor Nederlandse Geschiedenis, pp. 75–116.
- Kok, J. 1997. Youth labor migration and its family setting, The Netherlands 1850–1940, The History of the Family 2(4): 507–526. doi: 10.1016/S1081-602X(97)90027-0
- Kok, J., and K. Mandemakers. 2009. “Je zoudt maar last van mij hebben”. Verwanten in het Nederlandse huishouden, 1860-1940 [“I would only be a burden to you”. Co-resident kin in Dutch households, 1860-1940, Tijdschrift Voor Sociale en Economische Geschiedenis/The Low Countries Journal of Social and Economic History 6(4): 139–165.
- Kok, J., K. Mandemakers, and H. Bras. 2009. Van geboortebank tot collaboratory: een reflectie op twintig jaar dataverzameling en onderzoek met de HSN, Tijdschrift Voor Sociale en Economische Geschiedenis 6(4): 3–36. doi: 10.18352/tseg.468
- Lassetter, J. H., and L. C. Callister. 2009. The impact of migration on the health of voluntary migrants in western societies: a review of the literature, Journal of Transcultural Nursing 20(1): 93–104. doi: 10.1177/1043659608325841
- Mandemakers, K. 2000. Historical sample of the Netherlands. in P. K. Hall, R. McCaa, and G. Thorvaldsen (eds.), Handbook of International Historical Microdata for Population Research. Minneapolis: Minnesota Population Center, pp. 149–177.
- Mandemakers, K. 2002. Building life course datasets from population registers by the historical sample of the Netherlands (HSN), History and Computing 14(1–2): 87–107. doi: 10.3366/hac.2002.14.1-2.87
- Mandemakers, K., and F. Laan. 2017. LINKS dataset Genes Germs and Resources. WieWasWie Zeeland. Civil Certificates. Version 2017.01 [Data file and code book].
- Mandemakers, K., R. J. Mourits, S. Muurling, C. Boter, I. K. van Dijk, I. Maas, B van de Putte, R. L. Zijdeman, P. Lambert, M. H. D. van Leeuwen, F. van Poppel, and A. Miles. 2018. HSN standardized, HISCO-coded and classified occupational titles, release 2018.01. edited by IISH. Amsterdam.
- Massey, C. G. 2017. Playing with matches: An assessment of accuracy in linked historical data, Historical Methods: A Journal of Quantitative and Interdisciplinary History 50(3): 129–143. doi: 10.1080/01615440.2017.1288598
- Priester, P. R. 1998. Geschiedenis van de Zeeuwse landbouw circa 1600-1910. ‘t Goy-Houten: HES Uitgevers.
- Puschmann, P., R. Donrovich, and K. Matthijs. 2017. Salmon bias or red herring? Human Nature 28(4), 481–499. doi: 10.1007/s12110-017-9303-1
- Reid, A., and E. Garrett. 2018. Mortality, work and migration. A consideration of age-specific mortality from tuberculosis in Scotland, 1861-1901, Historical Life Course Studies 6(1): 111–132.
- Ruggles, S. 1992. Migration, marriage, and mortality: Correcting sources of bias in English family reconstitutions, Population Studies 46(3): 507–522. doi: 10.1080/0032472031000146486
- Ruggles, S. 1999. The limitations of English family reconstitution: English population history from family reconstitution 1580–1837, Continuity and Change 14(1): 105–130. doi: 10.1017/S0268416099003288
- Ruggles, S., C. A. Fitch, and E. Roberts. 2018. Historical census record linkage, Annual Review of Sociology 14: 19–37. doi: 10.1146/annurev-soc-073117-041447
- Schellekens, J., and F. van Poppel. 2016. Early-life conditions and adult mortality decline in Dutch cohorts born 1812–1921, Population Studies 70(3): 327–343. doi: 10.1080/00324728.2016.1223336
- Song, X., and C. D. Campbell. 2017. Genealogical microdata and their significance for social science, Annual Review of Sociology 43: 75–99. doi:10.1146/annurev-soc-073014-112157
- Stadsarchief Amsterdam. 2018. Handleiding Gezinskaarten 1893-1939. Available: https://archief.amsterdam/indexen/gezinskaarten_1893-1939/handleiding/index.nl.html
- Thorvaldsen, G. 2011. Using NAPP census data to construct the historical population register for Norway, Historical Methods: A Journal of Quantitative and Interdisciplinary History 44(1): 37–47. doi: 10.1080/01615440.2010.517470
- Van den Berg, N., M. Rodriguez-Girondo, I. K. Van Dijk, R. J. Mourits, A. Janssens, K. Mandemakers, M. Beekman, K. R. Smith, and P. E. Slagboom. 2019. Longevity defined as top 10% survivors and beyond is transmitted as a quantitative genetic trait, Nature Communications 10(35). doi: 10.1038/s41467-018-07925-0
- Van Dijk, I. K. 2019. Death and the Family. Life Courses of Individuals From High-Mortality Families, The Netherlands 1812 - 1912. Enschede: Ipskamp.
- Van Dijk, I. K., and Mandemakers, K. 2018. Like mother, like daughter. intergenerational transmission of infant mortality clustering in Zeeland, the Netherlands, 1833–1912, Historical Life Course Studies, 7(2): 28–46. http://hdl.handle.net/2066/187251
- Van Leeuwen, M. H., and I. Maas. 2011. HISCLASS: A Historical International Social Class Scheme. Leuven: University Press.
- Van Poppel, F., M. Jonker, and K. Mandemakers. 2005. Differential infant and child mortality in three Dutch regions, 1812–1909. The Economic History Review, 58(2): 272–309. doi: 10.1111/j.1468-0289.2005.00305.x
- Voland, E., and R. I. Dunbar. 1997. The impact of social status and migration on female age at marriage in an historical population in north-west Germany, Journal of Biosocial Science 29(3): 355–360. doi: 10.1017/S0021932097003556
- Vulsma, R. 1988. Burgerlijke stand en bevolkingsregister [Civil Register and Population Register]. Den Haag: Centraal Bureau voor Genealogie.
- Wisselgren, M. J., S. Edvinsson, M. Berggren, and M. Larsson. 2014. Testing methods of record linkage on Swedish censuses, Historical Methods: A Journal of Quantitative and Interdisciplinary History 47(3): 138–151. doi: 10.1080/01615440.2014.913967