?Mathematical formulae have been encoded as MathML and are displayed in this HTML version using MathJax in order to improve their display. Uncheck the box to turn MathJax off. This feature requires Javascript. Click on a formula to zoom.
Abstract
Since young adults tend to move from rural to urban regions, whereas older adults move from urban to rural regions, we may expect to see increasing differences in population ageing across urban and rural regions. This paper examines whether trends in population ageing across urban and rural NUTS-2 regions of the EU-27 have diverged over the period 2003–13. We use the methodological approach of convergence analysis, quite recently brought to demography from the field of economic research. Unlike classical beta and sigma approaches to convergence, we focus not on any single summary statistic of convergence, but rather analyse the whole cumulative distribution of regions. Such an approach helps to identify which specific group of regions is responsible for the major changes. Our results suggest that, despite expectations, there was no divergence in age structures between urban and rural regions; rather, divergence happened within each of the groups of regions.
Introduction
Human populations experience the demographic transition at varying times and speeds (Lee Citation2003; Reher Citation2004). While booming population growth and persisting high levels of fertility are still the major issues in the least developed countries (Bloom Citation2011), governments in developed countries are most worried about the rapid ageing of their populations (Lutz et al. Citation2008; Bloom et al. Citation2015) and the societal and economic challenges this poses for future generations (Lloyd-Sherlock Citation2000; Skirbekk Citation2008; Christensen et al. Citation2009). As the demographic dividend—the most profitable period of demographic modernization, when the burden on the working-age population is the smallest—is left behind in most developed countries (Van Der Gaag and De Beer Citation2015), the way to deal with population ageing is becoming the central topic of demographic debate (Van Nimwegen Citation2013).
Even though all European countries are experiencing population ageing, there are relative differences in the speed of the process across countries and regions (De Beer et al. Citation2012; Rees et al. Citation2012; Kashnitsky et al. Citation2017). In the context of a rapidly ageing population (Giannakouris Citation2008), migration becomes an increasingly important component of population change (Findlay and Wahba Citation2013); Coleman (Citation2006) has gone as far as proposing the concept of the third demographic transition, in which migration plays the key role in population replacement. While more public attention is fixed on international migration (Van Wissen Citation2001; Czaika and de Haas Citation2014), internal migration is crucial in determining subnational population structures (Rees et al. Citation2013, Citation2017). And the key distinction in the relative speed of population ageing at subnational level is between urban and rural areas, which is in turn largely driven by migration, mostly internal (De Beer et al. Citation2012). Ageing and urbanization are seen as the two main demographic transitions of developed populations (Beard and Petitot Citation2010).
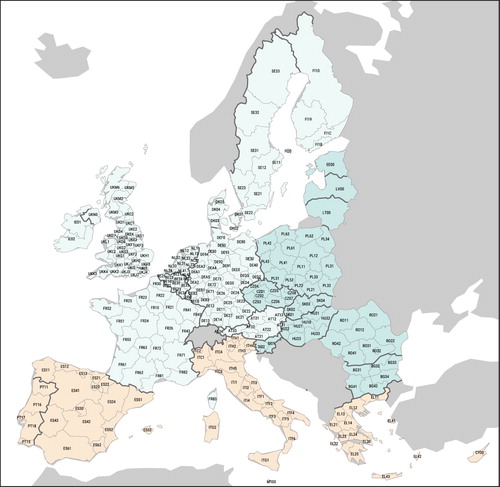
This paper examines differences in population ageing across NUTS-2 regions, which are the result of an attempt to unify geographical levels and facilitate cross-country comparisons (Eurostat Citation2015a). Most existing research on urban–rural differences focuses on the more granular level of NUTS-3 regions or even the more local level (Sabater et al. Citation2017; Gutiérrez Posada et al. Citation2018). However, at the NUTS-2 level many more internationally comparable statistics are available. Moreover, the NUTS-2 level is the most important geographic level in terms of data-informed policy decisions (De Beer et al. Citation2012, Citation2014; Capello and Lenzi Citation2013; European Commission Citation2014). Therefore this paper examines urban–rural differences across the 261 NUTS-2 regions in the European Union (EU-27) over the period 2003–13, for which a harmonized data set is available (De Beer et al. Citation2014; Kashnitsky et al. Citation2017). All the regions included in the analysis are shown in the reference map, Figure A1 in Appendix A. The analysed countries do not include Croatia, which is a current state of the EU but joined only in 2013. However, the United Kingdom, which exited the EU in 2020, is included. Here and throughout the paper, the references to groups of regions, such as Eastern Europe, mean a subset from the analysed EU-27 countries.
Once we have established the concept of urbanization at NUTS-2 level, we explore whether urban–rural differences are contributing towards convergence or divergence in population ageing. The process of urbanization is likely to contribute to a divergent pattern of ageing: urbanized regions tend to attract people of working ages, while rural regions are left with a higher proportion of people out of the labour market (Smailes et al. Citation2014). On the other hand, there is extensive evidence of an urban health and longevity advantage (Beard and Petitot Citation2010; Kibele Citation2014; Chen et al. Citation2017; Naito et al. Citation2017). This urban health bonus, coupled with lower fertility in the most urbanized areas (Kulu et al. Citation2009; Vobecká and Piguet Citation2011; Van Nimwegen Citation2013), is likely to contribute to faster ageing in urban areas, offsetting the direct effect of urbanization (Zeng and Vaupel Citation1989). Even though there are multiple studies that document increasing disproportions in local population structures (Chen et al. Citation2017; Faggian et al. Citation2017; Sabater et al. Citation2017; Gutiérrez Posada et al. Citation2018), it is rather unclear whether a similar pattern can be found at the NUTS-2 level.
There are large demographic differences between Eastern, Southern, and Western Europe that might also manifest themselves in the process of urbanization. For example, Shucksmith et al. (Citation2009) found that the urban–rural difference in quality of life is much smaller in Western Europe compared with Eastern Europe. Similarly, Crespo Cuaresma et al. (Citation2014) uncovered a large heterogeneity between Eastern European regions. Even though on average they are catching up, the gap between the biggest urban regions and the periphery is widening within countries. Multiple studies have revealed a widening gap between the deprived peripheral regions and the better-off urban areas in the countries of Southern Europe after the financial crisis of 2008–09 (Salvati Citation2016; Salvati and Carlucci Citation2017). Thus, our paper examines the differential effect of the urban–rural divide on convergence or divergence in ageing in Western, Southern, and Eastern Europe.
Is there urbanization at the NUTS-2 regional level?
The official Eurostat urban–rural classification exists only at the NUTS-3 level (Eurostat Citation2017); such a classification requires quite a granular delimitation of urban areas, which is only possible at low enough levels of spatial disaggregation. However, most statistics comparable at the pan-European level are aggregated at the NUTS-2 level, which is the prime level of regional analysis within the EU. Also, the regional Cohesion Policy programmes operate at the NUTS-2 level (Leonardi Citation2006). NUTS-2 regions are rather large: on average, a NUTS-2 region has an area of 19,700 km2 and a population of 1.87 million, comparable to a small country such as Slovenia (European Commission Citation2014; Kashnitsky and Mkrtchyan Citation2014). Almost every NUTS-2 region includes both urban and rural populations, which makes it difficult to classify the regions into binary urban or rural groupings. The challenging classification task was solved within the NEUJOBS project. To proxy urban–rural differences, NUTS-2 regions were classified into three categories: Predominantly rural, Intermediate, and Predominantly urban. This classification was designed in such a way as to keep the population figures of the three categories as close as possible to that of the official Eurostat NUTS-3 level classification (De Beer et al. Citation2012, Citation2014). In this paper we use a simplified version of the NEUJOBS classification ((a)).
Figure 1 Reference maps of the EU-27 NUTS-2 regions: (a) NEUJOBS urban–rural classification; inset map shows the division of European countries into Western, Southern, and Eastern parts; mosaic plot in the top left corner gives the relative frequencies of the regions across the three parts of Europe and the Urban/Intermediate/Rural classification. (b) Percentage of the population that is of working age in 2003. (c) Percentage of the population that is of working age in 2013
Notes: See Appendix A for a reference map with all the regions labelled. SD refers to the standard deviation and CV to the coefficient of variance. Source: De Beer et al. Citation2012; Eurostat Citation2015a; Eurovoc Citation2017 (modified by the authors).
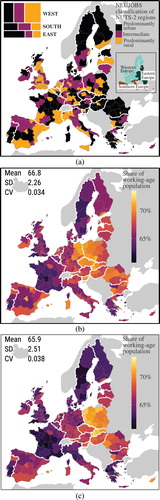
On average, European regions aged a bit over the study period, 2003–13 ((b) and 1(c)): the mean proportion of population that was of working age (15–64) decreased by almost one percentage point, from 66.8 per cent to 65.9 per cent. Note that in the rest of the paper we use the term ‘share of working-age population’ to mean the total population aged 15–64 as a proportion of the whole population. At the same time, inequality in regional population age structures increased—the standard deviation of the share of working-age population rose from 2.26 per cent to 2.51 per cent, and the coefficient of variance rose accordingly, from 0.034 to 0.038. This large-scale glance suggests that together with the dominant process of population ageing, there was divergence in population age structures, at least as measured by these two variance-based metrics. The question we want to tackle is whether this divergence could be explained to some extent by differential population age structure developments in urban and rural regions. Yet, first we need to figure out if urbanization is still happening in Europe.
There is evidence of both urbanization and counter-urbanization occurring in modern Europe at the local level (Kabisch and Haase Citation2011). If anything, regional paths of economic (Ballas et al. Citation2017) and demographic (Wolff and Wiechmann Citation2018; Gurrutxaga Citation2020) development are becoming rather more heterogeneous; Danko and Hanink (Citation2018) found similar results for the counties of the United States (US). The reasonable question arises: are European regions still experiencing urbanization when we look at urban–rural differences at the NUTS-2 level? To address this question, we calculate total net age-specific migration rates for all NUTS-2 regions using the demographic balance approach (Kashnitsky et al. Citation2017). With such an approach, we capture age-specific change in population size due to total migration, not distinguishing between regional (internal) migration and international migration flows (within or outside the EU). Then these rates are smoothed separately for each of the three NEUJOBS categories of regions: Predominantly rural, Intermediate, and Predominantly urban ().
Figure 2 Age-specific total net migration rates per 1,000 population by urban–rural type of NUTS-2 regions, pooled single-year data for the period 2003–12
Note: The lines are smoothed using a generalized additive model. Source: Own calculations based on demographic balance; migration change includes both internal and international migration.
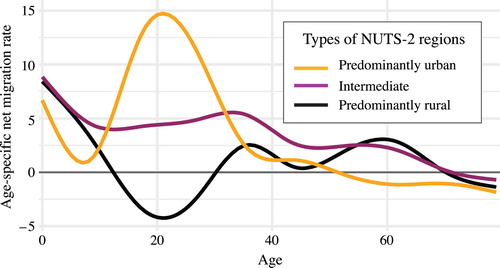
The age pattern looks exactly as we would expect to see in the presence of ongoing urbanization. The process of urbanization implies that people migrate from less urbanized territories to urban agglomerations. Migration always has a characteristic age profile, with higher intensities at young adult ages (Pittenger Citation1974; Rogers et al. Citation2002). This is precisely what we see in —it clearly shows that Predominantly urban regions receive much more in-migration at young adult ages compared with Intermediate and Predominantly rural regions. Rural regions lose population at young adult ages; these young people are most likely to migrate to more urbanized areas, which are able to offer them better educational and employment opportunities. In contrast young families with children and older adults tend to move from Predominantly urban to Predominantly rural and Intermediate regions. Note that the three lines do not balance off at zero net migration, which means that on top of migration between the regions, Europe sees quite a substantial inflow of international migration. To sum up, if we have successfully defined urbanization at the NUTS-2 aggregation level, then there was ongoing urbanization over the period 2003–12.
To account for the possible differences between Eastern, Southern, and Western Europe, we also carry out similar smoothing separately for each of the three parts of Europe (). Following the logic of our previous research (Kashnitsky et al. Citation2020), we divide European NUTS-2 regions not into four parts—as is done by Eurostat’s official (EuroVoc Citation2017) classification—but into three parts: Eastern, Southern, and Western. We choose not to distinguish Northern Europe as a separate part because of its relatively small size (just 22 NUTS-2 regions) and considerable inner heterogeneity: the Nordic regions are merged with Western Europe, and the Baltic regions are classified as Eastern Europe (with which they have much more in common in terms of the analysed variables). See the small inset map in (a) showing the division of the NUTS-2 regions across the three parts of Europe.
Figure 3 Age-specific total net migration rates per 1,000 population by urban–rural type of NUTS-2 regions and parts of Europe, pooled single-year data for the period 2003–12
Note: The lines are smoothed using a generalized additive model. Source: As for .
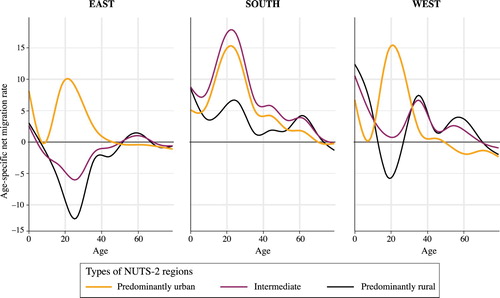
All three parts of Europe experienced faster population growth through migration at adult ages in the Predominantly urban regions than in the Intermediate or Predominantly rural regions, which means that urbanization was occurring at the NUTS-2 level. However, there are some differences between the three parts of Europe in the way they have urbanized. Regions of Southern Europe experienced the highest net migration rates within the study period: even the Predominantly rural regions saw population growth through migration, though much more moderate than that of the Predominantly urban and Intermediate regions. This was due to relatively high international migration. Another feature of Southern European regions is that Intermediate regions are closer to Predominantly urban regions in terms of the age-specific migration profile (based on this we simplify the classification to just Predominantly urban (or Urban) and Predominantly rural (or Rural) in subsequent analyses; see ‘Data’ subsection). The main difference between Eastern and Western Europe is in the later-life migration out of urban areas, suburbanization, and counter-urbanization, that are evident for the latter (by a net migratory surplus in rural regions at the mature adult ages) and non-existent for the former.
One question is whether the net migration age profiles change over time. In Appendix B, Figure A2, we check these profiles for the first (2003–07) and the second (2008–12) halves of the study period. In contrast with the analysis for the US (Cooke Citation2011, Citation2013), we see no major reduction in net age-specific migration rates over time, except in Southern Europe where the reason is likely the economic crisis of 2008–09, coupled with the extremely high in-migration rate just before it.
In summary, despite some notable differences, all the three parts of Europe clearly experienced urbanization at NUTS-2 level during the study period, with urbanization being defined as relative population change due to migration. That brings us back to the question of whether urbanization has contributed to convergence or divergence in population structures.
Methods and data
Methods
In this paper we focus on the share of the population that is of working age as a summary measure of the population age structure. The working-age population is defined conventionally as the proportion of people aged 15–64 in the total population. The reason for choosing this indicator is that it is expected to have a positive relationship with the economic growth potential of regions (Van Der Gaag and De Beer Citation2015).
To compare urban–rural differences in the share of working-age population, we calculate empirical cumulative densities and plot the distributions of corresponding groups of regions arranged in ascending order. This distributional approach to convergence analysis has several advantages. First, it allows us to distinguish different causes of convergence. For instance, convergence can be due to smaller differences across clusters of regions or smaller differences within clusters of regions, and cumulative distributions show both at the same time. Changes in the distance between separate distributions show whether there is convergence or divergence between clusters. This can be seen clearly from changes in the difference in the median values. Changes in the slope of the distributions show whether there is convergence or divergence within a group of regions: the steeper the slope, the smaller the variation of values in the distribution. Hence, an increase in the slope indicates convergence within the group of regions. Second, the approach helps to distinguish the effects of changes that occur in the upper and lower parts of the distribution. This is important since there is a conceptual distinction between convergence occurring due to catching-up of lagging regions or a faster decrease in the upper part of the distribution. Finally, when the profiles of the cumulative density distributions for two groups of regions become more similar over time, this can also indicate a specific type of distributional convergence not otherwise captured by summary measures.
Empirical cumulative densities provide a powerful visualization framework for picturing convergence. However, in order to assess the magnitude of changes, we also need to calculate metrics based on the distributions. For this purpose we use a logistic-type model in which we allow the slope parameter to vary between the lower and upper parts of the distribution, that is, above and below the median value:where
is the cumulative density function;
is the share of working-age population;
is the median value;
is the indicator function; and
,
, and
are the parameters to be estimated by non-linear least squares.
Greater estimated values of the and
parameters indicate that the cumulative density curve is steeper. Hence, an increase in these parameter values over time means convergence, while a decrease means divergence. Furthermore, if
increases there is convergence above the median; if
increases there is convergence below the median. A change in the median value (parameter
) implies a shift of the whole distribution. If, for example,
and
do not change and
increases, that means that the whole distribution is shifted uniformly toward higher values of
, but neither convergence nor divergence due to the change in the cluster distributions is observed; at the same time, between-cluster convergence/divergence is defined by the relative movement of the cluster medians.
Data
We analyse population age structures of the 261 NUTS-2 regions of the EU-27 using a harmonized data set for the years 2003–12 (Kashnitsky et al. Citation2017). The overseas territories of France, Spain, and Portugal are excluded from the data set. The data come from Eurostat (Citation2015b). We use the 2010 definition of NUTS regions (Eurostat Citation2015a) and a modified version of the EuroVoc (Citation2017) official classification of parts of Europe, in which we split Northern European regions between Western Europe (Nordic countries) and Eastern Europe (Baltic countries). The NEUJOBS urban–rural classification of NUTS-2 regions is used (De Beer et al. Citation2012, Citation2014). We simplify it by eliminating the Intermediate category: based on the profile of age-specific net migration rates (), Intermediate regions are classified in Southern Europe as Predominantly urban, and in Eastern and Western Europe as Predominantly rural.
Results
Convergence or divergence in population structures?
To address the main question of the paper—whether urbanization is contributing to divergence (our main hypothesis) or convergence in population age structures—we first want to figure out what the baseline dynamics of the relative regional differences in population structures within the study period were.
A glance at the empirical cumulative densities of the share of working-age population in the three parts of Europe () tells the story of the ending phase of the demographic dividend in Eastern Europe (Van Der Gaag and De Beer Citation2015; Kashnitsky et al. Citation2020). The median values for this group of regions were much higher throughout the study period than those for Southern or Western Europe. In the first half of the period, 2003–08, Eastern Europe showed distinct diverging development from the rest of Europe—its distribution line moved further apart from the two other lines, and increased from 0.694 to 0.701, while it decreased slightly in Southern Europe and stagnated in Western Europe. In this period Eastern Europe was still benefiting from the main phase of demographic dividend. However, in the second half, 2008–13, the gap between Eastern and the rest of Europe started to decrease, indicating the end of the demographic dividend and the start of rapid downward convergence:
decreased by 0.012 in Eastern Europe, 0.011 in Southern Europe, and only 0.007 in Western Europe. The differences between Southern and Western Europe, which were driven entirely by the regions in the upper part of the distributions, virtually disappeared—the South caught up with the West, the forerunner of demographic transition. This may reflect the fact that there were only a handful of regions in Southern Europe that managed to keep a relatively high share of working-age population. Population ageing was especially fast in the upper part of the distribution of Eastern European regions, most likely caused by the rapid outflow of working-age migrants from the urbanized areas of Eastern Europe to Western Europe (Okólski and Salt Citation2014).
Figure 4 Empirical cumulative densities of the share of working-age population for NUTS-2 regions in the three parts of Europe, 2003, 2008, and 2013
Note: The annotated tables represent the parameters of the cumulative densities estimated by non-linear least squares— and
are the parameters of the logistic curve above and below the median, respectively, and
is the median value of the share of working-age population. Source: Own calculations based on population age structures.
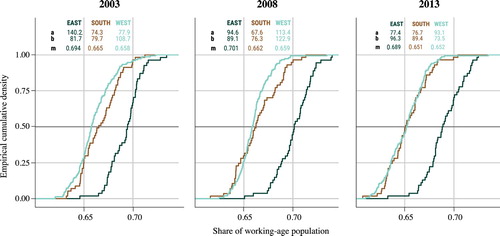
The overall differences between Eastern, Southern, and Western Europe increased a bit in the first half of the study period due to the divergent development of Eastern Europe, but then decreased a lot by the end of the study period. In fact, the differences in the cumulative density distributions between Southern and Western Europe disappeared completely. On analysing the slopes of the empirical cumulative densities, we notice that they became much more similar towards the end of the study period; in every part of Europe the distribution of regions became alike. However, the distributions themselves became less steep, meaning that the overall variance in the share of working-age population increased, indicating divergence within the three parts of Europe. In other words, regions in every part of Europe became more heterogeneous by the end of the study period. This effect is most clearly visible in Western Europe, which was characterized by a squeezed lower tail of the distribution in 2003. By 2013 the lower half of the distribution had become much shallower and wider, which reflects the fact that there are some regions in Western Europe that are ageing at an accelerated pace. Most likely, these are the regions of rural periphery (Kashnitsky and Schöley Citation2018). This raises the question of whether the divergence in population age structures can be attributed to the effects of urbanization.
The contribution of urbanization
compares the empirical cumulative densities of Predominantly rural and Predominantly urban regions in Europe as a whole at the beginning, middle, and end of the study period. At first glance, they look surprisingly alike, and there seems to be very little change between the lines over time. This is an artefact driven by the systematic differences in the timing of demographic transition between the three parts of Europe (Kashnitsky et al. Citation2020). As in the case of the analysis of convergence in ageing for all European NUTS-2 regions in , the differences between Eastern, Southern, and Western Europe are masking the differences that exist between the urbanized and less urbanized regions.
Figure 5 Empirical cumulative densities of the share of working-age population for NUTS-2 regions in the two urban–rural categories, Europe, 2003, 2008, and 2013
Note: The annotated tables represent the parameters of the cumulative densities estimated by non-linear least squares— and
are the parameters of the logistic curve above and below the median, respectively, and
is the median value of the share of working-age population. Source: As for .
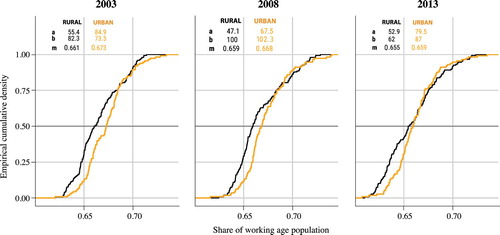
When similar empirical cumulative densities are calculated for each part of Europe separately, the picture becomes much more informative (). The dynamics of the distributions suggest that in every part of Europe, differences between urban and rural regions have decreased over time—the cumulative distribution lines for urban and rural regions come closer to each other over time in every part of Europe. This means that the process of urbanization—which, as we saw in and , was occurring in Europe at NUTS-2 level over the study period—contributed to convergence of regions in population structures rather than the expected divergence.
Figure 6 Empirical cumulative densities of the share of working-age population for the NUTS-2 regions in three parts of Europe and two urban–rural categories, 2003, 2008, and 2013
Note: The annotated tables represent the parameters of the cumulative densities estimated by non-linear least squares— and
are the parameters of the logistic curve above and below the median, respectively, and
is the median value of the share of working-age population. Source: As for .
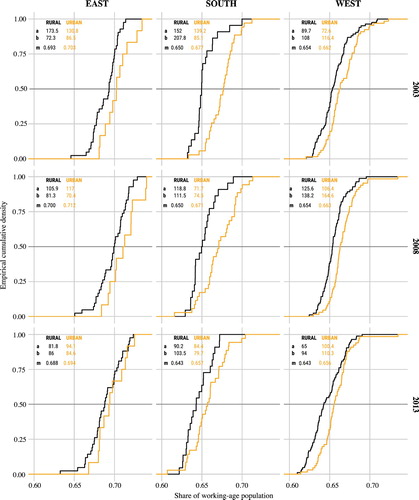
In Eastern European regions, the distributions of urban and rural regions have become very similar, indicating convergence. Also, the urban–rural difference in the median values reduced strongly in the second part of the study period, from 0.012 to 0.006. At the same time, within the urban and rural groups of regions, variation increased in the regions with relatively high shares of population of working age—the slopes above the median became less steep: the value of the parameter for rural regions declined from 173.5 to 81.8 between 2003 and 2013, and for urban regions from 130.8 to 94.1.
In Southern Europe, urban regions aged fastest, reducing the gap with rural regions: the values of for urban regions decreased from 0.677 to 0.657 over the ten-year period. As a result, the urban–rural difference in
decreased from 0.027 to 0.014. The Southern regions saw the biggest increase in variation within urban and rural groups of regions, which may reflect the uneven effect of the 2008–09 economic crisis that hit this part of Europe hardest. The
parameter for rural regions declined from 152.0 to 90.2, and for urban regions from 139.2 to 84.4; the
parameter for rural regions decreased from 207.8 to 103.5, and for urban regions from 85.1 to 79.7.
Western regions saw a rapid convergence in the first part of the period, and then divergence in the second part. The parameter for rural regions increased from 89.7 to 125.6 in the first subperiod and declined to 65.0 during the second subperiod; for urban regions there was an increase from 72.6 to 106.4 followed by a decrease to 100.4. The
parameter for rural regions increased from 108 to 138.2 followed by a decrease to 94.0, and for urban regions an increase from 116.4 to 164.6 was followed by a decrease to 110.3. The difference in the medians did not change in the first subperiod, but increased in the second subperiod, even though both urban and rural regions saw greying of the first baby boomers; the urban–rural difference in
increased from 0.008 in 2003 to 0.013 in 2013. This reflects the uneven effect of the ageing of the baby boom generation across Western regions—it hit rural regions more than urban regions and hit the lower half of the distribution of urban regions more than the upper half. In fact, only the second part of the study period in Western regions shows us a picture close to the one that we expected, in which faster ageing in rural regions increases the gap in population age structures between urban and rural regions and increases the heterogeneity within both groups of regions.
The distributions for South and West, that in the first analysis () became almost identical towards the end of the study period, no longer look so similar once we distinguish between urban and rural regions (). In Southern regions the main urban–rural differences occur in the upper half of the distribution, indicating that there are a certain number of urban regions that have been more successful in preserving a younger population structure. In contrast, in Western regions the upper half of the rural distribution does not differ a lot from that of the urban regions. This may be the result of less contrast in the urban–rural continuum in the densely populated parts of Western Europe, meaning that prosperous rural regions do not age much faster than urban regions.
The overall contribution of urban–rural differences to regional differences in population ageing is clearly visible in the changes of the median values. In both Eastern and Southern Europe this difference reduced significantly during the study period, indicating convergence across urban and rural regions in population ageing, in contrast to the overall divergence of population age structures. Western Europe saw a slight increase in the difference between the medians, which was to some extent compensated by the reduced difference in the upper half of the distribution. In general, we see a decrease in the estimated values of the and
parameters, which means that within urban and rural groups of regions there was divergence in population age structures. In all three parts of Europe, the fastest divergence occurred in the upper half of the distributions. This means that, in the context of a rapidly ageing Europe, there are some regions that have been more successful in keeping a relatively high proportion of their population at working ages.
Discussion
Our results show that overall NUTS-2 regions in Europe have become less similar in population age structures over time, though the differences between the three parts of Europe—Eastern, Southern, and Western—have diminished. Similarly, yet contrary to our expectations, continuing urbanization does not appear to have led to divergence in population age structures, that is, increasing disparities between urban and rural regions. Instead, both categories of regions have become more heterogeneous. Towards the end of the study period, we observe that regions in the upper part of the rural distribution, those with the highest share of working-age population, have become less different from the corresponding upper part of the urban distribution. This development is less prominent in the lower part of the distributions—rural regions with the lowest shares of working-age population form particularly disadvantaged clusters. This suggests that the urban–rural classification is becoming less informative. This finding is in line with other published papers (Kabisch and Haase Citation2011; Pagliacci Citation2017; Wolff and Wiechmann Citation2018; Danko and Hanink Citation2018).
One limitation of our study is the rather crude conventional approach to the definition of ageing based on the fixed age boundaries of the working-age population. With increasingly flexible later-life working arrangements, the cut-off of 65 years of age is progressively becoming less descriptive of a population’s real productivity (Vaupel and Loichinger Citation2006; Lee et al. Citation2014). Ideally, we would want to use estimates for population consumption and production age curves at regional level, similar to the National Transfer Accounts estimated for countries (Kupiszewski Citation2013; Vargha et al. Citation2017; Kluge et al. Citation2019). Unfortunately, these estimates are not yet available at the regional level, which is the focus of this study on urban–rural differences.
One possible refinement of the presented results could include a more nuanced approach to the definition of age boundaries for the older-age population (Sanderson and Scherbov Citation2010; Spijker and MacInnes Citation2013; Kjærgaard and Canudas-Romo Citation2017; Loichinger et al. Citation2017). The arbitrary conventional working-age lower boundary of 15 years is also changing its meaning with the persistent growth in educational uptake among older teenagers (K. C. et al. Citation2010; Harper Citation2014) and the prolonging of transitions to adulthood (Billari and Liefbroer Citation2010; Bongaarts et al. Citation2017). Thus, conventional age cut-offs are becoming less and less valuable in defining the transition to the working-age category. This is especially important given the tremendous diversification of lifestyles and generally much increased variability in pathways to adulthood (Buchmann and Kriesi Citation2011; Damaske and Frech Citation2016). In fact, the more variable the age of becoming ‘adult’, the less informative any fixed cut-off point becomes. To address this limitation of our study, we check how sensitive the regional differences in the share of working-age population are to shifting the lower age boundary from the conventional 15 years to 20 years, and the upper boundary from 65 to 70 years (see Appendix C). The sensitivity check suggests that our results are robust to the definition of the working-age population—shifting the definition of working-age population may slightly offset the timing of the demographic transition but not reverse the relative regional differences.
Another possible way to develop the present study would be to focus on other relevant dimensions of regional inequality that may contribute to convergence or divergence in population age structures and may interact with other urban–rural differences, for example in the ethnic (Franklin Citation2014), socio-economic (Tselios Citation2014), and educational (Striessnig and Lutz Citation2013; Goujon et al. Citation2016) structures of the population.
The evident difficulty of research on urban–rural differences in population structures lies in the urban–rural classification itself. In this paper we rely on the classification developed in the NEUJOBS project (De Beer et al. Citation2012, Citation2014). Apart from the aggregation difficulties that are discussed, and solved by this approach, there are challenges posed by the constantly evolving urban–rural continuum. For instance, many regions of Europe still experience urban sprawl (Morollón et al. Citation2016, Citation2017; Salvati and Carlucci Citation2016). There have been multiple attempts to develop a more nuanced approach to urban–rural classification (Champion Citation2009; Pagliacci Citation2017). Some studies have shown that movements of urban–rural boundaries can have quite some effect on urban–rural differences in demographic development (Chen et al. Citation2017). The increasing difficulty of the urban–rural boundary delimitation even motivated Caffyn and Dahlström (Citation2005) to call for a new interdependence approach in urban–rural research, as opposed to the conventional approach that is focused on differences.
Conclusions
Our paper examines whether urbanization has contributed to divergence in population ageing between urban and rural NUTS-2 regions. We first show that at the NUTS-2 level the age profiles of net migration indicate that there has been ongoing urbanization. Young adults tend to move from rural to urban regions. However, our results show that this has not resulted in an increase in the difference in population age structures between urban and rural regions. The effect of net migration has been rather small, outweighed by the overall divergence in the regional distributions of the shares of working-age population. We find support for previous studies that have shown urban areas becoming more and more heterogeneous (Kabisch and Haase Citation2011; Wolff and Wiechmann Citation2018). It is important to distinguish urban regions that tend to form successful clusters, in terms of preserving favourable population age structures, from less prosperous ones (Sabater et al. Citation2017). This distinction was especially evident in Southern Europe after the 2008–09 economic recession (Salvati Citation2016; Salvati and Carlucci Citation2017). Regional population age structures are becoming more unequal both in urban and rural groups of regions, and the binary urban–rural classification is becoming less and less useful in distinguishing macro patterns in regional population age structure dynamics.
Notes
1 Ilya Kashnitsky, Joop De Beer, and Leo Van Wissen are all based at the Netherlands Interdisciplinary Demographic Institute and University of Groningen. Ilya Kashnitsky is also based at the Interdisciplinary Centre on Population Dynamics, University of Southern Denmark, and the National Research University Higher School of Economics, Russia.
2 Please direct all correspondence to Ilya Kashnitsky, J.B. Winsløws Vej 9B, 5000 Odense C, Denmark; or by E-mail: [email protected], [email protected]
3 Funding: This research has been supported by the Basic Research Programme of the National Research University Higher School of Economics and by Erasmus Mundus Action 2 grant in Aurora II (2013–1930).
4 The authors thank the peer reviewers and the editorial team of the journal for the many excellent suggestions to improve the paper.
5 Authors’ Twitter handles are as follows: Ilya Kashnitsky @ikashnitsky; Joop De Beer @BeerJoop; Leo Van Wissen @leo_wissen.
References
- Ballas, Dimitris, Danny Dorling, and Benjamin Hennig. 2017. Analysing the regional geography of poverty, austerity and inequality in Europe: A human cartographic perspective, Regional Studies 51(1): 174–185. doi: 10/ggnmpg
- Beard, John R., and Charles Petitot. 2010. Ageing and urbanization: Can cities be designed to foster active ageing?, Public Health Reviews 32(2): 427–450. doi: 10/ggnfgw
- Billari, Francesco C., and Aart C. Liefbroer. 2010. Towards a new pattern of transition to adulthood?, Advances in Life Course Research 15(2-3): 59–75. doi: 10/cxkgfg
- Bloom, David E. 2011. 7 billion and counting, Science 333(6042): 562–569. doi: 10/d6h9c9
- Bloom, David E., Somnath Chatterji, Paul Kowal, Peter Lloyd-Sherlock, Martin McKee, Bernd Rechel, Larry Rosenberg, and James P. Smith. 2015. Macroeconomic implications of population ageing and selected policy responses, The Lancet 385(9968): 649–657. doi: 10/f25v3m
- Bongaarts, John, Barbara S. Mensch, and Ann K. Blanc. 2017. Trends in the age at reproductive transitions in the developing world: The role of education, Population Studies 71(2): 139–154. doi: 10/ggnfh9
- Buchmann, Marlis C., and Irene Kriesi. 2011. Transition to adulthood in Europe, Annual Review of Sociology 37(1): 481–503. doi: 10/crbdjz
- Caffyn, Alison, and Margareta Dahlström. 2005. Urban–rural interdependencies: Joining up policy in practice, Regional Studies 39(3): 283–296. doi: 10/fns9k2
- Capello, Roberta, and Camilla Lenzi. 2013. Territorial patterns of innovation and economic growth in European regions, Growth and Change 44(2): 195–227. doi: 10/f4xqd7
- Champion, Tony. 2009. Urban–rural differences in commuting in England: A challenge to the rural sustainability agenda?, Planning Practice & Research 24(2): 161–183. doi: 10/brwjwx
- Chen, Quanrun, Erik Dietzenbacher, and Bart Los. 2017. The effects of ageing and urbanisation on China’s future rural and urban populations, Asian Population Studies 13(2): 172–197. doi: 10/ggnfjb
- Christensen, Kaare, Gabriele Doblhammer, Roland Rau, and James W. Vaupel. 2009. Ageing populations: The challenges ahead, The Lancet 374(9696): 1196–1208. doi: 10/b463sd
- Coleman, David. 2006. Immigration and ethnic change in low-fertility countries: A third demographic transition, Population and Development Review 32(3): 401–446. doi: 10/dhp669
- Cooke, Thomas J. 2011. It is not just the economy: Declining migration and the rise of secular rootedness, Population, Space and Place 17(3): 193–203. doi: 10/bqjz6b
- Cooke, Thomas J. 2013. Internal migration in decline, The Professional Geographer 65(4): 664–675. doi: 10/ggnphh
- Crespo Cuaresma, Jesus, Gernot Doppelhofer, and Martin Feldkircher. 2014. The determinants of economic growth in European regions, Regional Studies 48(1): 44–67. doi: 10/gfgwbb
- Czaika, Mathias, and Hein de Haas. 2014. The globalization of migration: Has the world become more migratory?, International Migration Review 48(2): 283–323. doi: 10/gdnfpd
- Damaske, Sarah, and Adrianne Frech. 2016. Women’s work pathways across the life course, Demography 53(2): 365–391. doi: 10/f8hnnd
- Danko, Joseph J., and Dean M. Hanink. 2018. Beyond the obvious: A comparison of some demographic changes across selected shrinking and growing cities in the United States from 1990 to 2010, Population, Space and Place 24(6): e2136. doi: 10/gd4g3d
- De Beer, Joop, Rob Van Der Erf, and Corina Huisman. 2012. The Growth of the Working Age Population: Differences Between Rural and Urban Regions Across Europe, D 8.1. The Hague: NIDI. Available: http://bit.ly/debeer2012.
- De Beer, Joop, Nicole Van Der Gaag, and Rob Van Der Erf. 2014. New classification of urban and rural NUTS 2 regions in Europe, NIDI Working Papers 2014/3. Available: https://bit.ly/debeer2014nwp.
- European Commission. 2014. Eurostat Regional Yearbook 2014. Luxembourg: Publications Office of the European Union. doi: 10.2785/54659
- Eurostat. 2015a. History of NUTS. Available: http://ec.europa.eu/eurostat/web/nuts/history.
- Eurostat. 2015b. Population on 1 January by age, sex and NUTS 2 region. Available: http://bit.ly/eurostat2015n2agesex.
- Eurostat. 2017. Urban-rural typology, Statistics Explained. Available: https://bit.ly/eurostat2017urbrur.
- EuroVoc. 2017. Subregions of Europe. Available: http://eurovoc.europa.eu/100277.
- Faggian, Alessandra, Isha Rajbhandari, and Kathryn R. Dotzel. 2017. The interregional migration of human capital and its regional consequences: A review, Regional Studies 51(1): 128–143. doi: 10/gfc4pz
- Findlay, Allan M., and Jackline Wahba. 2013. Migration and demographic change, Population, Space and Place 19(6): 651–656. doi: 10/ggnfg4
- Franklin, Rachel S. 2014. An examination of the geography of population composition and change in the United States, 2000–2010: Insights from geographical indices and a shift–share analysis, Population, Space and Place 20(1): 18–36. doi: 10/f5nhdn
- Giannakouris, Konstantinos. 2008. Ageing characterises the demographic perspectives of the European societies, Statistics in Focus 72: 2008. Available: https://bit.ly/giannakouris2008sf.
- Goujon, Anne, Samir K. C., Markus Speringer, Bilal Barakat, Michaela Potancoková, Jakob Eder, Erich Striessnig, Ramon Bauer, and Wolfgang Lutz. 2016. A harmonized dataset on global educational attainment between 1970 and 2060 – An analytical window into recent trends and future prospects in human capital development, Journal of Demographic Economics 82(3): 315–363. doi: 10/f9gb4c
- Gurrutxaga, Mikel. 2020. Incorporating the life-course approach into shrinking cities assessment: The uneven geographies of urban population decline, European Planning Studies 28(4): 732–748. doi: 10/ggnmpj
- Gutiérrez Posada, Diana, Fernando Rubiera Morollón, and Ana Viñuela. 2018. Ageing places in an ageing country: The local dynamics of the elderly population in Spain, Tijdschrift Voor Economische En Sociale Geografie 109(3): 332–349. doi: 10/gdqgsf
- Harper, Sarah. 2014. Economic and social implications of aging societies, Science 346(6209): 587–591. doi: 10/f6mw6g
- Kabisch, Nadja, and Dagmar Haase. 2011. Diversifying European agglomerations: Evidence of urban population trends for the 21st century, Population, Space and Place 17(3): 236–253. doi: 10/cz3qz2
- Kashnitsky, Ilya, Joop De Beer, and Leo Van Wissen. 2017. Decomposition of regional convergence in population aging across Europe, Genus 73(1): 2. doi: 10/gdq9ws
- Kashnitsky, Ilya, Joop De Beer, and Leo Van Wissen. 2020. Economic convergence in ageing Europe, Tijdschrift Voor Economische En Sociale Geografie 111(1): 28–44. doi: 10/ggnfjh
- Kashnitsky, Ilya, and Nikita Mkrtchyan. 2014. Russian periphery is dying in movement: A cohort assessment of Russian internal youth migration based on census data, NIDI Working Papers 2014/14. doi: 10/ggnfj9
- Kashnitsky, Ilya, and Jonas Schöley. 2018. Regional population structures at a glance, The Lancet 392(10143): 209–210. doi: 10/dfnv
- K. C., Samir, Bilal Barakat, Anne Goujon, Vegard Skirbekk, and Wolfgang Lutz. 2010. Projection of populations by level of educational attainment, age, and sex for 120 countries for 2005–2050, Demographic Research 22(March): 383–472. doi: 10/cgr9ct
- Kibele, Eva U. B. 2014. Individual- and area-level effects on mortality risk in Germany, both east and west, among male Germans aged 65+, International Journal of Public Health 59(3): 439–448. doi: 10/f54prf
- Kjærgaard, Søren, and Vladimir Canudas-Romo. 2017. Potential support ratios: Cohort versus period perspectives, Population Studies 71(2): 171–186. doi: 10/gctr2z
- Kluge, Fanny A., Joshua R. Goldstein, and Tobias C. Vogt. 2019. Transfers in an aging European Union, The Journal of the Economics of Ageing 13(C): 55. doi: 10/ggnfjj
- Kulu, Hill, Paul J. Boyle, and Gunnar Andersson. 2009. High suburban fertility: Evidence from four Northern European countries, Demographic Research 21 (31): 915–944. doi: 10/d3zsz8
- Kupiszewski, Marek (ed). 2013. International migration and the future of populations and labour in Europe. The Springer Series on Demographic Methods and Population Analysis. Springer. doi: 10.1007/978-90-481-8948-9
- Lee, Ronald. 2003. The demographic transition: Three centuries of fundamental change, Journal of Economic Perspectives 17(4): 167–190. doi: 10/dgx83v
- Lee, Ronald, Andrew Mason, and members of the NTA Network. 2014. Is low fertility really a problem? Population aging, dependency, and consumption, Science 346(6206): 229–234. doi: 10/f6jjdb
- Leonardi, Robert. 2006. Cohesion in the European Union, Regional Studies 40(2): 155–166. doi: 10/dbr59p
- Lloyd-Sherlock, Peter. 2000. Population ageing in developed and developing regions: Implications for health policy, Social Science & Medicine 51(6): 887–895. doi: 10/fq6wrj
- Loichinger, Elke, Bernhard Hammer, Alexia Prskawetz, Michael Freiberger, and Joze Sambt. 2017. Quantifying economic dependency, European Journal of Population/ Revue Européenne de Démographie 33(3): 351–380. doi: 10/gbmppr
- Lutz, Wolfgang, Warren Sanderson, and Sergei Scherbov. 2008. The coming acceleration of global population ageing, Nature 451(7179): 716–719. doi: 10/c3hv48
- Morollón, Fernando Rubiera, Victor M. González Marroquin, and José L. Pérez Rivero. 2016. Urban sprawl in Spain: Differences among cities and causes, European Planning Studies 24(1): 207–226. doi: 10/gfpnf8
- Morollón, Fernando Rubiera, Víctor M. González Marroquín, and José L. Pérez Rivero. 2017. Urban sprawl in Madrid?, Letters in Spatial and Resource Sciences 10(2): 205–214. doi: 10/ggnfjc
- Naito, Tohru, Daisuke Ikazaki, and Tatsuya Omori. 2017. Precautionary public health, ageing and urban agglomeration, Asia-Pacific Journal of Regional Science 1(2): 655–669. doi: 10/ggnfjd
- Okólski, Marek, and John Salt. 2014. Polish emigration to the UK after 2004; Why did so many come?, Central and Eastern European Migration Review 3(02): 11–37. Available: https://bit.ly/okolski-2014.
- Pagliacci, Francesco. 2017. Measuring EU urban-rural continuum through fuzzy logic, Tijdschrift Voor Economische En Sociale Geografie 108(2): 157–174. doi: 10/f92xj4
- Pittenger, Donald B. 1974. A typology of age-specific net migration rate distributions, Journal of the American Institute of Planners 40(4): 278–283. doi: 10/bn98bw
- Rees, Philip, Martin Bell, Marek Kupiszewski, Dorota Kupiszewska, Philipp Ueffing, Aude Bernard, Elin Charles-Edwards, and John Stillwell. 2017. The impact of internal migration on population redistribution: An international comparison, Population, Space and Place 23(6): e2036. doi: 10/ggnfjf
- Rees, Philip, Nicole Van Der Gaag, Joop De Beer, and Frank Heins. 2012. European regional populations: Current trends, future pathways, and policy options, European Journal of Population / Revue Européenne de Démographie 28(4): 385–416. doi: 10/f4fdnd
- Rees, Philip, Chengchao Zuo, Pia Wohland, Carol Jagger, Paul Norman, Peter Boden, and Martyna Jasinska. 2013. The implications of ageing and migration for the future population, health, labour force and households of northern England, Applied Spatial Analysis and Policy 6(2): 93–122. doi: 10/ggnfg8
- Reher, David Sven. 2004. The demographic transition revisited as a global process, Population, Space and Place 10(1): 19–41. doi: 10/b945kv
- Rogers, Andrei, James Raymer, and Frans Willekens. 2002. Capturing the age and spatial structures of migration, Environment and Planning A: Economy and Space 34(2): 341–359. doi: 10/fk4brh
- Sabater, Albert, Elspeth Graham, and Nissa Finney. 2017. The spatialities of ageing: Evidencing increasing spatial polarisation between older and younger adults in England and Wales, Demographic Research 36(25): 731–744. doi: 10/f9zbnh
- Salvati, Luca. 2016. The dark side of the crisis: Disparities in per capita income (2000–12) and the urban-rural gradient in Greece, Tijdschrift Voor Economische En Sociale Geografie 107(5): 628–641. doi: 10/f9p5jp
- Salvati, Luca, and Margherita Carlucci. 2016. Patterns of sprawl: The socioeconomic and territorial profile of dispersed urban areas in Italy, Regional Studies 50(8): 1346–1359. doi: 10/ggnfh3
- Salvati, Luca, and Margherita Carlucci. 2017. Urban growth, population, and recession: Unveiling multiple spatial patterns of demographic indicators in a Mediterranean City, Population, Space and Place 23(8): e2079. doi: 10/gckcmg
- Sanderson, Warren, and Sergei Scherbov. 2010. Remeasuring aging, Science 329(5997): 1287–1288. doi: 10/bbxfg6
- Shucksmith, Mark, Stuart Cameron, Tanya Merridew, and Florian Pichler. 2009. Urban–rural differences in quality of life across the European Union, Regional Studies 43(10): 1275–1289. doi: 10/d6s3b6
- Skirbekk, Vegard. 2008. Age and productivity potential: A new approach based on ability levels and industry-wide task demand, Population and Development Review 34: 191–207. Available: https://www.jstor.org/stable/25434764.
- Smailes, Peter, Trevor Griffin, and Neil Argent. 2014. Demographic change, differential ageing, and public policy in rural and regional Australia: A three-state case study, Geographical Research 52(3): 229–249. doi: 10/ggnfhj
- Spijker, Jeroen, and John MacInnes. 2013. Population ageing: The timebomb that isn’t?, BMJ 347: f6598. doi: 10/ggnfg7
- Striessnig, Erich, and Wolfgang Lutz. 2013. Can below-replacement fertility be desirable?, Empirica 40(3): 409–425. doi: 10/ggnfg9
- Tselios, Vassilis. 2014. Urbanization and socioeconomic status in the European regions: The role of population ageing and capital city regions, European Planning Studies 22(9): 1879–1901. doi: 10/ggnfhk
- Van Der Gaag, Nicole, and Joop De Beer. 2015. From demographic dividend to demographic burden: The impact of population ageing on economic growth in Europe, Tijdschrift Voor Economische En Sociale Geografie 106(1): 94–109. doi: 10/ggnfht
- Van Nimwegen, Nico. 2013. Population change in Europe: Turning challenges into opportunities, Genus 69(1): 103–125. doi: 10/ggnfhc
- Van Wissen, Leo. 2001. James P. Smith and Barry Edmonston (Eds.) the immigration debate: Studies on the economic, demographic and fiscal effects of immigration, European Journal of Population / Revue Européenne de Démographie 17(2): 203–205. doi: 10/btg3r7
- Vargha, Lili, Róbert Iván Gál, and Michelle O. Crosby-Nagy. 2017. Household production and consumption over the life cycle: National time transfer accounts in 14 European countries, Demographic Research 36(32): 905–944. doi: 10/f9w8sx
- Vaupel, James W., and Elke Loichinger. 2006. Redistributing work in aging Europe, Science 312(5782): 1911–1913. doi: 10/b6b5mc
- Vobecká, Jana, and Virginie Piguet. 2011. Fertility, natural growth, and migration in the Czech Republic: An urban–suburban–rural gradient analysis of long-term trends and recent reversals, Population, Space and Place 18(3): 225–240. doi: 10/b74txt
- Wolff, Manuel, and Thorsten Wiechmann. 2018. Urban growth and decline: Europe’s shrinking cities in a comparative perspective 1990–2010, European Urban and Regional Studies 25(2). doi: 10/ggbdvb
- Zeng, Yi, and James W. Vaupel. 1989. The impact of urbanization and delayed childbearing on population growth and aging in China, Population and Development Review 15(3): 425–445. doi: 10/frxg2d
Appendix A: Reference map of the NUTS-2 regions of Europe
provides a reference to help the reader navigate across the vast number of NUTS-2 regions in Europe. Please find the complete list of regions on the Eurostat website, on the page devoted to history of NUTS (Eurostat Citation2015a). The NUTS version used in in this paper is NUTS 2010. Eurostat also provides a detailed explanation of the urban–rural typology at NUTS-3 level (Eurostat Citation2017).
Figure A1 Reference map of the EU-27 NUTS-2 regions
Note: 261 regions; NUTS 2010 version Source: As for .
Appendix B: Checking the temporal dimension of the urbanization
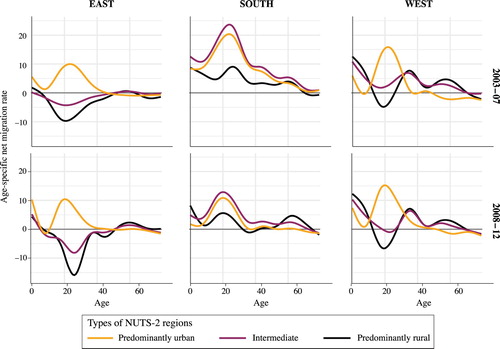
is a sensitivity check for the possible levelling off of urbanization driving migration. As we see, only in Southern Europe did the intensity of positive migration reduce slightly in the second part of the study period. However, this effect was likely driven by the economic crisis of 2008–09 and might have been a temporary shock rather than a more permanent change.
Figure A2 Age-specific total net migration rates per 1,000 population by urban–rural type of NUTS-2 regions: pooled single-year data for two subperiods, 2003–07 and 2008–12
Note: The lines are smoothed using a generalized additive model. Source: As for .
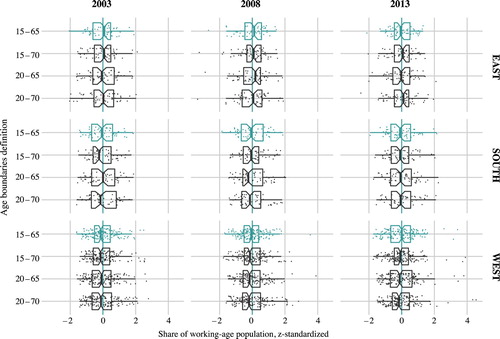
Appendix C: Sensitivity of the share of working-age population to definitions of age boundaries
The working-age population defined using the conventional age boundaries of ages 15 and 65 is gradually becoming a less and less valuable proxy for the economically active part of the population. Thus, in we carry out a sensitivity check comparing three more definitions of working-age population against the conventional definition. We test all four combinations of the lower age boundary (15 or 20) and the upper age boundary (65 or 70). Since the resulting working-age groups differ in the number of single ages they contain—45, 50, or 55 years—we perform z-standardization of the four differently defined proportions of the population that is of working age. We plot the z-standardized distributions of the share of working-age population with the alternative age boundaries for the three parts of Europe and the years 2003, 2008, and 2013. The distributions do not change substantially with a change in the age definition, which suggests that there should be no major difference in the results of the current study were we to choose an alternative definition of the working-age population. Due to the present waves in population age structures, shifting the definition of the working-age population may slightly offset the timing of the demographic transition but not reverse the relative regional differences.
Figure A3 Box plots for the z-standardized shares share of working-age population calculated using the conventional lower and upper age boundaries of 15 and 65 years (green colour or light grey in print) and three alternative definitions—age boundaries of 15–70, 20–65, and 20–70 years (dark grey): NUTS-2 regions in three parts of Europe, 2003, 2008, and 2013
Source: As for .