
Abstract
Population Studies advances research on fertility, mortality, family, migration, methods, policy, and beyond, yet it lacks a recent, rigorous review. We examine all papers published between 1947 and 2020 (N = 1,901) and their authors, using natural language processing, social network analysis, and mixed methods that combine unsupervised machine learning with qualitative coding. After providing a brief history, we map the evolution in authorship and papers towards shorter, multi-authored papers, also finding that females comprise 33.5 per cent of authorship across the period under study, with varied sex ratios across topics. Most papers examine fertility, mortality, and family, studying groups and change, but topics vary over time. Children are rarely studied, and research on women focuses on family planning, fertility decline, and unions, whereas key domains for research on men are migration, historical demography (war, famine), and employment. Research on Africa and Asia focuses on family planning, with work on fertility decline concentrated on North America and Europe, consistent with theories of demographic transition. Our resulting discussion identifies future directions for demographic research.
Introduction
For 75 years, the journal Population Studies has published work advancing our knowledge of demography and population, from substantive topics in the areas of fertility, mortality, migration, and families to innovations in theory, methods, policy, and practice. Demographic topics, theories, and methods have drawn from multiple disciplines, ranging from economics to sociology, statistics, psychology, development studies, epidemiology, and beyond. In the early 1990s, Susan Cotts Watkins asked: ‘If all we knew about women was what we read in [the journal] Demography, what would we know?’(Watkins Citation1993). At 75 years, Population Studies is one of the oldest journals of demography. Inspired by Watkins, at this auspicious anniversary we ask: If all we knew about demography over the past 75 years was what we read in Population Studies, what would we know?
Several excellent narrative reviews of this long-standing journal have reflected on the general history of demography, the journal, and its editorship (e.g. Grebenik Citation1979, Citation1996). We use this current milestone to stand back and place a mirror on three-quarters of a century of Population Studies to reveal broader trends in author and paper characteristics. We also uncover topics where there has been an abundance or dearth of substantive research. We study the authors themselves, examining differences over the past 75 years by gender, study topic, institution, and social networks. Extending Watkins’ work, we also interrogate the subjects of research and go beyond women to consider men and children as well. We likewise probe into what we know about different populations across various geographical regions of the world. Do certain topics receive disproportionate attention in, for example, Africa, Asia, Europe, or North America? How has the geographical spread of research changed, both in terms of research focus and also in the origins of authors and their institutions? By virtue of our approach, we not only chronicle demographic knowledge over time in one of the most prominent journals in the field but also place a mirror on demography itself to reveal broader key features of the past. Our work extends existing knowledge by revealing changes in publication norms over time, insights into gender equity in authorship and social networks of authors, the roles of possible preferences and focuses of editors and their boards, and exposes potential geography gaps and institutional strengths and disparities.
To achieve our goal, we adopt a ‘scientometric’ approach: a computational meta-analysis of the study of science itself, which allows a critical analysis of the research landscape. This systematic design provides empirical grounding and enriches and moves us beyond existing narrative accounts. Our approach advances knowledge in several key ways. First, we empirically scrutinize gendered and multi-authored authorship patterns, specifically relating to whether certain key substantive topics dominate and with a secondary focus on institutional and geographical concentrations or gaps in work. Second, due to our systematic approach that does not rely on personal bias or narratives, we expose unexpected gaps and research vacuums in addition to revealing hidden figures, topics, and patterns.
This relates to our third contribution, where we reveal latent biases that may have shaped our current knowledge, inadvertently generating blind spots. For instance, by curating and mapping research topics over time, we reveal areas of research that have been either over- or under-represented, potentially leading to real consequences. Within medicine, for instance, it has come to light that doctors, who are disproportionately male, studied cardiovascular disease and overlooked the very different symptoms of women, leading to deep impacts on women’s health (Banks Citation2008). We uncover how studies of certain topics, such as fertility or mortality, have focused on a particular group or unit of analysis (women, children, men), which in turn shapes our general knowledge. In demography, for instance, the primary focus on women’s fertility may have likewise led to missed opportunities to understand men’s and couples’ infertility better (Mills et al. Citation2021).
Examining the characteristics of authors, institutes, and their geographical spread also reveals the evolution of where this knowledge was produced and by whom. A growing number of studies have flagged the ‘gender gap’ and other imbalances in publications and funding (Jagsi et al. Citation2006; West et al. Citation2013; Lundine et al. Citation2018). We examine the gender gap longitudinally and extend the concept to a ‘geography gap’ in both authorship and substantive study areas. Finally, beyond a celebration of 75 years of research, our study alerts editors, funders, employers, demographers, and population centres to the general strengths and biases in the field. This can inform the planning of future investments in data collection, teaching programmes, and work on under-researched populations, as well as under-represented areas of research or researchers. Revealing gendered social network patterns and geographical disparities (i.e. gaps in certain geographical areas) in authorship and general shifts in publication norms (such as in the length of papers and co-authorship trends) is likewise useful for academic evaluation.
We first provide a description of Population Studies’ storied history and editorship over time, before introducing the data and our analytical approach. We then outline the core descriptive aspects of the data (the population of all publications and authors publishing within the journal), including the types (papers, editorials, errata, letters, notes, and reviews) and characteristics (e.g. authors, length, citation counts) of publications. We display the core topics examined, showing how these have evolved across time, and we highlight some of the most prominent papers to date. We use both an unsupervised machine-learning approach to derive the distributions of topics and a qualitatively coded and regular-expression-based analysis of topics, where regular expressions are specifically used to analyse whether papers focus on men, women, or children as subjects. We then engage in an analysis of the distributions of authors across different geographical regions and institutions across the world. Delving into authorships, we analyse contributions by gender over time, consider social network models (which are used to examine the gendered relationships among networks of authors), and create a ‘PopStudies H-Index’ (and ‘PopStudies HM-Index’) to analyse authorship contributions. We conclude by reflecting on the main findings, the strengths and weaknesses of our own approach, and the future research and policy implications of our review.
The foundation of Population Studies and its editors over time
Demography as a discipline has a long legacy in the UK, with John Graunt—often regarded as the founding father of demography—publishing what is believed to be the first life table (Natural and Political Observations Made upon the Bills of Mortality) in 1662. Oxford’s Edmond Halley famously estimated the ‘degrees of mortality of mankind’ using birth and funeral data in Breslaw (Halley Citation1693), and Cambridge’s Thomas Malthus began a seemingly never-ending debate on the principles of population (Malthus Citation1798). Likewise, the origins of what might be considered mathematical and statistical demography began with English mathematicians and actuarial scientists (Gompertz Citation1825; Makeham Citation1860), with similar and substantial contributions made by Galton, Pearson, and Fisher.
Given this illustrious legacy, it seems appropriate that the Population Investigation Committee (PIC) established Population Studies—with David Glass as the founding editor—in 1947. Glass edited the journal for 31 years until his untimely death aged 67 in 1978. The board was later enlarged by editors from outside the UK—F. W. Notestein, C. E. Quesnel, A. Sauvy, and P. C. Mahalanobis—although only Notestein took an active role at the journal (Grebenik Citation1996).
As described by Grebenik (Citation1979, Citation1996), in his earlier years Glass was a research assistant of Sir William Beveridge and then the director of the London School of Economics and Political Science (LSE). Glass’s broad interests were originally in the area of family life—with a focus on family size, divorce, and marital fertility—and would go on to shape the journal. In the late 1930s, he worked with biologists in the area of population genetics (as did many at that time) and on its relationships with fertility, selection, and social mobility. The 1930s was a period of fertility decline in Great Britain, causing considerable concern and forcing policymakers to recognize the urgent need for demographic research. In 1935, the PIC was formed, with a readership in demography established at LSE in 1938. Like many demographers, Glass straddled multiple disciplines. Some readers may relate to the committee’s reasoning for first rejecting Glass’s application to become a research secretary at the PIC: ‘I have not been able to trace the subsequent career of this individual, but it did not lie within the field of either demography or the social sciences’ (Grebenik Citation1979). This position afforded him freedom from all teaching and administrative duties, and it was noted in his obituary that he worked long hours with his days spent in libraries and nights spent writing and harvesting an encyclopaedic knowledge of demography.
After working in wartime employment in the United States (US), Glass returned to the UK in 1945, where he became a professor of sociology at LSE in 1948 until his death. Among his many accomplishments, he directed the Family Census of 1946, which covered 10 per cent of all married women in Great Britain (1.25 million), and was the UK delegate of the Population Commission at the United Nations (UN). Being fluent in French and German, Glass noted that there was only one other periodical devoted to demography: the French journal Population, started in 1946 by the French Institut national d’études démographiques (INED). As a response in 1947, he instigated Population Studies, negotiating an agreement with Cambridge University Press. Although it was suggested that a more appropriate name was the British Journal of Demography, Glass insisted that it take a broader international view, hence the more expansive title (Grebenik Citation1996). Although his personal research focused largely on contemporary Britain, Glass stimulated research and teaching in Africa, Asia, and Latin America, particularly within his UN activities, with a strong and comprehensive interest in historical demography (a focus which remained a prominent feature of the journal even after the emergence of other outlets). At the time, Population Studies was the only English language journal devoted exclusively to demography. There was also Population Index published by the Office of Population Research at Princeton University, but that was seen as more bibliographic and methodological. As a benefit of membership of the International Union for the Scientific Study of Population (IUSSP), members received all three of these publications (Population, Population Index, and Population Studies).
In 1964, the journal Demography was established as the official journal of the Population Association of America, with one issue per year until the late 1960s, followed by biannual publication. We suggest (perhaps controversially) that Demography, like Population Studies, has been inclined to publish formal macro-demography, but also considers statistical and econometric approaches to individual-level data. Other related journals were instigated over time (e.g. Population and Development Review in 1975 and Demographic Research in 1999), with similar editorial priorities but their own individual strategies. Thus, for almost two decades from 1946 until the mid-1960s, Population Studies was the only demography journal published in the English language. Eugene Grebenik became a joint editor with Glass in 1954, taking over as research secretary of the PIC. After Glass’s death, associate editors John Hobcraft and Roger Schofield also joined (Grebenik Citation1996). Grebenik—known as Grebby—was an editor for an incredible 42 years from 1954 until 1996 (Grebenik Citation1996; Hobcraft Citation1996), also holding other key roles such as secretary general and treasurer of the IUSSP for more than a decade.
John Simons took on the editorship after retiring from his post as head of the Centre for Population Studies at the London School of Hygiene and Tropical Medicine (LSHTM). He edited the journal for 20 years, from 1996 to 2016, which would have seemed a long time in the post had it not been preceded by Grebenik’s even longer tenure. Indeed, in Grebenik’s outgoing letter welcoming the new editor, he noted: ‘Unless demographic forecasts of mortality are completely wrong, it seems unlikely that their term of office will be as long as mine has turned out to be’ (Grebenik Citation1996, p. 304). A significant achievement during Simons’ editorship was a successful application for a government grant to cover the cost of retro-digitizing back issues, which meant that online access to these issues could be included as part of a subscription package. Simons’ period also brought considerable changes in the technology and financial management of the journal, moving from the paper handling of manuscripts to an online system, accompanied by a change in publisher to Taylor & Francis in 2002 (Timæus Citation2016). The change to a commercial publisher was the result of the editors wanting an online version, and it was apparent that this could only realistically come about via a commercial publisher; this changeover was negotiated by the editorial office (a few months after Anne Shepherd took charge) in conjunction with the editors. It was only from 2002 that—for the first time—the journal used experts from outside the editorial board to act as reviewers. Simons also made other changes, including introducing a larger and more international editorial board and moving from the rule that only individuals who could attend editorial meetings in person in London were on the board (Timæus Citation2016). Like his predecessors, he personally read and edited papers for content, accuracy, and writing style.
In 2017, John Ermisch from the Leverhulme Centre for Demographic Science at the University of Oxford took over as editor-in-chief, a position which he holds at the point of this 75-year reflection. With a background in economics, his work and interests span the economics of the family, intergenerational transfers, household formation, and housing economics. A change that occurred when Ermisch took over from Simons was a division of labour that saw the transfer of the language editing function to a trained and experienced demographer, leaving the editor free to deal with executive editorial functions. At its 75-year anniversary, the editorial board includes Francesco Billari, John Cleland, Andrew Foster, Hill Kulu, John McDonald, Tom Moultrie, Mikko Myrsklä, James Raymer, Ronald Skeldon, Alice Reid, and Wendy Sigle. In 2021, Alyson van Raalte and Brienna Perelli-Harris joined the editorial board, which goes a little further towards redressing the bias towards male editors. Population Studies has also had many hidden figures, ensuring the continued operation of the journal. Incredibly, Doreen Castle ran the administration and finances of the journal for 45 years from 1951 to 1996, followed later by Betty Cohen. Anne Shepherd, who provided us with considerable background information for this review, arrived in 2001 in conjunction with the shift to the online processes and remains the sole member of staff running the editorial office together with the editor. Following this long line of stability and continuity, Shepherd remains in this position after 20 years. The fact that a demographer (Julie Banton) acts as a dedicated copyeditor has been a unique and grand asset.
Data and analytical methods
Data
The data used in this review consist of all papers published in the journal Population Studies from its inception in January 1947 through to September 2020. We describe the details of our approach and analyses in a more technical manner in our accompanying code library (Mills and Rahal Citation2021). We extend our previously developed approaches, which were designed to examine molecular genetic discoveries in the area of genome-wide association studies (GWAS) (Mills and Rahal Citation2019, Citation2020). To catalogue the key characteristics of each paper (e.g. abstract; authorship information), we developed custom modules that scraped data from four Scopus Application Programming Interfaces (APIs), namely the Scopus Search, Abstract Retrieval, PlumX Metrics, and Author Retrieval APIs. APIs are a tool for connecting computer programmes or computers to an interface or service, used most typically in an academic context to retrieve data.
In contrast to bibliometrics—a broader term that refers to the use of statistical methods to analyse publications—scientometrics is concerned with the quantitative features and characteristics of scientific research itself. Our approach allowed us to isolate each paper by what is referred to as a Digital Object Identifier (DOI). We first queried the Scopus Search API with the journal’s International Standard Serial Number (ISSN), which is 0032-4728. This provided us with a list of DOIs, which we then used to gather additional information on each individual paper. The data were obtained under the Academic Research Use Policy of Scopus. The creation of both unique author and affiliation profiles (to circumvent the ‘many names’ problem) was a largely automated process, although content processing was also undertaken by hand by the Elsevier Developer team. The total number of papers in the database was 1,901 of which all but one were linked to authors. Of the papers with author information, 90.2 per cent contained an abstract (for 185 papers, no abstract was returned by the API). Examining the papers by type, we see that the majority (1,858) were academic papers, followed by errata (19), reviews (11), editorials (5), notes (6), and letters (2). The total number of ‘authorships’ (the number of contributions by all authors to all academic outputs, where there can be multiple authors per individual output) was 3,267, with 2,027 unique authors.
Analytical methods
The analysis was conducted using Python 3.8, a high-level, general-purpose programming language. To call the Scopus APIs and generate the data sets just described, we implemented a custom scraping module based on Requests: HTTP for Humans 3.1 (v. 2.25.1). To undertake network analysis, we used NetworkX (v. 2.5), with network visualizations undertaken in PyGraphviz (a Python interface to the Graphviz graph layout and visualization package, v. 1.6) using the Neato algorithm (North Citation2004). All visualizations were made with Matplotlib (v. 3.3.3), Seaborn (v. 0.11.1), and GeoPandas (v. 0.8.0). To infer the gender of authors, we used both the Gender Guesser (v. 0.4.0, based on the gender.c files by Michael Jörg) and Gender Detector (v. 0.1.0, based on the Open Gender Tracker’s Global Name Data) libraries, with supplementary calls made to genderize.io in order to fill in as many uncertainties as possible (although 67 remained). An important caveat is that this inferred gender does not necessarily reflect an author’s self-identified gender, as results merely represent a probabilistic approach based on large caches of administrative data. Our unsupervised Latent Dirichlet Allocation (LDA) algorithm for automated topic modelling was based on a Python wrapper to MALLET. We created an original list of stop words (e.g. ‘the’, ‘a’, ‘is’, and ‘are’) building on that provided by the Natural Language Toolkit (v. 3.5), from which we also used a default sentence tokenizer (PunktSentenceTokenizer, used for turning text into separate ‘tokens’ for analysis), which itself is an implementation of unsupervised Multilingual Sentence Boundary Detection (Kiss and Strunk Citation2006).
Similar to Mills and Rahal (Citation2019) where we created a ‘GWAS H-Index’, we also created a PopStudies H-Index based on the classical metric of the H-Index proposed by Jorge Hirsch (Hirsch Citation2005), which in this case can be defined as the maximum value of h such that a given author has published h papers within Population Studies that have each been cited at least h times. We also developed a PopStudies HM-Index: a modification based on Schreiber (Citation2008), which takes co-authorship into account via fractional counting. This provides a remedy for problems related to the unmodified H-Index (notably that a sole-authored paper may not equate to the same output per author as one with 100 authors).
We verified key aspects of our automated machine-learning approach with a mixed-methods qualitative approach. We parsed the entire list of abstracts by hand to generate a multitude of qualitatively coded fields such as ‘topic’, which were checked and coded by separate coders (our classifications are defined later in ). Some papers subjectively fit into multiple topics, although our approach was generally judicious and conservative. This is observable through the annotations in , where three of the five most cited papers fit into multiple combinations of subtopics from Topic 2 (Mortality) and Topic 4 (Macro-level), for example ‘Mortality and Income’ or ‘Mortality and Economic growth’. Disaggregated analysis of the topics (i.e. one observation per classification, with potentially multiple topics or rows of data per DOI) is the de facto norm throughout (as in and , later), other than in (b) where a ‘Multiple’ classification is required. Topics 5 (Methods) and 7 (Other) have no subtopics. We do acknowledge the subjective nature of our topic categories, such as the inclusion of the Historical subtopic (4c) into the Macro-level topic. This is not meant to imply that all historical papers are purely focused on aggregate macro-level data, but many papers using archival (and potentially micro-level) sources intend to provide results for a specific time period in an internationally comparative perspective. Similar arguments can be made regarding the Socio-economic status subtopic, which was again partly motivated by our need for a judicious grouping of topics, and is complemented by using objective LDA-based topic modelling as a counterpart. During this process, we also collected additional supplementary information where available, for example information on the data sets used, the populations studied, and the time period of interest. The results of this painstaking curation and our library of functions for scraping, parsing, analysing, and visualizing are made freely available on GitHub and Zenodo (Mills and Rahal Citation2021), providing additional details and an accompanying ‘requirements.txt’ file that takes care of package management.
Table 1 Disaggregation of Population Studies papers classified by hand into topic and sex of authorship
Results
General trends in publication metadata
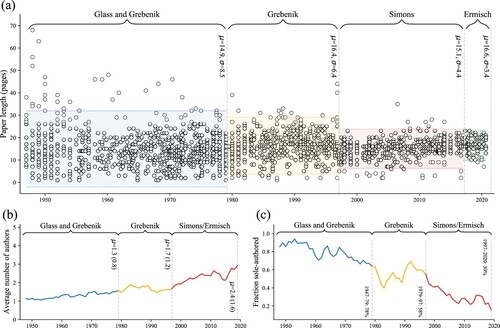
charts general trends in publication metadata over time, separately identifying the four editorial reigns just discussed. (a) shows the shift in the variance of the length of papers over time. The mean length of papers over the entire period was 15.4 pages (with a standard deviation of 7.0), and the longest single paper was a hefty 68 pages. The average number of references per paper was 24.8, with the largest number of references found in Hobcraft’s Citation2006 paper on the ‘ABC of demographic behaviour’, with 311 references (Hobcraft Citation2006). To date, 52 papers have been Open Access (of any kind), with the proportion increasing from 18.2 per cent of papers published in 2016–33.3 per cent in 2018 and then rapidly increasing to an astounding 46.2 per cent of papers in 2020. (a) also shows how publication norms in demography—likely reflected across the wider social sciences—have changed, by graphing the rise in the number of the authors per paper (1(b)) and a sharp decline in sole-authored papers (1(c)). (b) alludes to the emergence of some large multi-authored collaborations, with as many as 18 authors appearing on one single paper (Nabukalu et al. Citation2020): a multi-author collaborative approach common in the natural sciences and other large data collection and analysis efforts. Interestingly, over time, titles became longer, too; the mean title length in the first 37 years was 65.3 characters, compared with 85.4 in the second.
Figure 1 Shifts in characteristics and authorship of Population Studies papers, 1947–2020, by editorship: (a) paper length; (b) number of authors; and (c) sole authorship
Notes: Panel (a) shows that while the variance in paper length substantially reduces over time (from 8.5 during Glass and Grebenik’s tenure to 3.4 during Ermisch’s current tenure), the mean paper length stays approximately the same (15.4 all period). Panel (b) shows the increasing average number of authors per published paper on a yearly basis using a three-year rolling window. Panel (c) shows the decreasing percentage of sole-authored papers over time, measured as a percentage of all papers published per year. Colours indicate different editorships. The first editorial reign represents both Glass and then Glass and Grebenik jointly. Source: Authors’ analysis of Population Studies papers from January 1947 to September 2020.
Topics of research
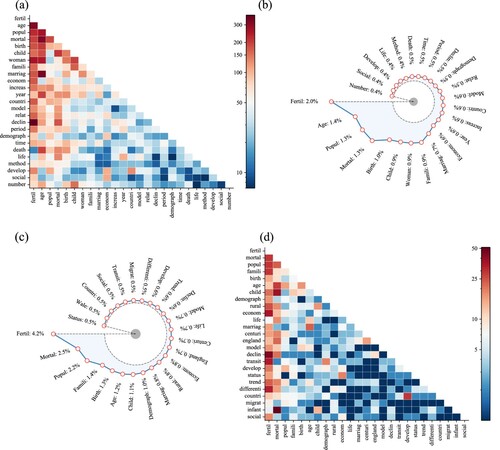
We next examined the main substantive topics of research over the period by engaging in a content analysis of substantive words in the titles and abstracts. shows heatmaps of word co-occurrence in abstracts and titles ((a) and (d), respectively) and radar plots illustrating the frequencies of individual words in the abstracts and titles ((b) and (c), respectively). We see that in terms of substantive topics, the core area of study has clearly been fertility, followed by mortality, family, marriage, and migration, none of which may seem surprising given the strategic priorities of the journal. The most frequent words refer to the study of specific groups (population, women, rural, England, children, family), concepts and measures of time (age, year, period), and measures of change in demographic events (decline, trend, differentiate, transition, change, rate, increase, differ, develop). Turning to co-occurrence, we see that fertility has most often been studied in relation to fertility decline, differentials, trends, and age at fertility. Mortality has been examined most often in relation to infant mortality, child mortality, mortality estimates, age at mortality, and mortality decline. Marriage has been examined primarily in the context of age at marriage and in relation to fertility.
Figure 2 Frequency of substantive words: (a) co-occurrence frequencies in abstracts; (b) individual frequencies in abstracts; (c) individual frequencies in titles; and (d) co-occurrence frequencies in titles
Notes: The heatmap in panel (a) shows the co-occurrence of the 25 most frequently co-occurring terms in paper abstracts, while the radar plot in panel (b) shows the 25 most frequently individually occurring terms in paper abstracts. The radar plot in panel (c) shows the 25 most frequently individually occurring terms in paper titles, and the heatmap in panel (d) shows the co-occurrence of the 25 most frequently co-occurring terms in paper titles. Words shown are lemmatized frequencies. Source: As for .
Keywords were only introduced in 2003, and therefore our keyword analysis (not vizualised) is based on only 398 papers (and a total of 2,591 keywords). The results generally concur with the findings from our title and abstract analysis, with the top 10 most frequently observed keywords being fertility (83), mortality (46), education (25), China (23), marriage (23), historical demography (22), migration (19), infant mortality (18), life expectancy (17), and ageing (16). This word frequency approach helped to inform our qualitatively coded topics, which together with knowledge of the field helped us to shape and divide the analysis further into distinct subfields. uses swarm and scatter plots to map the distribution of topics (based on a manual classification of topic from abstracts) over time. Here we divided the topics into seven distinct groups (as shown in later): (1) Fertility (e.g. birth, contraceptive, pregnancy, reproduction); (2) Mortality (e.g. death, longevity, survival); (3) Migration (e.g. immigration, urbanization); (4) Macro-level topics (e.g. development, market, historical, economic); (5) Methods and formal demography (e.g. distribution, linear, statistical, simulation, methodological); (6) Family (e.g. marriage, family, household, divorce, cohabitation); and (7) Other (e.g. labour, employment, religious, housing, industrial).
Figure 3 Distribution of topics over time in individual Population Studies papers, 1947–2020: (a) by topic group; (b) by citation count and topic group
Notes: Panel (a) contains seven swarm plots showing the timing and topic of each individual paper between 1947 and 2020, grouped into the seven specific broader topics as described in Table 1. Panel (b) groups this information into one subfigure as a scatter plot, incorporating a new category for ‘Multiple’ topics. Note that a paper can fall into more than one category. The size of the circles represents the number of citations. Papers which are returned from the API without abstracts are unable to be classified and therefore do not feature in the figure. Source: As for .
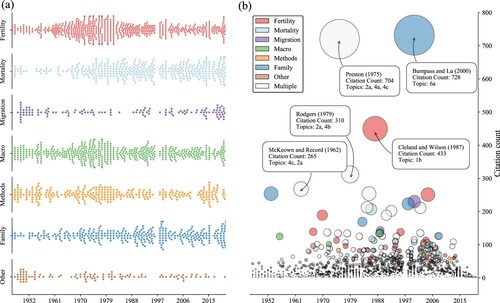
In (a), we see that in the early years of the journal, the focus was largely on Macro-level factors, Methods, and ‘Other’ topics. Particularly Fertility but also Macro-level topics and Methods have been a constant throughout the life of the journal. Mortality and Family topics were examined less in the earlier years but have grown in focus since the 1970s. Migration was a more frequent topic of study in the late 1940s and then re-emerged from 2017 onwards, but—due to many specialized journals emerging in the area of migration research—the topic remains one of the least covered topics in this more general-interest journal, which again may speak to the journal’s historical priorities in terms of what to cover. Migration was not considered a particularly important topic of the journal for quite a large part of its history, but this changed when Robert (Bob) Woods joined as an editor, and the journal now has a specialist migration expert on board. As with Migration, all topics over time reflected the interests not just of the editor-in-chief but also the balance of the editorial board more broadly. Other journals, too, have played a key role: due to their own differences in priorities, Population and Development Review and Demographic Research attracted papers which, in their absence, would potentially have gone on to be published in Population Studies. A formal comparison of the intricacies of each journal for individual papers would likely have implications for the results presented here but remains outside the scope of our analysis.
(b) illustrates the papers by their citation counts and across topics. We see that the two most cited papers are Bumpass and Lu’s (Citation2000) paper on cohabitation and implications for children in the US and Preston’s (Citation1975) classic paper on the changing relationship between mortality and economic development. This is followed by Cleland and Wilson’s (Citation1987) piece on demand theories of fertility transition, Rodgers’ (Citation1979) international comparative analysis of income and inequality as determinants of mortality, and McKeown and Record’s (Citation1962) exploration of reasons for the decline in mortality in England and Wales during the nineteenth century. The mean number of citations per paper was 22.4, although 189 papers remain uncited. While it is naturally regrettable that these papers are uncited (at least as tracked by our data provider), we make a brief qualification here: a large proportion of these uncited papers were published in 2020 (almost 70 per cent of the papers published in 2020 at the time of writing remain uncited), and other citing papers may be presently working their way through the peer review process. However, these citation counts may also omit papers in earlier years that are not indexed by our data provider (although a cursory analysis indicates that this is not necessarily the case). While formal quantification is outside the scope of this paper, an exploratory analysis indicated that the proportion of Population Studies papers remaining uncited was higher than in Demography but lower than in Population and Development Review and Demographic Research. Perhaps most interesting is that there is a disproportionately large number of uncited papers (around 22 per cent) within our Topic 7 (Other) mapping, which perhaps has implications for editorial strategy with regards to core domains and research themes. also highlights the fact that papers frequently address multiple interwoven topics within our qualitative schema.
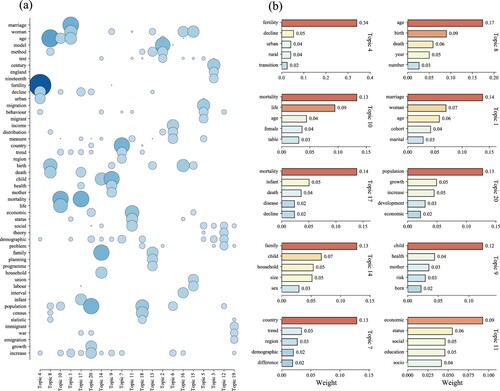
shows the results of our automated machine-learning topic modelling approach (based on abstracts) using MALLET. Note that these refer to automatically generated topics which, while overlapping in part, are separate to those manually determined in other parts of the paper. It shows a number of intuitive words automatically grouped together into 20 topics, ordered by topic importance. For example, this Topic 4 groups ‘fertility’ and ‘decline’ together, as they are often related to the first and second demographic transitions, both historically in Europe and in other parts of the world. Topic 10 groups ‘mortality’, ‘life’ and ‘table’ together, indicating a general topic related to the analysis of life expectancy and mortality via life tables. Topic 1 clearly pertains to marriage and Topic 20 to economic and population development (‘population’, ‘growth’, ‘increase’, ‘development’, ‘economic’). We also see the emergence of some more granular topics: Topic 17, for example, specifically refers to infant mortality, and Topic 13 pertains to fertility but with a specific focus on family planning and contraception. We also observe a ‘socio-economic status’ themed topic (Topic 11). In general, and despite not being determined a priori, all the topics that emerged from our LDA analysis are broadly accounted for within the seven qualitatively coded topic groupings.
Figure 4 Visualization of LDA analysis of automated topic modelling: (a) most highly weighted words by topic; and (b) words most highly associated with the most highly weighted topics
Notes: Panel (a) shows the most highly weighted words across topics, ordered by topic importance. The size of the circles represents the weighting of the word within that topic. Panel (b) shows the 10 most highly weighted topics and indicates the five words most highly associated with each topic. Source: As for .
If all we knew about women, men, and children was what we read in Population Studies, what would we know?
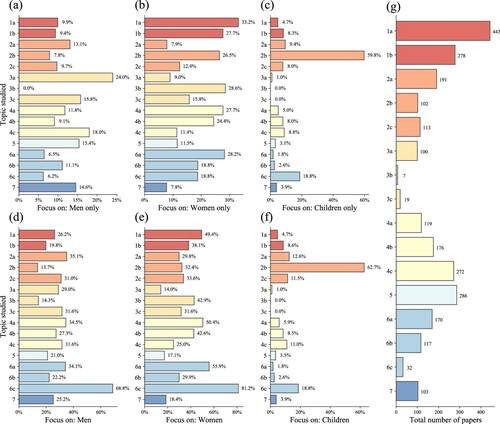
We then explored which topics focused on specific demographic groups only, using a regular-expression-based analysis. As shown in , we examined whether papers on specific topics considered (a) exclusively men (and not women or children); (b) women but not men or children; (c) children but not men or women; (d) men and potentially also women and children; (e) women and potentially also men and children; and (f) children and potentially also men and women. (g) shows the distribution across all of our manually curated topics. We see that Fertility was the most studied topic, yet it remains largely a study of women, particularly for subtopics 1a (Family planning and contraception) and 1b (Fertility trends and declines). Children have been examined less often and emerge as studied largely in relation to Infant mortality (subtopic 2b), a domain also more prominent for the study of women than for men, and to Sex preference for children (6c). The study of women has also dominated beyond fertility in the examination of Marriage, unions, and divorce (6a) and analysis of Economic development and growth, including for education (4a), and Socio-economic status and income (4b). The topics where men have been the focus of examination more so than women include General migration (3a), Historical demography (including war and famine; 4c), and our catch-all ‘Other’ category (Topic 7, which includes topics related to employment and labour markets).
Figure 5 Research focus of Population Studies papers, 1947–2020, on men, women, and children, by (sub)topic
Notes: Panels (a)–(c) show the percentage of all papers which exclusively mention either ‘men’, ‘women’, or ‘children’ (and neither of the other two conjoint terms) in the abstract, while panels (d)–(f) show the percentage of all papers which (non-exclusively) mention either ‘men’, ‘women’, and ‘children’ (potentially in combination with the other terms). Panel (g) shows the total distribution of papers across all (sub)topics. Colours group (sub)topics into broader topics. See Table 1 for the list of (sub)topics. Source: As for .
Geographical concentration and gaps in subject matter
As part of our qualitative coding carried out by hand, we were also able to extract (from abstracts alone) information on the geographical concentration of data used for 70.5 per cent of the papers in our database to identify geography gaps and concentrations. By cross-tabulating this information with subtopics studied, we found, for example, that the largest number of studies used European data (468). Studies using data on African and Asian populations were twice as likely to be used to study subtopic 1a (Family planning and contraception) than subtopic 1b (Fertility trends and declines), suggesting a geography gap in the latter. Research using European data was substantially more likely to be concentrated on subtopic 4c (Historical: war, famine, and the first demographic transition), and we attribute this to the rich availability of historical data and expertise in this geographical area (and in particular, the use of historical demographic data—such as from parish registers—available in England and Wales). Interestingly, papers which used information from multiple continents were relatively evenly split across all topics.
Authorship by gender
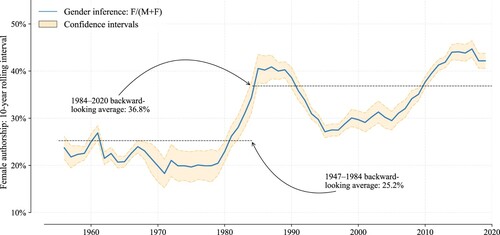
We next examined authorship by gender. We initially began with an analysis of males and females in all authorships over time, as shown in . We used three common sources to determine the gender of each author (Gender Guesser, Gender Detector, and genderize.io as described in the ‘Analytical methods’ subsection) and 10-year retrospective rolling windows. We then estimated the all-time percentage of women’s authorship in all Population Studies papers at around 33.5 per cent. However, this mean figure masks substantial gains made towards gender parity in authorship in more recent years. For example, we estimated that for the initial 37-year period of our analysis, women’s authorship stood at 25.2 per cent. However, for the later 37-year period, this increased to 36.8 per cent, potentially rising to near parity at 44.7 per cent in 2017 (for our 10-year rolling metric, but was as high as 48.3 per cent for the single year 2017). This figure roughly aligns with the broad estimate made by West et al. (Citation2013), who found, using a method similar to ours (and JSTOR, a large digital library of digitized back issues of academic journals), that around 41.9 per cent of authorship over the entire period 2000–11 was by women. This does, however, indicate that Population Studies as a journal has seen a lower proportion of female authors in comparison to the broader field of demography as indexed by JSTOR.
Figure 6 Percentage of Population Studies authors who are female, 1957–2020
Notes: The percentage of female authors over time is measured in retrospective 10-year rolling windows (starting at 1 January 1957 and analysing the previous 10 years of citations). The estimate is constructed through a combination of Gender Guesser, Gender Detector, and genderize.io. Confidence intervals represent ±50 per cent of the number of names of ‘unknown’ sex at any given point in the rolling window. Source: As for .
Similar to West et al. (Citation2013), we decomposed our analysis of authorship by gender across subtopics of interest, as shown in (albeit with topics different to JSTOR: e.g. we have no ‘French-language demography’ section). We see an authorship sex ratio (males to females) over the value of one for all of our subtopics, albeit parity is close in subtopic 6c (Family planning and sex preference) where recent papers in Population Studies by female authors include Attane (Citation2009), Mills and Begall (Citation2010), and Kashyap (Citation2019). Indeed, the sex ratio closest to parity is seen for Topic 6 at its broader hierarchical grouping (Family demography), with 1.30 males per female. In terms of the most male-dominated area, we see an authorship sex ratio of 3.35 in Topic 5 (Methods and formal demography). Comparing across the major topics of Fertility and Mortality in comparison to West et al. (Citation2013), our estimates are substantially higher for Fertility (2.08 compared with 1.39), but substantially lower for Mortality (1.70 compared with 2.86).
Social networks of authorship
To understand whether authors’ gender, subject, and geographical clustering were related to collaboration and power structures, we examined the co-authorship networks of collaborating authors. (a) illustrates the entire network of all co-authorship ‘edges’ (i.e. author-to-author links), including sole authors who have never collaborated with other authors in papers published in Population Studies. Of all the unique authors (‘nodes’) in our network, 510 are isolates (i.e. ‘lone wolf’ sole authors), which we know were particularly prominent in the past; this contrasts with the increasing trend towards papers authored by multiple contributors. In total, there are 2,317 edges, and the overall density of the entire network (the potential connections in a network that are actual connections) is 0.00113. There are 926 edges in the ‘giant component’ (the largest connected component, which contains the highest fraction of all nodes relative to every other connected component within a network), connecting 433 nodes (authors). While we note that formal comparisons of this network to those of other related journals could further illuminate specificities and nuances within Population Studies (temporarily leaving this for further research), we do speculate that the giant component contains a perhaps surprisingly large proportion of the journal’s most prolific contributors.
Figure 7 Subcomponents of the network of Population Studies authors, 1947–2020: (a) entire network; (b) giant component; and (c) second largest subcomponent
Notes: Panel (a) shows the entire network of Population Studies authorships, coloured by the number of authors (nodes) in the subcomponent. Panel (b) shows the giant component, and panel (c) shows the second largest subcomponent of the network. Nodes in panels (b) and (c) are coloured by our composite gender metric and sized according to their degree centrality. Visualizations are conducted using the Neato algorithm (North Citation2004). Source: As for .
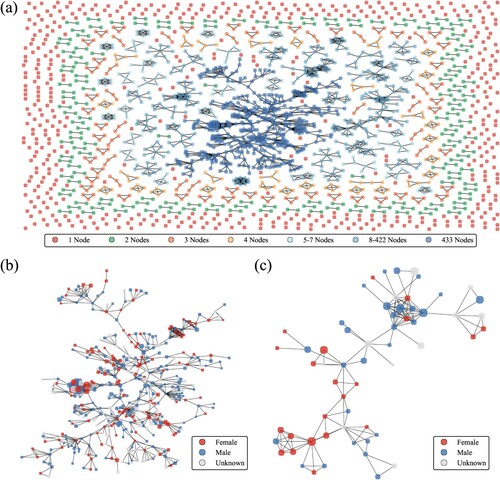
Panels (b) and (c) in show the two largest subcomponents of the network, with nodes coloured by gender (those of unknown gender arise, in the most part, because an initial was registered in lieu of a full forename). The size of nodes represents the degree centrality of each individual. Highly central authors include Basia Zaba (28 links; co-author on Nabukalu et al. Citation2020), a now deceased professor of medical demography at LSHTM who worked on demographic estimation and HIV surveillance; Milly Marston (23 links; co-author on Nabukalu et al. Citation2020), also at LSHTM, with expertise in HIV and epidemics and working predominantly in Eastern and Southern Africa; and Robert G. Potter (19 links, not an author on Nabukalu et al. Citation2020) from Brown University, who worked in fertility, biology, and behaviour and co-authored the classic book on the topic with John Bongaarts. We note that the paper with the largest number of authors—Nabukalu et al. (Citation2020)—forms part of the giant component. A cursory analysis shows no significant systematic bias in the formation of gender-based co-authorship cliques, although we leave more formal quadratic assignment procedure (QAP)-based tests for gender-based co-authorship and interconnectedness across (sub)topics for further research (Hubert and Schultz Citation1976; Krackhardt and Stern Citation1988).
International trends in authorship
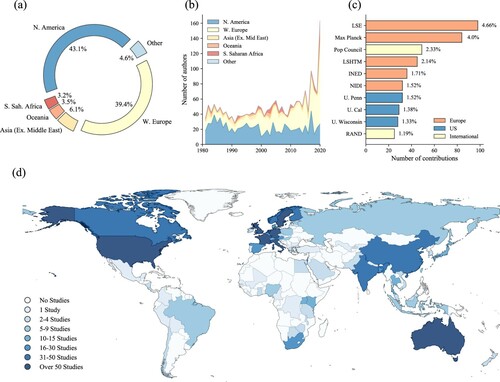
Demography has always been a global discipline, as evident from the inception of the journal and the characteristics of the early editorial team of Population Studies. To map the field, we next examined the geographical spread of authors conducting the research, beginning in 1980 (the point in time from when authorship information began to be indexed more thoroughly). Perhaps unsurprisingly, we see in (a,b) that an overwhelming majority of research was conducted within North America (43.1 per cent) and Western Europe (39.4 per cent), with the gradual increment of new countries and institutional affiliations being associated with contributing authors. The small number of authors publishing from institutions in Asia may be considered surprising, given that Asia contains the majority of the world’s population. We see a slight jump around the turn of the century, which may be attributed to multiple causes, such as shifts in global demography conferences and initiatives, international data collection efforts, and other social and technological factors. We note that the institution associated with the largest number of contributions (4.7 per cent: almost one in 20 contributions) is LSE ((c)), again perhaps unsurprisingly, given that the PIC and the journal have been housed at LSE almost since the end of the Second World War. Other prominent European institutions feature, as expected, in the form of the Max Planck Institute for Demographic Research (4.0 per cent), INED (1.7 per cent), and the Netherlands Interdisciplinary Demographic Institute (1.5 per cent). Global policy organizations, such as the Population Council and the RAND Corporation, also feature towards the top of the list. While 935 authorship contributions in our data set emanate from the US, 73 countries have seen at least one authorship contribution ((d)), including papers from institutions within some of the world’s lowest income countries, such as the Democratic Republic of the Congo (Bertrand et al. Citation1983), Liberia (Rumford and Greene Citation1979), and Mali (Hertrich et al. Citation2020).
Figure 8 The international distribution of Population Studies authorships, 1947–2020: (a) by geographical region; (b) by number of authors and geographical region over time; (c) by institution; and (d) by country
Notes: In panels (a) and (b), ‘S. Sah Africa’ refers to sub-Saharan Africa, and Asia excludes the Middle East. Panel (c) lists the institutions which contribute the greatest number of individual authorships (‘U.’ refers to ‘University of’). Panel (d) shows a choropleth map with colours corresponding to the number of authorship contributions made across all countries of the world. Source: As for .
Top authors in Population Studies
We also engaged in a review of the most prolific authors across the journal over time, ranked according to their PopStudies H-Index (with any ties settled by their HM-Index). displays names that may be familiar to some readers, for example John C. (Jack) Caldwell, a leading demographer in fertility and health transitions, and Michael J. (Mike) Murphy (of LSE since 1980), whose research has spanned multiple topics ranging from fertility and ageing to mortality, migration, and intergenerational behaviour. Samuel (Sam) H. Preston—co-author of the adored textbook entitled Demography: Measuring and Modeling Population Processes (Preston et al. Citation2000)—ranks second after John C. Caldwell in terms of citation counts, a number bolstered by the paper highlighted in . Given the gender disparities over time discussed earlier, we do not find any female authors with a PopStudies H-Index greater than or equal to eight. Notable female authors publishing in this journal include Gigi Santow, Ulla M. Larsen, and Kathleen (Kath) Kiernan. Being previously unaware of the work of Lolagene Coombs, we corresponded with Paula Fomby (of the Population Studies Centre at the University of Michigan) and discovered that this path-breaking figure was first a graduate student and then a faculty member in demography. David Lam, director of the Institute for Social Research and professor of economics at the University of Michigan wrote: ‘I took over her office when I arrived as an assistant professor in 1983 and she had just retired. She was very prolific’ (Lam Citation2020).
Table 2 Ranking of authors with a PopStudies H-Index equal to eight or higher, and selected others
Conclusion and discussion
For the past 75 years, demography has revealed itself as a highly interdisciplinary area of research, with researchers emanating from multiple disciplines including sociology, economics, statistics, anthropology, public health, biology, and epidemiology. The future seems likely to be a return to the past in many ways, with scientists imitating the first Population Studies editor David Glass, who embraced and advanced knowledge across multiple disciplines and approaches. It likely also means moving from theorizing about bio-demographical approaches (e.g. Hobcraft’s (Citation2006) classic Population Studies paper) towards empirical inclusion across topics such as mortality (Vaupel Citation1998) and fertility (Kohler et al. Citation1999; Barban et al. Citation2016; Mills et al. Citation2020). We anticipate an increase in interdisciplinary approaches, such as those empirically infusing biology and genetics, as researchers accumulate the necessary skills to accompany recent advances in data availability (Mills and Tropf Citation2020).
The world has also changed dramatically over this period. Restatements of Malthusian theories in terms of a ‘population bomb’ might not have come to pass, but debates regarding Malthus in light of climate change (whether global population levels should be actively reduced to mitigate global warming) endure. In terms of migration, contemporary issues of population displacement and resettlement continue to be widely debated, just as they were in the post-war period in which the journal was launched. We have illustrated how the very nature of authorship has evolved over time: papers have become shorter, with more authors and larger teams of scientists. Given that the majority of research has been quantitative, we organized our theory and understanding around the division of groups (e.g. women, rural), measures of time (e.g. age, year, cohort), and changes (e.g. decline, trend, increase).
The early years of the journal focused largely on macro-level factors and fertility, with methods and other topics flourishing from the early 1960s to the 1980s. Mortality and family demography emerged in the 1970s, with migration experiencing waves of interest in the 1940s and re-emerging from 2017 onwards. Our topic modelling logically grouped key topics, for example Fertility with ‘Decline and the demographic transition’ or ‘Family planning and contraception’. Standing back to examine how women, men, and children have been studied in the journal raises some important questions and reaffirms biases and gaps in research. Children remain under-examined in this specific discipline, and when they are studied, it is largely in the domain of infant mortality or parents’ sex preferences for their children and is often only linked to women and mothers. The effects of parental divorce on childhood development, for example, have been widely studied in the sociological literature, but may warrant specific demographic study, too. This alludes to the broader observation that children are not necessarily under-studied in other journals or disciplines.
If an alien were to land on earth and be given an issue of Population Studies to read in order to learn about women, they would learn that women are central in family planning and contraception, and the only sex implicated in fertility trends and decline, marriage, union formation and divorce, education, and broader economic development and growth. We do note that standard measures of fertility, such as the Total Fertility Rate (TFR), refer to women, and this has led to data being collected primarily on women, echoing many of Watkins’ (Citation1993) observations about women in Demography. If our interplanetary visitor wanted to understand how the human species procreated, they might conclude it to be almost exclusively the task and responsibility of women (although we recognize that the characteristics and preferences of their partners are often explicitly included in analysis when moving beyond simple description), whereas it would seem that men migrated and historically experienced war and famine, and then were concerned with labour markets and housing. In the case of infertility research, where women are commonly the unit of analysis and treatments (e.g. assisted reproductive technology) are aimed primarily at women, a large proportion of infertility remains unexplained and is likely related to men’s infertility. In the journal, research on specific topics was also more prevalent in certain parts of the world, with a focus on family planning and (access to) contraception in Africa and Asia, and on fertility decline and trends in European and North American regions. Rich historical data sources (such as parish records), particularly in England and Wales, have likewise allowed research to flourish in this area, in accordance with one of the journals long-standing priorities.
From our analysis we see general patterns that can aid in the evaluation of academic productivity and consider existing disparities. We found that around 33 per cent of authors were women, a proportion that has increased somewhat over time but not reached parity and that is even lower than estimated elsewhere (e.g. 42 per cent by West et al. Citation2013). Ranking the most prolific and cited authors in this journal alone, we found the highest ranked to be predominantly male, a result influenced, potentially, by parental leave, women’s under-representation in academia, and other structural factors that might bias equity in potential career paths. Editors, funders, and researchers are now able to identify what has and, importantly, what has not been published in Population Studies, which, although representing only one of many journals, may be symbolic of the broader field. While perhaps already known to funders and researchers, an example would be the oft-mentioned lack of research into men’s fertility (Goldscheider and Kaufman Citation1996). Those who fund, develop, and collect data need to be reminded of large gaps in focus or availability of data and the skewed focuses on data collection and research on certain groups. In terms of bibliometric policies, we encourage the journal to consider mandatory code and data archiving (with the generation of DOIs for resources other than just academic papers) and the creation of a paper type focused solely on describing and introducing new and original sources of data (in parallel to equivalent papers which introduce new methods).
The strengths of our approach are in its comprehensive and longitudinal nature, which provided us with many data points to allow an analysis of how patterns have shifted over time. Concordant with our understanding of the pressing demographic issues over the last 75 years, authors in Population Studies have given special consideration to fertility declines, improvements in longevity, and population ageing. While many central questions remained constant, the data and methods used to examine them evolved substantially. We also acknowledge that our approach has limitations, such as the inability to draw generalizable conclusions about demography from multiple journals (despite potential representativeness). We are likewise aware that our highly computational approach potentially misses many of the more subtle nuances within each area, but the machine-learning approach that allowed topics and subtopics to emerge and the coding exercise carried out by hand showed very similar and intuitive categories. We make the code of our analysis openly available and invite all interested scholars to extend the work beyond this initial analysis.
Notes
1 Melinda C. Mills and Charles Rahal are based at the Leverhulme Centre for Demographic Science and Nuffield College, University of Oxford. Please direct all correspondence to Melinda C. Mills, Director, Leverhulme Centre for Demographic Science, Nuffield College, University of Oxford, OX1 1JD; or by E-mail: [email protected]
2 Acknowledgements: The authors benefited from the support of the Leverhulme Trust, the Leverhulme Centre for Demographic Science and Nuffield College, and the ERC grant ERC-2018-ADG-835079 (to Melinda Mills). We are grateful to research assistants Sofia Gieystor and Jiani Yan for their painstaking work on data curation and also for comments from members of the Leverhulme Centre for Demographic Science (Ridhi Kashyap in particular) and Population Studies editors and reviewers.
3 Data and code: The work is fully reproducible and is made available on GitHub (github.com/crahal/PopStudies_Review) and Zenodo (DOI:10.5281/zenodo.4553236) under a GNU General Public License.
References
- Attane, I. 2009. The determinants of discrimination against daughters in China: Evidence from a provincial-level analysis, Population Studies 63(1): 87–102. doi:https://doi.org/10.1080/00324720802535023
- Banks, A. D. 2008. Women and heart disease: Missed opportunities, Journal of Midwifery & Women’s Health 53(5): 430–439. doi:https://doi.org/10.1016/j.jmwh.2008.04.008
- Barban, N., R. Jansen, R. De Vlaming, A. Vaez, J. J. Mandemakers, F. C. Tropf, X. Shen, et al. 2016. Genome-wide analysis identifies 12 loci influencing human reproductive behavior, Nature Genetics 48(12): 1–7. doi:https://doi.org/10.1038/ng.3698
- Bertrand, J. T., W. E. Bertrand, and M. Malonga. 1983. The use of traditional and modern methods of fertility control in Kinshasa, Zaire, Population Studies 37(1): 129–136. doi:https://doi.org/10.1080/00324728.1983.10405928
- Bumpass, L. and H.-H. Lu. 2000. Trends in cohabitation and implications for children s family contexts in the United States, Population Studies 54(1): 29–41. doi:https://doi.org/10.1080/713779060
- Cleland, J. and C. Wilson. 1987. Demand theories of the fertility transition: An iconoclastic view, Population Studies 41(1): 5–30. doi:https://doi.org/10.1080/0032472031000142516
- Goldscheider, F. K. and G. Kaufman. 1996. Fertility and commitment: Bringing men back in, Population and Development Review 22: 87–99. doi:https://doi.org/10.2307/2808006
- Gompertz, B. 1825. On the nature of the function expressive of the law of human mortality, and on a new mode of determining the value of life contingencies. In a letter to Francis Baily, Esq., Royal Society 115. doi:https://doi.org/10.1098/rstl.1825.0026
- Grebenik, E. 1979. David Victor Glass (1911–1978), Population Studies 33(1): 5–17. doi:https://doi.org/10.1080/00324728.1979.10412774
- Grebenik, E. 1996. Editor’s note, Population Studies 50(3): 303–304. doi:https://doi.org/10.1080/0032472031000149506
- Halley, E. 1693. An estimate of the degrees of mortality of mankind, drawn from the curious tables of the births and funerals at the city of Breslaw, with an attempt to ascertain the price of annuities upon lives, Philosophical Transactions of the Royal Society 17: 596–610.
- Hertrich, V., P. Feuillet, O. Samuel, A. Doumbia Gakou, and A. Dasré. 2020. Can we study the family environment through census data? A comparison of households, dwellings, and domestic units in rural Mali, Population Studies 74(1): 119–138. doi:https://doi.org/10.1080/00324728.2019.1694166
- Hirsch, J. E. 2005. An index to quantify an individual’s scientific research output, PNAS 102(46): 16569–16572. doi:https://doi.org/10.1073/pnas.0507655102
- Hobcraft, J. 1996. The first fifty years—A tribute to E. Grebenik, Population Studies 50(3): 301–302. doi:https://doi.org/10.1080/0032472031000149496
- Hobcraft, J. 2006. The ABC of demographic behaviour: How the interplays of alleles, brains, and contexts over the life course should shape research aimed at understanding population processes, Population Studies 60(2): 153–187. doi:https://doi.org/10.1080/00324720600646410
- Hubert, L. and J. Schultz. 1976. Quadratic assignment as a general data analysis strategy, The British Psychological Society 29(2): 190–241. doi:https://doi.org/10.1111/j.2044-8317.1976.tb00714.x
- Jagsi, R., E. A. Guancial, C. C. Worobey, L. E. Henault, Y. Chang, R. Starr, N. J. Tarbell, et al. 2006. The ‘gender gap’ in authorship of academic medical literature—A 35-year perspective, New England Journal of Medicine 355(3): 281–287. doi:https://doi.org/10.1056/NEJMsa053910
- Kashyap, R. 2019. Is prenatal sex selection associated with lower female child mortality?, Population Studies 73(1): 57–78. doi:https://doi.org/10.1080/00324728.2018.1442583
- Kiss, T. and J. Strunk. 2006. Unsupervised multilingual sentence boundary detection, Computational Linguistics 32(4): 485–525. doi:https://doi.org/10.1162/coli.2006.32.4.485
- Kohler, H.-P., J. L. Rodgers, and K. Christensen. 1999. Is fertility behavior in our genes? Findings from a Danish twin study, Population and Development Review 25(2): 253–288. doi:https://doi.org/10.1111/j.1728-4457.1999.00253.x
- Krackhardt, D. and R. T. Stern. 1988. Informal networks and organizational crises: An experimental simulation author, Social Psychology Quarterly 51(2): 123–140. doi:https://doi.org/10.2307/2786835
- Lam, D. 2020. Personal correspondence, 17 September 2020.
- Lundine, J., I. L. Bourgeault, J. Clark, S. Heidari, and D. Balabanova. 2018. The gendered system of academic publishing, The Lancet 391(10132): 1754–1756. doi:https://doi.org/10.1016/S0140-6736(18)30950-4
- Makeham, W. 1860. On the law of mortality and the construction of annuity tables, The Assurance Magazine, and Journal of the Institute of Actuaries 8(6): 301–310.
- Malthus, T. R. 1798. An Essay on the Principle of Population. London: J. Johnson.
- McKeown, T. and R. G. Record. 1962. Reasons for the decline of mortality in england and wales during the nineteenth century, Population Studies 16(2): 94–122. doi:https://doi.org/10.1080/00324728.1962.10414870
- Mills, M. C., F. C. Tropf, D. M. Brazel, N. van Zuydam, A. Vaez, M. Agbessi, H. Ahsan, et al. 2021. Identification of 371 genetic variants for age at first sex and birth linked to externalising behaviour, Nature Human Behaviour. doi:https://doi.org/10.1038/s41562-021-01135-3
- Mills, M. C. and K. Begall. 2010. Preferences for the sex-composition of children in Europe: A multilevel examination of its effect on progression to a third child, Population Studies 64(1): 77–95. doi:https://doi.org/10.1080/00324720903497081
- Mills, M. C. and C. Rahal. 2019. A scientometric review of genome-wide association studies, Communications Biology 2(1). doi:https://doi.org/10.1038/s42003-018-0261-x
- Mills, M. C. and C. Rahal. 2020. The GWAS Diversity Monitor tracks diversity by disease in real time, Nature Genetics 52(3): 242–243. doi:https://doi.org/10.1038/s41588-020-0580-y
- Mills, M. C. and C. Rahal. 2021. Code to replicate ‘Population Studies at 75 years: An empirical review’. doi: https://doi.org/10.5281/zenodo.4553235
- Mills, M. C., and F. C. Tropf. 2020. Sociology, genetics and the coming of age of sociogenomics, Annual Review of Sociology 46: 553–581. doi:https://doi.org/10.1146/annurev-soc-121919-054756
- Nabukalu, D., G. Reniers, K. A. Risher, S. Blom, E. Slaymaker, C. Kabudula, B. Zaba, et al. 2020. Population-level adult mortality following the expansion of antiretroviral therapy in Rakai, Uganda, Population Studies 74(1): 93–102. doi:https://doi.org/10.1080/00324728.2019.1595099
- North, S. 2004. Drawing graphs with NEATO. Tutorial 1–11. http://bombela-dev.is-a-geek.org/MeriseAcide/export/76/trunk/libgraphiz_hack/graphviz-2.17.20080206.0540/doc/neatoguide.pdf
- Preston, S. H. 1975. The changing relation between mortality and level of economic development, Population Studies 29(2): 231–248. doi:https://doi.org/10.1080/00324728.1975.10410201
- Rodgers, G. B. 1979. Income and inequality as determinants of mortality: An international cross-section analysis, Population Studies 33(2): 343–351. doi:https://doi.org/10.1080/00324728.1979.10410449
- Preston, S., P. Heuveline, and M. Guillot. 2000. Demography: Measuring and Modeling Population Processes. Hoboken, NJ: Wiley-Blackwell.
- Rumford, J. and S. Greene. 1979. A study of the correlation bias of unrecorded events by two independent enumeration systems, Population Studies 33(1): 181–188. doi:https://doi.org/10.1080/00324728.1979.10412785
- Schreiber, M. 2008. A modification of the h-index: The hm-index accounts for multi-authored manuscripts, Journal of Informetrics 2(3): 211–216. doi:https://doi.org/10.1016/j.joi.2008.05.001
- Timæus, I. M. 2016. Going online—A tribute to John Simons, Population Studies 70(3): 273–274. doi:https://doi.org/10.1080/00324728.2016.1243198
- Vaupel, J. W. 1998. Biodemographic trajectories of longevity, Science 280(5365): 855–860. doi:https://doi.org/10.1126/science.280.5365.855
- Watkins, S. C. 1993. If all we knew about women was what we read in demography, what would we know?, Demography 30(4): 551. doi:https://doi.org/10.2307/2061806
- West, J. D., J. Jacquet, M. M. King, S. J. Correll, and C. T. Bergstrom. 2013. The role of gender in scholarly authorship, PLoS ONE 8(7). doi:https://doi.org/10.1371/journal.pone.0066212