
 ?Mathematical formulae have been encoded as MathML and are displayed in this HTML version using MathJax in order to improve their display. Uncheck the box to turn MathJax off. This feature requires Javascript. Click on a formula to zoom.
Abstract
This study uses prospective data spanning 27 years (1991–2018) to explore the relationship between economic precariousness and transitions to first co-residential partnership among Britons aged 18–34 across three dimensions: age, historical time, and sex. Economic precariousness is measured using eight objective and subjective indicators, including income, employment, housing, and financial perceptions. Our results show that economic precariousness has a strong negative relationship with entering the first co-residential partnership among those aged 20–30, but the pattern is less clear among the youngest and oldest. Objective measures are easier to interpret than subjective measures. Historical analyses suggest that not being employed decreases the probability of union formation more in recessionary periods than in non-recessionary ones. Among working women, low labour income started to be a predictor of union formation in the most recent periods. Labour income is the only indicator presenting trends in line with our hypotheses across all dimensions.
Introduction
Western countries have experienced significant shifts in partnership dynamics among young adults since the second half of the twentieth century (Raley Citation2000; Kiernan Citation2002). The share of young individuals beginning their first co-residential partnerships (living with a romantic partner) with marriage declined sharply, while the proportion cohabiting rapidly increased. In many contexts, cohabitation became the normative way of entering a first co-residential partnership. Traditional explanations for these trends include increasingly secular/liberal values and socio-economic factors, including increased women’s education and labour market participation (Van De Kaa Citation1987; Corijn and Klijzing Citation2001). However, in the same period, globalization, and labour market privatization and deregulation increased young adults’ economic precariousness (Kalleberg Citation2018).
Increasing precariousness also postponed young adults’ family formation by lengthening the time spent in education, rendering their labour market entry more unpredictable and insecure, and prolonging the time required to become economically sufficient (Mills and Blossfeld Citation2005). This paper deepens our understanding of the relationship between economic precariousness and entry into first co-residential partnership among young adults, using the UK as a case study. We use economic precariousness as an umbrella term to measure a lack of resources encompassing objective aspects of individual economic insecurity related to employment, income, and housing and also subjective aspects regarding the overall economic situation.
Previous UK studies that analysed the association between economic factors and transitions to first co-residential union (Berrington and Diamond Citation2000; Ermisch and Francesconi Citation2000; Francesconi and Golsch Citation2005) focused on employment aspects, without considering broader indicators, such as income or housing, as we do here. Using a long time series of data (1991–2018) from the British Household Panel Survey (BHPS) and its successor, the UK Household Longitudinal Study (UKHLS), this paper also enriches existing evidence by comparing a variety of objective and subjective aspects and examining whether their relationships with first co-residential partnership formation change by age or over historical periods with different socio-economic conditions. We also explore potential sex differences across time.
In the absence of an agreed definition of economic precariousness, we compare different indicators, verifying whether they lead to similar conclusions and, if not, whether there is one aspect that most coherently describes the expected trends in partnership formation across all three dimensions. Finally, this paper updates previous literature, as micro-level evidence of marriage and cohabitation postponement in the UK in the last decade is scarce (except for Pelikh Citation2019).
Theoretical background
Defining economic precariousness
The term ‘precariousness’ has been used increasingly in the literature since the 1960s. It often involves employment that deviates from the full-time, long-term, and secure jobs typical of the Fordist period (Barbier Citation2002, Citation2011). The concept of précarité had previously been developed by Bourdieu et al. (Citation1963) and Pitrou (Citation1978) to represent labour market vulnerability (e.g. irregular work, lack of skills, low compensation, and poor career prospects) and its consequences. Précarité also referred to poverty, lack of savings, and poor housing, with a consequent impossibility of planning for the future and a persistent sense of insecurity. Since the 2000s, this wider concept has been revived under the name ‘precarity’ (Barbier Citation2011; Standing Citation2011, Citation2014; Kalleberg Citation2018; Choonara Citation2019, Citation2020). Precarity refers to a ‘generalised set of social conditions and an associated sense of insecurity, experienced by precarious workers but extending to other domains of social life such as housing, welfare provision and personal relationships’ (Campbell and Price Citation2016, pp. 315–16). In this paper, we combine the concepts of precarious work and precarity into ‘economic precariousness’, which includes objective aspects of individual economic insecurity (related to employment and financial domains, housing resources, and benefit recipience) alongside individuals’ subjective perceptions of their financial situation.
Economic precariousness and the UK context
The UK liberal employment regime, characterized by low employment regulation and low state intervention, is unique within Europe (Gallie Citation2013). Unemployment rates have been relatively low except during the economic recessions of the 1980s, 1990s, and late 2000s (Bell and Blanchflower Citation2010). Despite progressive flexibilization and deregulation of the labour market (Furlong et al. Citation2017), the presence of temporary contracts is limited. In 2012, the share of 15–24-year-olds in temporary jobs was around 15 per cent, against 42 per cent in the European Union (EU) (Matsaganis et al. Citation2013). Hence, the youth unemployment rate and share of temporary contracts (two indicators typically used internationally to measure youth precariousness) are low compared with the EU average. Yet, insecure jobs and economic uncertainties remain (Furlong et al. Citation2017; Leonard and Wilde Citation2019). Permanent contracts hide other types of precariousness (Rubery Citation1989), including short- and zero-hours contracts (Datta et al. Citation2019) and low pay (McKnight et al. Citation2016). This employment precariousness has often been accompanied by restricted welfare support consisting of highly conditional unemployment benefits and means-tested benefits, which have been reduced in availability and value due to government austerity measures, especially in the last decade (Sealey Citation2014).
Economic precariousness also relates to the increased difficulties young Britons have saving (e.g. for long-term purposes, such as home buying, or for precautionary reasons) (Dolphin Citation2012). The Office for National Statistics (ONS Citation2018) reported that the share of Britons aged 22–29 with no savings (in a savings account) rose from around 40 per cent in 2008–2010 to 53 per cent in 2014–2016. Finally, housing has also become considerably more uncertain over time (Furlong et al., Citation2017), Traditionally, the UK has been characterized by early home-leaving, supported by affordable social housing and welfare benefits. However, there has been a progressive marginalization of social housing, a greater dependency on (increasingly expensive) private renting, and reductions in the value of housing benefits due to austerity (Berrington and Stone Citation2014). Thus, young adults' economic precariousness in the UK has increased due to both increased employment precariousness and wider precarity.
Economic precariousness and union formation
Microeconomic theorists belonging to the New Household Economics have argued that economic uncertainty reduces the economic gains to partnership formation. Maximum gains to partnership formation occur when both partners are positively sorted on non-substitutable goods (e.g. property income, education) and negatively matched on substitutable goods (i.e. earnings) (Becker Citation1981). Oppenheimer (Citation1988) also argued that uncertain employment, especially for men, delays partnership formation, particularly marriage, until both partners establish themselves in the labour market and collect enough economic resources.
In a more recent study, Mills and Blossfeld (Citation2005) found empirical evidence that economic uncertainty arising from globalization (e.g. low pay or occupational class) undermines young adults’ ability to commit to family formation. Moreover, employment and temporal uncertainty (e.g. flexible, short-term, and short-hours contracts) destabilize young adults’ long-term prospects, thereby discouraging partnership formation.
Contemporary studies also highlight the importance of considering subjective perceptions of economic precariousness (Kreyenfeld Citation2015; Bernardi et al. Citation2019; Vignoli et al. Citation2020; Bolano and Vignoli Citation2021). For instance, Vignoli et al. (Citation2020, p. 26) theorized that uncertain economic prospects could affect individuals’ narratives of the future, that is, the ‘imagined futures embedded in social elements and their interactions’ based on which they form their intentions and take their decisions when lacking knowledge of the time ahead. Consequently, young adults might refrain from entering a union under economically uncertain conditions because their current situation and ignorance about the future discourage them from committing themselves.
However, the relationship between economic resources and first partnership formation is not always negative. For instance, cohabitation can be a suitable living arrangement for precarious young couples, wherein they can get to know each other while solving their uncertainties and before making the higher-level commitment of marriage (Oppenheimer Citation2003). Therefore, in contexts where cohabitation has become normative as the first co-residential union, the association between economic precariousness and partnership formation could be positive. Qualitative research in the United States supports this idea, suggesting that some couples are pushed into forming a partnership by economic necessity: to pool economic resources and halve living expenses (e.g. Sassler and Miller Citation2017); this idea of risk pooling was also put forward earlier by New Home Economics theorists. Similarly, Friedman et al. (Citation1994) argued that entering a partnership and parenthood could be a suitable ‘alternative’ career for women aiming to reduce their economic uncertainty.
Differences according to age
We expect the association between economic precariousness and union formation to vary by age. Using the General Household Survey, Beaujouan and Ní Bhrolcháin (Citation2011) demonstrated that there had been a significant postponement of first partnership formation, particularly marriage, in Britain between the 1970s and 2000s. However, young adults from socio-economically disadvantaged backgrounds are likely to continue to form their first partnerships at younger ages (Berrington and Diamond Citation2000), leading commentators to describe a ‘fast track’ and a ‘slow track’ transition to adulthood (Jones Citation2002; Bynner Citation2005). Socio-economically disadvantaged individuals may seek a co-residential union early in life for several reasons: normative ages for family formation are younger for these groups, and often a pregnancy precedes their first co-residential union transition (Berrington and Diamond Citation2000); disadvantaged youth tend not to be enrolled in higher education and do not postpone partnership formation due to role incompatibility between being a student and family formation (Ní Bhrolcháin and Beaujouan Citation2013). Additionally, they may seek to cope with economic instability by pooling resources with their partner (Sassler and Miller Citation2017) or finding meaning in life through family (Friedman et al. Citation1994). We hence expect a positive association between economic precariousness and union formation at the youngest ages, where economic uncertainty is highest.
Instead, most individuals forming a first union in their mid- or late 20s are likely to have achieved secure employment after attending higher education, and they represent more attractive partners than precarious individuals in the same age range, given that the former tend to partner assortatively (Blossfeld and Huinink Citation1991; Bergstrom and Bagnoli Citation1993, cited in Ermisch Citation2003, pp. 246–7). That research referred principally to men. However, Bergstrom and Schoeni (Citation1996), using US Census data, also reported that women partnering later tended to have higher family incomes than those partnering earlier. They suggested that one potential explanation could be that women who delayed marriage represent more attractive partners for men who have postponed marriage and have high earnings. Hence, we expect a negative association between economic precariousness and union formation for individuals in their mid- and late 20s.
Individuals who never partner before their 30s are often economically precarious individuals lacking the resources to attract or move in with a partner (Berrington and Diamond Citation2000). However, this group also includes highly educated, career-oriented people intentionally postponing first union formation, those waiting to marry directly, and those with a strong preference for singlehood (Jalovaara Citation2012; Blossfeld Citation2009; Sassler et al. Citation2010). Thus, we expect the relationship between economic precariousness and first union formation still to be negative for the oldest young adults, although the association may be weaker in this case.
Hypothesis 1 (H1): Economic precariousness will increase the probability of union formation among older teenagers. It will decrease the probability of union formation among those in their 20s and, to a lesser extent, 30s.
Changes over historical time: Economic recessions
The UK economy has undergone phases of expansion, stability, and recession over the last 30 years. We identify four historical periods based on trends in youth unemployment and key political events. The 1991–97 period saw a downturn in 1993, followed by a recovery (Bell and Blanchflower Citation2010) and ended when the Labour Party won the general election. In contrast, 1998–2007 saw general economic stability, although pre-existing trends in temporary, low-skilled, and low-paid jobs continued (Furlong et al. Citation2017) and youth unemployment started to increase moderately from 2004 (Bivand Citation2012). The Great Recession characterized 2008–13, while 2013–18 saw some economic recovery.
Most literature argues that recessions are associated with lower rates of family formation, as individuals avoid making commitments (e.g. partnerships, fertility) during economically insecure periods (Cherlin et al. Citation2013; Goldstein et al. Citation2013; Comolli Citation2017). Since resources such as earnings, savings, or housing are more uncertain, an economic recession will raise the economic level needed to pursue life commitments or live independently (Ranjan Citation1999). These obstacles are also subjective, as individuals’ insecure perceptions will deteriorate (Kreyenfeld Citation2015; Comolli and Vignoli Citation2019; Guetto et al. Citation2021). Young, economically precarious individuals are likely to have fewer economic means to face such a sudden, long-term shock. Therefore, they will be less likely to meet the necessary bar for making family commitments (Watson and McLanahan Citation2011) and more inclined to forego or revise their plans to enter a union, especially marriage (Sobotka et al. Citation2011). Moreover, as less attractive partners, they are also less likely to be selected on the partnership market. During economic recovery, partnership formation rates should return to their original levels as couples ‘catch up’ with family formation (Sobotka et al. Citation2011).
Cohabitation is often seen as an affordable alternative to marriage during periods of uncertainty (Oppenheimer Citation2003; Schneider Citation2017). However, since recessions hinder young adults’ independence, both forms of partnership are likely to be discouraged (Stone et al. Citation2011). In sum, we suggest that the relationship between economic precariousness and partnership formation will be stronger during recessions than during economic stability or expansion.
Hypothesis 2 (H2): Economic precariousness will decrease the probability of union formation more during periods of economic recession (e.g. 2008–13) than in periods of economic stability or expansion.
Changes over historical time: Sex differences
The economic role of women has changed dramatically since the 1970s, when women’s education and labour market participation started to increase (ONS Citation2013). Many working women postponed their first union, partly to establish their careers before family formation and partly because, having gained economic independence from their family of origin, they could prolong their search for the most suitable partner (Schwartz Citation2013). At the same time, globalization and deindustrialization changed the nature of men’s jobs, reducing their ability to provide for a family (Sironi and Furstenberg Citation2012). Thus, over time, women’s economic resources may have become more important for union formation (Oppenheimer and Lew Citation1995; Blossfeld and Timm Citation2003; Sweeney and Cancian Citation2004; Van Bavel Citation2018), with today’s men considering women’s resources an important characteristic of potential partners (Buss et al. Citation2001; Blossfeld Citation2009). Increasingly, women enter a first union with someone of a similar age and with similar or fewer economic resources (Klesment and Van Bavel Citation2017). Therefore, it is likely that the association between economic precariousness and first union formation for women has become more similar to that of men over the last three decades.
Hypothesis 3 (H3): For men, economic precariousness will decrease the probability of partnership formation over the historical periods we examine. For women, the association between precariousness and union formation will become negative and strengthen over time.
Data and methods
Data and sample
We pooled individual-level data from the BHPS and the UKHLS (Institute for Social and Economic Research, Citation2019). Both surveys interview respondents approximately each year, but unlike the BHPS, the fieldwork for each UKHLS wave covers 24 months (Understanding Society Citation2022). The BHPS has 18 waves (1991–2008), while our UKHLS data set comprises nine waves (2009/10–2017/18). The BHPS started with a representative sample of 5,500 randomly selected British households. Subsequent boosts included those for Welsh, Scottish, and Northern Irish subsamples. The UKHLS comprised around 40,000 households at the start. Apart from a sample of British and Northern Irish households, UKHLS also included the previous BHPS interviewees (from its second wave) and two ethnicity and immigrant boosts representing the increasing proportion of ethnic minorities in the UK, especially second and third-generation immigrants (Platt and Nandi Citation2020). Both surveys tracked individuals from original households, even when they left to form a new household.
Individuals entering our sample were fully responding original sample members (OSMs) with valid information for at least two consecutive waves, who were aged 18–34 and had never experienced a co-residential partnership. We excluded full-time students from the sample since most (70 per cent) did not have a paid job (and thus zero income), thereby rendering the meaning and measurement of precariousness for students different from that of working young adults. We followed our sample of 6,782 respondents (of whom 60 per cent were first observed in the sample at age 18–21) until they transitioned to their first co-residential union between a given wave, t, and the following wave, t + 1. Since wave interviews for each individual occurred approximately one year apart, we refer to the interval (t, t + 1) as a person-year. The sample consists of 20,688 person-years. All boosts from both surveys were included, meaning that the sample developed in terms of geographical coverage and ethnic composition, especially at the shift from BHPS to UKHLS (see section S1, supplementary material; note that all tables and figures prefixed with S are in the supplementary material).
Outcome
Direct marriage and cohabitation were combined into one event (forming a co-residential partnership) due to the selectivity and rarity of direct marriage in recent periods (82.2 per cent of the 1,910 valid events were cohabitations). However, we also computed additional analyses where cohabitation and direct marriage were competing risks. The median age of union formation among those entering their first union was 24 for men and 23 for women.
Indicators of economic precariousness
Eight indicators across four domains of economic precariousness were chosen to reflect our definition in the UK context, encompassing aspects of precarious work, subjective indicators, and housing. Indicators needed to be available across most waves of BHPS and UKHLS. Technical details on how the indicators were constructed are presented in section S1. Occupational class and contract type were used to represent the employment domain. For occupational class, the non-employed (those out of the labour force) were contrasted with workers in routine/semi-routine (labelled as ‘routine’), intermediate, and managerial/professional (labelled as ‘managerial’) jobs. For contract type, they were contrasted with those in temporary or permanent jobs.
The financial domain consisted of labour income tercile (based on total gross monthly labour income), means-tested benefits, and savings. The indicator for labour income consisted of three categories: the most precarious was non-earners, followed by low earners (first tercile), and medium–high earners (second and third terciles). Non-earners included those out of the labour force and the self-employed with negative income. Not saving money and receiving means-tested benefits were both considered precarious conditions since they signalled either the presence of low income or the impossibility of accumulating resources to plan for the long term. In UKHLS, savings questions were asked biennially, from Wave 2 onwards; therefore, we imputed missing observations using values from the previous wave. Receiving means-tested benefits was a binary variable indicating whether the respondent received the welfare benefits listed in section S1.
The housing domain was represented by respondents’ housing tenure (living with parents or living independently as homeowners or as renters from a public institution or private landlord). Although in the UK our reference category (co-residence with parents) is normative among those in their early 20s, it indicates a more disadvantaged status from the mid-20s onwards (Stone et al. Citation2014). Living in rented accommodation, particularly private renting, is considered the most insecure status for family formation (Tocchioni et al. Citation2021). In models excluding housing tenure, we included a binary variable indicating current co-residence with parents.
Subjective indicators capture short- and long-term economic insecurity. Perceived current financial situation was based on the question ‘How well would you say you yourself are managing financially these days?’. The original five-category variable was recoded into good (living comfortably / doing alright), getting by, and difficult (very difficult / quite difficult). Financial expectations were based on the question ‘Looking ahead, how do you think you will be financially a year from now, will you be … ?’. Answer categories were worse off, the same, or better off.
Other covariates
Our hypotheses explore how the relationship between economic precariousness and first partnership is moderated by age, sex, and historical period. Age was captured by a quadratic polynomial, consistent with past research (Steele Citation2005), while sex was included as a binary variable. Historical period comprised four categories: 1991–97, 1998–2007, 2008–13, and 2013–18. We defined these periods based on survey waves, to account for the rescaling of weights (see next section); this caused an overlap between the last two periods (waves in 2012/13 and 2013/14).
We controlled for other individual socio-demographic characteristics that may confound the relationship with union formation (see section S1 for the construction of the most complex controls). Parental occupational class, based on the three-class version of the National Statistics Socio-Economic Classification, was included as a control for socio-economic background. As discussed in the Theoretical background section, class differences are argued to persist at the normative age of partnership formation, so this variable was interacted with age. Educational qualifications and religion were included to capture more secular and liberal attitudes towards partnership formation. Education was coded as low (no qualifications), intermediate, advanced, or high. Religion status indicated whether or not the individual belonged to a religion. We captured the changing ethnic composition of young Britons by including a variable indicating self-reported ethnicity, coded as White British/Irish, Bangladeshi, Pakistani, Indian, Other Asian, African, Caribbean, or Other and Mixed. We included a covariate indicating geographical location, coded as London, elsewhere in England, Wales, Scotland, or Northern Ireland. We also introduced a binary indicator for presence of biological children in the household. As a robustness check, we undertook further analyses adding women’s pregnancy status (or partner’s, for men).
Analytical strategy
We ran separate analytical models for each indicator of economic precariousness, to identify the extent to which these different measures could characterize the relationship between economic precariousness and partnership formation. This approach allowed us to compare the trends for each indicator and identify the one most coherently associated with the relationship of interest across all three dimensions, also avoiding problems of high collinearity, since some of these indicators were highly correlated.
To ensure the correct comparison across the models, analyses were performed on the same sample with valid data on all measures of precariousness in each wave (a missing category was allowed for control variables only). Discrete-time logistic regression was used to estimate the relationships between indicators of economic precariousness and the probability of entering a first co-residential union between years t and t + 1, conditional on being never-partnered in year t (Singer and Willett Citation2003). This probability is also known as the hazard: . The model was specified as follows (e.g. Allison Citation1982):
(1)
(1) where
represents the baseline logit hazard function (i.e. age),
the time-varying indicator of economic precariousness in the considered equation, and
a vector of key individual controls. Therefore, if an individual entered a co-residential union in 2000, the relevant covariates were measured around 1999 (the previous wave). Individuals were censored when lost to follow-up or on reaching age 34 (see section S2 for details on interval censoring, including intermittent non-response).
Analyses were weighted using longitudinal weights (Kaminska and Lynn Citation2019). Longitudinal weights corrected for differential non-response and possible over-representation of the included boosts (e.g. ethnic minorities) and gave full weights to OSMs. The applied weights were measured concurrently with the event, at time t + 1. Weights were rescaled to give an even representation of the observations across pooled waves (UKHLS Support Forum Citation2013). Nevertheless, while weights can address non-response related to respondents’ observable characteristics, they cannot account for non-response related to the event of interest (we comment on this issue in the section on limitations).
When testing H1, the effect of precariousness over age was assumed non-proportional by including an interaction between and the covariates representing precariousness. For H2, we included two-way interactions between precariousness indicators and historical periods. In H3, we expanded the latter to consider a three-way interaction between the precariousness indicators, historical period, and sex. For H2 and H3, interactions between age and the indicators of precariousness remained but were considered as controls. Analyses were carried out using Stata 17 (StataCorp Citation2021).
To facilitate interpretation of the results, we present, for each category of the indicators of economic precariousness, the predicted annual probabilities of entering a first co-residential partnership between years and
, conditional on having never experienced a co-residential relationship in year
(StataCorp Citation2019a, Citation2019b). Apart from the covariates involved in the interaction of interest, other covariates values were kept at their mean value. We adjusted the width of the confidence intervals around the predicted probabilities in line with Goldstein and Healy (Citation1995), to guarantee that the means were, on average, significantly different at the 5 per cent level if their confidence intervals did not overlap completely. The intervals were graphed with width
, equivalent to around 84 per cent confidence level.
To study H1, we examined the sign, strength, and magnitude of the predicted probabilities for the more precarious categories compared with the least precarious ones. To address H2 and H3, we used F-tests for differences in the magnitude of effects across historical periods. The reference period for H2, where we explored the effect of economic recessions, was 2008–13. For H3, where we explored longer-term historical changes in the effects of sex, the earliest period, 1991–97, was the reference.
Since the eight indicators were interrelated, we performed an exploratory factor analysis (EFA) to understand whether they measured aspects of the same concept and whether an index could be used as an alternative to our ‘separate’ approach. The EFA was based on a polychoric correlation matrix using an oblique rotation.
Results
Distribution of variables and their correlation
shows the distribution of indicators of economic precariousness. Permanent workers make up 74 per cent of total weighted person-years, confirming the low diffusion of temporary employment in the UK, while the non-employed represent only 17 per cent of person-years. The majority of sample members do not claim means-tested benefits (82 per cent of person-years), while two-thirds report a good financial situation, and over half expect to be better off in future. Roughly half the sample saves money. There are several possible explanations for why the share of economically precarious person-years is relatively low. First, many young adults exit precariousness as they age (e.g. because they enter the labour market). Second, as we discuss later, precarious individuals may present certain traits that select them into early partnership formation (e.g. social background), whereas those with more resources—the highly educated and career-oriented—tend to delay partnership formation. Third, analyses of attrition patterns within the survey show that young adults who are not employed or who are temporary workers, non-savers, or feeling negative about their perceived financial situation are more likely to be lost to follow-up and this may not be completely accounted for by our weighting.
Table 1 Descriptive statistics for the eight indicators of precariousness: sample of never-partnered young adults aged 18–34, UK
The distribution of control variables is shown in Appendix . The mean ages for women (23.1) and men (23.6) in the sample are close to the median ages at union formation for each sex. Few individuals have no qualifications (5 per cent of person-years), with the largest group having intermediate education. The most individuals come from managerial class backgrounds (40 per cent), but the shares of individuals from intermediate (24 per cent) and routine (29 per cent) backgrounds are similar. Sample members predominantly live in England (85 per cent, including London) and are White British/Irish, with the largest ethnic minority groups being Other and Mixed, Indian, Caribbean, and Pakistani (1–3 per cent).
The results from the polychoric correlation matrix (Table S5) show that the measures representing employment and financial domains are highly correlated (∼0.6–0.8), except for savings (∼0.4), mainly because those not employed constitute a common category in variables in the two domains. Moreover, 63 per cent of those receiving means-tested benefits are not employed. In contrast, co-residence with parents and financial expectations are not highly correlated with other indicators and represent stand-alone concepts.
Economic precariousness and entry into first co-residential partnership
In models not adjusted for individual controls, the annual probability of forming a first co-residential partnership is consistently lower among the economically precarious (). On average, each year, 7 per cent of the non-employed form their first partnership, compared with 9 per cent of routine workers, 11 per cent of those in intermediate occupations, and 14 per cent of professionals and managers. Those on temporary contracts are less likely to form a partnership (9 per cent) than those on permanent contracts (11 per cent), while low-earning workers are less likely to form a union (7 per cent) than high-earning employees (13 per cent). Those receiving means-tested benefits are slightly less likely to form a partnership (9 per cent) than those not receiving benefits (11 per cent). Probabilities are more similar for savers and non-savers. Those living outside the parental home as either homeowners or private renters are the most likely to form a partnership (14–15 per cent), relative to those living with parents (9 per cent).
Figure 1 Predicted annual probabilities of entering a first co-residential partnership for each indicator of economic precariousness: sample of never-partnered young adults aged 18–34, UK
Notes: Confidence intervals are graphed at the 84 per cent level of confidence to guarantee a correct pairwise comparison of the differences in probabilities (Goldstein and Healy Citation1995). Therefore, a non-overlapping confidence interval means that the differences in the estimated means are statistically significant, on average, at the 95 per cent level of confidence. Models represent bivariate associations (i.e. are not controlled for individual socio-economic characteristics). R. refers to respondent; Int refers to intermediate.
Source: Own weighted computations from BHPS and UKHLS, 1991–2018.
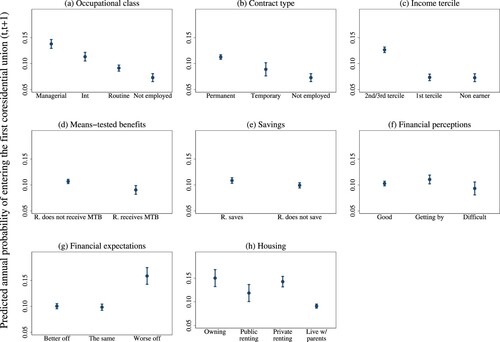
Regarding subjective measures, we find different results according to current or future economic circumstances. We do not find statistically significant differences for perceptions of the former: those ‘getting by’ present a transition probability equal to or higher than those perceiving either a good or difficult financial situation. Yet, financial expectations provide an unanticipated result, as those expecting a worsening financial situation in the subsequent year present a probability roughly six percentage points higher of entering a first co-residential union than those expecting to be better off or the same (each around 10 per cent).
shows the results by age, sex, and historical time (based on model (c) in ). The probability of forming the first co-residential partnership peaks in the mid-20s and steadily declines across historical periods, among both men and women.
Figure 2 Predicted annual probabilities of entering a first co-residential partnership by age, historical period, and sex over historical period: sample of never-partnered young adults aged 18–34, UK
Notes: Confidence intervals are graphed at the 84 per cent level of confidence to guarantee a correct pairwise comparison of the differences in probabilities (Goldstein and Healy Citation1995). Therefore, a non-overlapping confidence interval means that the differences in the estimated means are statistically significant, on average, at the 95 per cent level of confidence. Labels next to each marker represent the estimated mean of the predicted annual probabilities. We used the estimated probabilities from the model containing income tercile as indicator of economic precariousness (model (c), Table 2), on the basis that results change very little compared with the other models. Results are controlled for respondent’s sex, age, historical period, level of education, co-residence with parents, presence of children, geographical area, ethnicity, religion, and parental class. Covariates are kept at their mean value. Results for continuous age are graphed at specific ages, with two units’ distance each.
Source: As for .
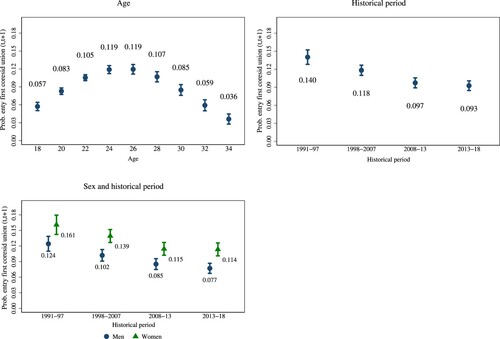
Table 2 Odds ratios from discrete-time logit models relating the likelihood of entering a first co-residential union between t and t + 1 to indicators of precariousness interacted with age: sample of never-partnered young adults aged 18–34, UK
We next test H1, which expects the probability of union formation to increase with economic precariousness among the older teenagers and decrease among those in their 20s and 30s. provides full model results for each indicator (predicted probabilities in Table S1). H1 is broadly confirmed for those in their 20s (up to age 30). Several indicators show that the most economically precarious young adults are significantly less likely to form a co-residential partnership than the least precarious. Similar trends, albeit insignificant, are found among those aged over 30, whereas for the youngest the strength and direction of differences depend on the considered indicator.
Figure 3 Predicted annual probabilities of entering a first co-residential partnership for each indicator of economic precariousness, by age: sample of never-partnered young adults aged 18–34, UK
Notes: Confidence intervals are graphed at the 84 per cent level of confidence to guarantee a correct pairwise comparison of the differences in probabilities (Goldstein and Healy Citation1995). A non-overlapping confidence interval means that the differences in the estimated means are statistically significant, on average, at the 95 per cent level of confidence. Results are controlled for respondent’s sex, historical period, level of education, co-residence with parents, presence of children, geographical area, ethnicity, religion, and parental class. Covariates are kept at their mean value. Graphs (g) and (h) are on a different scale from the others to give a better visualization of the results. R. refers to respondent; Int refers to intermediate. Results for continuous age are graphed at specific ages, with two units’ distance each.
Source: As for .
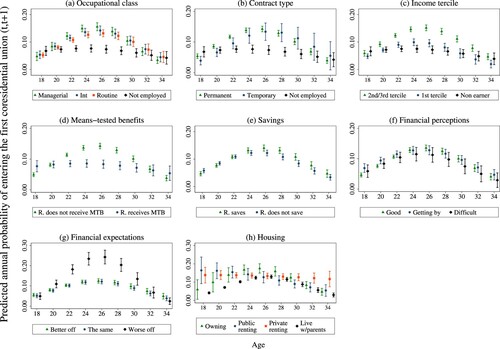
Differences peak in the mid-20s when the proportion forming a first co-residential partnership among the least precarious is roughly double that among the most precarious (). In this age range, 14 per cent of those on permanent contracts and 15 per cent of those in managerial classes and high earners begin a union each year. This compares with 7–8 per cent for those not employed and a slightly higher share of low earners. In this age range, those working on a temporary contract or in intermediate or routine classes are closer in behaviour to the least precarious group than the most precarious, suggesting that not all precarious traits of a job potentially discourage partnership formation. At ages 32 and 34, differences are generally smaller in size and not significant at the 5 per cent level apart from those between low earners and medium–high earners. At age 18, differences between the least precarious category and the non-managerial classes or the non-employed are almost null or even positive, whereas differences for temporary employees and low earners are negative (overall, these differences are not statistically significant at any conventional level).
The means-tested benefits indicator supports H1. At age 18, the probability of forming a first partnership is higher for those on means-tested benefits than for non-recipients (8 vs 5 per cent; p = 0.04). However, patterns reverse at later ages, up to the 30s when differences decrease and become insignificant. For the savings indicator, no significant differences are found at young ages, but at older ages, those saving show a higher tendency to form a first partnership than those not saving.
Results for housing tenure are mixed. At the youngest ages, those living independently in public rented accommodation are the most likely to form a partnership (16 per cent), whereas in the 20s, when overall transitions to first co-residential partnership are highest, homeowners are the most likely (16–17 per cent). From the 30s, transitions to first partnership are highest for those living in private rented accommodation (12 per cent) and lowest for the select individuals who remain in the parental home (3 per cent).
Respondents describing themselves as ‘getting by’ financially present similar predicted probabilities of forming a first co-residential union as those perceiving their financial situation as good, except at the youngest ages, where this probability is significantly higher. However, those in their 20s perceiving a difficult financial situation present lower probabilities of first partnership formation, but confidence intervals are large due to the limited sample size of this group. In contrast, in terms of financial expectations, never-partnered individuals expecting to be worse off in the following year show a higher predicted probability than individuals expecting to be better off or about the same, especially in the mid-20s, where the differences between those expecting to be worse off and the other two categories are around 10 per cent.
When we consider marriage and cohabitation as competing risks through a multinomial logit model (Figures S1 and S2), results on the relationship between economic precariousness and the probability of entering the first cohabitation resemble those already described (as most events are cohabitations). However, compared with the opposite conditions, saving and having ‘good’ financial perceptions appear better predictors for direct marriage (relative to remaining single) than for cohabitation. Unlike for cohabitation, living independently from parents is not associated with direct marriage, suggesting that direct marriage often coincides with exiting the parental home. Those living independently in social housing are less likely to marry directly than those co-residing with parents.
Changes over historical time: Economic recessions
Our second hypothesis, H2, explores whether the effect of precariousness became significantly more pronounced in 2008–13 (i.e. around the Great Recession) compared with other periods. plots the predicted annual probabilities for each category of economic precariousness in each period (Table S2). Since age is fixed at the sample mean, we see that the least precarious categories generally present higher predicted probabilities of entering a first co-residential union than the more precarious ones (consistent with H1). However, our interest concerns whether these differences increased in 2008–13 compared with other periods. The results of formal tests are shown in section S3 (Figure S5).
Figure 4 Predicted annual probabilities of entering a first co-residential partnership for each indicator of economic precariousness, by historical period: sample of never-partnered young adults aged 18–34, UK
Notes: Confidence intervals are graphed at the 84 per cent level of confidence to guarantee a correct pairwise comparison of the differences in probabilities (Goldstein and Healy Citation1995). A non-overlapping confidence interval means that the differences in the estimated means are statistically significant, on average, at the 95 per cent level of confidence. Results are controlled for respondent’s sex, age, level of education, co-residence with parents, presence of children, geographical area, ethnicity, religion, and parental class. Covariates are kept at their mean value. Graphs (g) and (h) are on a different scale from the others to give a better visualization of the results. R. refers to respondent; Int refers to intermediate.
Source: As for .
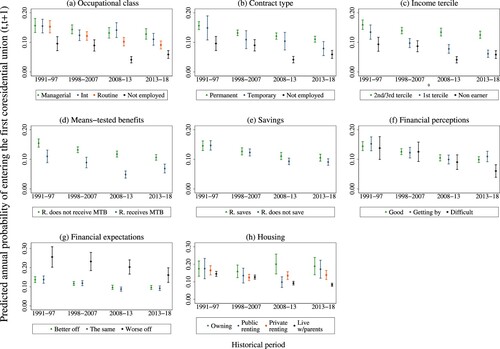
Measures from only the financial and employment domains show systematic differences across all modelled periods. For 1998–2007, the non-employed/non-earners present transition probabilities of around 9 per cent, whereas for permanent workers and high earners they are around 13–14 per cent. In 2008–13, these contrasts are three to four percentage points larger (this change in the differences of probabilities, across the two historical periods, is significant at the 5 per cent level). The comparisons for ‘not employed vs managerial’ and ‘benefit recipients vs non-recipients’ across these periods also show differences of similar magnitude.
Moreover, in 2013–18, permanent workers, high earners, and those receiving means-tested benefits present higher transition probabilities than their counterparts. In 2008–13, these differences tend to be two to three percentage points larger than in 2013–18. We find shifts of similar size when contrasting these same categories in 1991–97 and in 2008–13, although they do not reach significance at any conventional level, probably due to the larger confidence intervals in the first period. We also find sizeable differences when comparing probabilities for those in homeownership and private renting, relative to living with parents, in 1991–97 and 1998–2007 compared with those in 2008–13 but not 2013–18. In sum, only some trends (e.g. contract type and labour income) give systematic support to H2.
When marriage and cohabitation are analysed as separate events (Figures S3 and S4), results for cohabitation resemble the main results, while results for direct marriage are less intelligible due to its rarity.
and present our findings for H3 (predicted probabilities in Table S3): the expectation that, over time, the association between economic precariousness and union formation will become negative for women and remain constantly negative for men. The results of formal tests are in Figures S6 and S7 (section S3). To enhance the visualization of the three-way interaction, we graph the results separately by sex and fix age at each subsample mean. Non-employed and low-income men present lower probabilities of forming a first co-residential union than their counterparts across all periods (even though differences are not always significant at the 5 per cent level; ). Moreover, occupational class, especially intermediate, appears less discriminatory in the most recent period than in the early 1990s.
Figure 5 Men’s predicted annual probabilities of entering a first co-residential partnership for each indicator of economic precariousness, by historical period: sample of never-partnered young adults aged 18–34, UK
Notes: Confidence intervals are graphed at the 84 per cent level of confidence to guarantee a correct pairwise comparison of the differences in probabilities (Goldstein and Healy Citation1995). A non-overlapping confidence interval means that the differences in the estimated means are statistically significant, on average, at the 95 per cent level of confidence. Results are controlled for respondent’s age, level of education, co-residence with parents, presence of children, geographical area, ethnicity, religion, and parental class. Covariates are kept at their mean value. Covariates are kept at their mean value. Graphs (g) and (h) are on a different scale from the others to give a better visualization of the results. R. refers to respondent; Int refers to intermediate.
Source: As for .
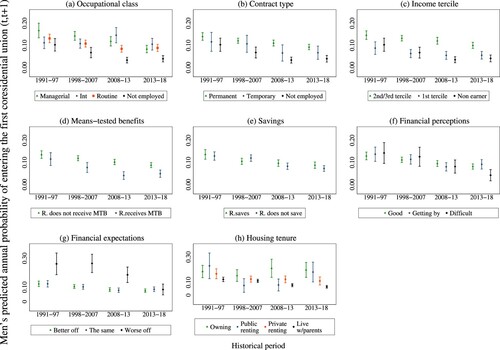
Figure 6 Women’s predicted annual probabilities of entering a first co-residential partnership for each indicator of economic precariousness, by historical period: sample of never-partnered young adults aged 18–34, UK
Notes: Confidence intervals are graphed at the 84 per cent level of confidence to guarantee a correct pairwise comparison of the differences in probabilities (Goldstein and Healy Citation1995). Therefore, a non-overlapping confidence interval means that the differences in the estimated means are statistically significant, on average, at the 95 per cent level of confidence. Results are controlled for respondent’s age, level of education, co-residence with parents, presence of children, geographical area, ethnicity, religion, and parental class. Covariates are kept at their mean value. Graphs (g) and (h) are on a different scale from the others to give a better visualization of the results. R. refers to respondent; Int refers to intermediate.
Source: As for .
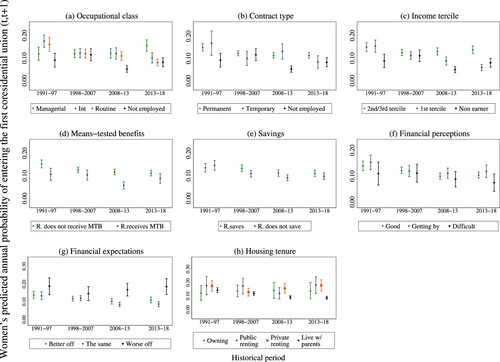
Women show a negative gradient in partnership formation between the non-employed and the reference outcomes in the first and most recent periods, but this negative association is absent in 1998–2007 (). For women, indicators for occupational class and income appear to support H3. In 1991–97, the differences between women in routine and intermediate occupations or earning low income and their least economically precarious counterparts are small, whereas in 2013–18 they become negative, with the latter differences being eight percentage points larger (these changes across these two periods are significant at the 5 per cent level). Trends for means-tested benefits are similar to those for non-employment among both sexes.
Finally, the association between housing tenure and first partnership formation tends to increase over time for both sexes. Subjective measures do not support H3, as women present slight variation over time and men show a sudden change in financial expectations in the most recent period that is hard to interpret. In sum, H3 is only confirmed by some results for the labour income and occupational class indicators (the latter only for women), but there is no systematic evidence in its support.
Control variables are associated with partnership formation in ways expected by the literature and their effect does not alter according to which measure or specification of economic precariousness is used (). Intermediate, advanced, and high education are related to a higher risk of entering a first union than low education (although this finding is not always significant for intermediate and advanced education). Compared with the rest of England, living in London or Northern Ireland is negatively associated with the risk of entering a first co-residential partnership. As shown by the multinomial results (Table S4), the finding for Northern Ireland is related to the lower risk of non-marital cohabitation, which is less common in this region (ONS Citation2019). The multinomial model also shows that most ethnic minority groups (apart from the Caribbean community) present higher risks of transition into direct marriage and lower risks of cohabitation. Being religious is also related to a higher risk of transition into direct marriage and a lower (albeit not significant) risk of entering cohabitation. The presence of biological children is positively related to the risk of direct marriage and negatively to cohabitation (although most of the latter risk ratios are not significant).
Factor analysis
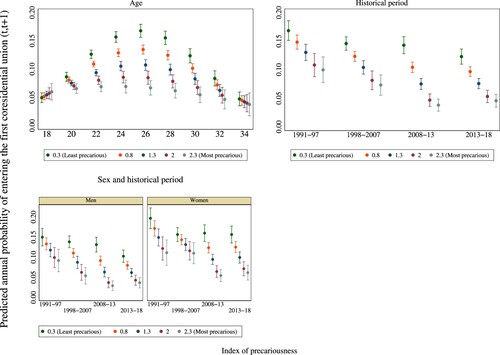
The EFA confirms that some of our indicators can be considered aspects of the same latent factor—economic precariousness—but others (co-residence with parents and financial expectations) cannot (see section S4). The loadings of the unique selected factor (Tables S6 and S7) are highest for contract type, income, occupational class, and means-tested benefits (>0.8) and moderate for financial perceptions and savings (0.5), in line with the correlation matrix. When we introduce this index within the regression model (equation (1)), we find results that are broadly in line with those based on the financial and employment indicators, especially those regarding non-employment (). The composite index of economic precariousness does not relate to the transition to first co-residential union at young and older ages (panel (a)), whereas, at middle ages, the higher the value of the index (more precarious), the lower the likelihood of union formation. We also find that the differences between precarious and less precarious individuals are more pronounced in the more recent periods than the less recent ones, especially in 2008–13 (panel (b)). Differences in patterns between sexes appear minimal (panel (c)).
Figure 7 Predicted annual probabilities of entering a first co-residential partnership from a model containing an index of precariousness: sample of never-partnered young adults aged 18–34, UK
Notes: Confidence intervals are graphed at the 84 per cent level of confidence to guarantee a correct pairwise comparison of the differences in probabilities (Goldstein and Healy Citation1995). A non-overlapping confidence interval means that the differences in the estimated means are statistically significant, on average at the 95 per cent level of confidence. The index of precariousness is computed through an exploratory factor analysis performed on a polychoric matrix with oblique rotation (see section S4 for details). Results are controlled for respondent’s sex, age, historical period, level of education, co-residence with parents, presence of children, geographical area, ethnicity, religion, and parental class. Covariates are kept at their mean value. Results for continuous age are graphed at specific ages, with two units’ distance each.
Source: As for .
Limitations and sensitivity analyses
We next discuss a series of practical limitations of our study and how we tried to address or control for them. First, to verify whether the results held even if we put several indicators in a single model, we computed a model containing all the measures of precariousness. The magnitudes of the relationships resembled those of the models considering the indicators of precariousness independently (see section S5).
Another limitation is left truncation, since some individuals joined the sample at different ages. To verify whether this sample selection could have biased the results, we restricted our analyses to those who entered the panel before age 19. The results (not shown) seemed overall to confirm those already presented.
Our analyses did not consider whether respondents had a non-resident romantic partner with whom they wished to move in, since the information about living apart together (LAT) couples was only collected from Wave 3 of the UKHLS. Therefore, we were not directly addressing whether the individual preferred singlehood in that specific moment. In a robustness check, we tested H1 on those UKHLS respondents who were in a LAT relationship at time t and intended to form a co-residential union in the following three years (see section S6a). Despite the relatively small sample (N = 2,177), patterns were consistent with H1, especially those on employment and financial measures.
Further, our analysis combined unemployed individuals with homemakers and long-term sick into one ‘not employed’ category, which represented those out of the labour force. Additional sensitivity analyses examined whether there were any differences between these subgroups. No substantial differences were found (see section S6b). We also controlled for whether the two ethnicity and immigrant boosts—the first interviewed since 2009 and the second since 2014—could have disrupted some of the patterns witnessed for historical periods, due to immigrants’ higher propensity to marry directly (results not shown). When we removed one boost at a time, our conclusions did not differ. When we removed both boosts, differences by period between non- and high earners were similar in magnitude but no longer significant.
Another limitation was that the Great Recession happened to coincide with the change from BHPS to UKHLS. Therefore, the widening relationship between precariousness and first partnership formation in the employment and financial domains during the Great Recession could have resulted from seam effects between the two surveys. Checks using only the BHPS component still highlighted the presence of this disruption on financial and employment indicators between the second and third periods. Nevertheless, this finding might have resulted from an increase in the share unemployed during the recession rather than a causal link.
Lastly, using a model whose covariates were lagged by one year compared with the outcome did not entirely resolve reverse causality, as individuals might anticipate entry into co-residential relationships by changing their economic position, leading to potential overestimation of the relationship of interest. Therefore, since events preceded by a pregnancy were more common at young ages, we explored whether the transition to first co-residential partnership could have resulted from anticipating a birth. Although we verified a strong and positive relationship between experiencing a conception and entry into partnership, all results concerning the relationship between economic precariousness and partnership formation were robust (section S6c).
We also highlight other, more theoretical, limitations. First, differential non-response could be an issue, as members of some precarious categories are more likely to be lost at follow-up. Thus, we would likely overestimate the relationship between precariousness and first co-residential partnership formation. However, we argue that differential non-response would be severely problematic only if we lost those economically precarious individuals who were more likely to form a union, which appears unlikely. Second, the type of data (yearly panel) could lead to problems of interval censoring (e.g. intermittent non-response). While we partly resolved this issue for the UKHLS, it was harder with the BHPS. Section S2 presents how we dealt with these issues. Third, since the average number of observations per individual in this sample was limited (to 3.5), we did not construct measures of persistency for all the indicators. However, since previous studies in the broader family demography literature have highlighted the importance of persistency (Ciganda Citation2015; Busetta et al. Citation2019), further research in this area is needed.
Discussion
This paper investigated the association between economic precariousness and entry into first coresidential partnership in the UK, across three main dimensions: age, historical time, and sex. Economic precariousness was defined as a lack of economic resources potentially generating insecurity in a number of different domains: employment (occupational class and contract type), financial (labour income, means-tested benefits, and savings), and housing (tenure). We also considered subjective measures: individuals’ perceptions towards the current and the future financial situation. The use of multiple separate indicators was motivated by the lack of a unique definition of precariousness in the literature (Campbell and Price Citation2016) and allowed us to achieve two different goals. One was to describe the direction and strength of trends followed by each indicator while analysing three hypotheses. Our indicators never supported our hypotheses fully (i.e. they never went in the same direction all together), thereby confirming that the indicators represent different aspects of precariousness necessitating different interpretations. The second objective was to understand whether there is one aspect best suited to describe the expected relationship between economic precariousness and partnership formation across all three dimensions.
We found that the association between economic precariousness and first co-residential union formation varies over age, consistent with previous British literature (Berrington and Diamond Citation2000). In their late teens, youth with no employment, receiving means-tested benefits, renting from a public or private institution, and/or perceiving or expecting a difficult financial situation show likelihoods of entering a first co-residential union that are similar to or higher than those of their most advantaged counterparts. Therefore, some results support the literature on the presence of a ‘fast track’, accelerating partnership formation among the most disadvantaged young Britons (Jones Citation2002; Bynner Citation2005). However, not all considered indicators fit this explanation: very young adults with low labour income or on a temporary contract are at lower risk—albeit statistically insignificant—of first co-residential union formation than those with a permanent contract or no labour income, thus suggesting that there could be a precarious class in unstable and low-paid jobs who are not following this accelerated route (O’Reilly et al. Citation2009; Roberts Citation2011).
Objective economic precariousness discourages partnership formation among individuals in their 20s and early 30s, when the likelihood of union formation is highest; however, first unions at later ages are fewer, more selected, and weakly associated with economic factors. Up to the early 30s, those not in the labour force, low earners, means-tested benefit recipients, and those living with parents present significantly lower probabilities of union formation than workers in permanent or managerial occupations, medium–high earners, those not receiving means-tested benefits, and homeowners. Despite the critical role played by income, savings are not associated with union formation. However, additional analyses showed that this result is driven by cohabitation, while savings remain an important correlate for direct marriage, confirming previous literature (Oppenheimer Citation2003).
Results on subjective indicators were more mixed, suggesting that different mechanisms regulate individuals’ subjective and objective spheres. Current financial perceptions are weakly associated with union formation, as the results only show the presence of a non-statistically significant trend suggesting that perceiving a difficult financial situation, rather than a good or ‘getting by’ one, decreases the probability of forming a first co-residential partnership. Again, the multinomial model distinguishing between cohabitation and marriage showed that the overall results resemble those for entry into cohabitation. Perceiving a difficult financial situation appears more strongly related to entry into direct marriage than into cohabitation, suggesting that direct marriage epitomizes a more long-term financial commitment in the UK (Berrington et al. Citation2015). Financial expectations present a strong relationship with union formation but, counter-intuitively, those expecting to be economically worse off in 12 months’ time show the highest predicted probability of forming a first co-residential partnership in the following year. We attribute this result to an anticipation effect of future expenses, consistent with frameworks arguing that individuals foresee the consequences of their actions before their occurrence (Bernardi et al. Citation2019; Vignoli et al. Citation2020).
The empirical findings showed that British men and women have postponed marriage and cohabitation over time (Pelikh Citation2019). Regarding H2, the evidence highlights one trend only: the non-employed and non-earners tended to show an even lower likelihood of partnership formation than their most advantaged counterparts during the period around the Great Recession (2008–13), compared with less economically turbulent periods (1991–97; 1998–2007; 2013–18). One explanation could be that, in recessionary periods, these economically precarious young adults found it harder to reach the necessary threshold to be self-sufficient and make lifelong commitments (Ranjan Citation1999; Sobotka et al. Citation2011; Watson and McLanahan Citation2011). These findings strictly reflect the results for cohabitation, thereby highlighting that recessions could discourage this partnership type too.
We also investigated whether the relationship between economic precariousness and first union has strengthened over time for women, while remaining the same for men. The only findings actively supporting H3 regard income and occupational class: among young working women, earnings and occupational class appear more important predictors of partnership formation in more recent years. For men, the relationship tends to remain stable and negative (Oppenheimer et al. Citation1997; Kalmijn Citation2011), especially for low income. These trends also fit with the evidence of an increasing proportion of couples that are homogamous or hypogamous (for women) regarding education, employment, or earnings (Esteve et al. Citation2016). However, other indicators did not align with this argument: for example, non-employment seems negatively related with partnership formation for both sexes even in the 1990s, contrary to the traditional specialization model supporting men’s breadwinner role (Becker Citation1981). Previous British evidence using the BHPS also highlighted that women might delay partnership formation under economically precarious circumstances (Francesconi and Golsch Citation2005). Probably, the educational expansion and labour market participation that started in the 1970s in the UK could already have promoted a more active role for women’s employment in partnership formation in the 1990s.
In conclusion, objective measures still appear a more immediate tool for capturing potential inequalities in current economic resources at the time of first co-residential partnership formation. However, we would not discourage the use of subjective measures, even though we found mixed results; further research is needed to examine how they interact with objective measures. Finally, we have shown that it is possible to create an index of economic precariousness that has a straightforward and significant association with partnership formation. However, we caution against using an index, as it obscures the particular form of economic precariousness that is most important.
Regarding our second objective we suggest, based on these results, that for the UK at least, labour income is the indicator that most coherently describes the expected relationship between economic precariousness and first partnership formation across all three considered dimensions: age, sex, and historical period. First, it appears to capture both the strengthening of this relationship during recessions and the increasing importance of women’s economic resources in recent times. Second, for individuals in their 20s and 30s, labour income discriminates in more detail between the economically precarious and not economically precarious than other indicators. For instance, not only non-earners but also low earners are less likely to enter a first co-residential union than medium–high earners. Labour income is, however, less suitable for identifying those who make a ‘fast track’ transition to adulthood in their teenage years; such transitions are better captured by other indicators, such as housing and means-tested benefits. Nevertheless, it also has an important property at the youngest ages: it allows an understanding of when an economically precarious condition (i.e. low labour income) could represent an impediment to union formation at these ages.
Overall, our findings highlight that financial independence remains an important marker for the establishment of an independent life course among young adults in the UK. The importance of income for young adults’ transitions to first partnership has clear policy implications, for example in terms of policies relating to minimum living wages and affordability of housing. Next steps could be to collect evidence from other contexts to spotlight potential differences and peculiarities according to welfare regimes or socio-economic conditions.
Supplementary Material
Download PDF (1.3 MB)Disclosure statement
No potential conflict of interest was reported by the authors.
Notes
1 Please address all correspondence to Lydia Palumbo, Faculty of Social Sciences, Department of Social Research & INVEST research flagship, Publicum, Assistentinkatu 7, 20014 University of Turku, Finland; or by E-mail: [email protected].
2 Funding: This research has been funded by the Max Planck Society and the Faculty of Social Sciences, University of Southampton.
3 Data set: 10.5255/UKDA-SN-6931-13.
4 This paper uses data from the British Household Panel Survey and Understanding Society, i.e. UKHLS (license granted for project 107444). Understanding Society is an initiative funded by the Economic and Social Research Council and various UK government departments, with scientific leadership by the Institute for Social and Economic Research, University of Essex, and survey delivery by NatCen Social Research and Kantar Public. The research data are distributed by the UK Data Service. https://www.understandingsociety.ac.uk/
References
- Allison, P. D. 1982. Discrete-time methods for the analysis of event histories, Sociological Methodology 13: 61–98. https://doi.org/10.2307/270718
- Barbier, J.-C. 2002. A survey of the use of the term précarité in French economics and sociology, Paris: Centre d' Étude de Emploi. Working Paper 19 (available at http://ceet.cnam.fr/medias/fichier/19-precarite-france_1508414679138-pdf?ID_FICHE=1050492&INLINE=FALSE).
- Barbier, J.-C. 2011. “Employment precariousness” in a European cross-national perspective. A sociological review of thirty years of research. Paris: Centre d' Économie de la Sorbonne. Working paper 78 (available at https://halshs.archives-ouvertes.fr/halshs-00654370/en/).
- Beaujouan, É. and M. Ní Bhrolcháin. 2011. Cohabitation and marriage in Britain since the 1970s, Population Trends 145(1): 35–59. https://doi.org/10.1057/pt.2011.16
- Becker, G. 1981. A Treatise on the Family. Cambridge, MA: Harvard University Press.
- Bell, D. N. F. and D. G. Blanchflower. 2010. UK unemployment in the Great Recession, National Institute Economic Review 214(1): R3–R25. https://doi.org/10.1177/0027950110389755
- Bernardi, L., J. Huinink, and R. A. Settersten. 2019. The life course cube: A tool for studying lives, Advances in Life Course Research 41: 100-258. https://doi.org/10.1016/j.alcr.2018.11.004
- Bergstrom, T. C., and M. Bagnoli. 1993. Courtship as a waiting game. Journal of Political Economy 101(1): 185–202. https://doi.org/10.1086/261871
- Bergstrom, T., and R. F. Schoeni. 1996. Income prospects and age at marriage. Journal of Population Economics 9(2): 115–130. https://doi.org/10.1007/PL00003834
- Berrington, A. and I. Diamond. 2000. Marriage or cohabitation: A competing risks analysis of first-partnership formation among the 1958 British birth cohort, Journal of the Royal Statistical Society: Series A (Statistics in Society) 163(2): 127–151. https://doi.org/10.1111/1467-985X.00162
- Berrington, A., B. Perelli-Harris, and P. Trevena. 2015. Commitment and the changing sequence of cohabitation, childbearing, and marriage, Demographic Research 33: 327–362. https://doi.org/10.4054/DemRes.2015.33.12
- Berrington, A. and J. Stone. 2014. Young adults’ transitions to residential independence in the UK: The role of social and housing policy, in L. Antonucci, M. Hamilton, and S. Roberts (eds), Young People and Social Policy in Europe. London: Palgrave Macmillan UK, pp. 210–235.
- Bivand, P. 2012. Generation Lost Youth Unemployment and the Youth Labour Market. London: Trade Union Congress (TUC) (available at https://www.tuc.org.uk/sites/default/files/generation_lost_touchstone_extras_2012.pdf).
- Blossfeld, H.-P. 2009. Educational assortative marriage in comparative perspective, Annual Review of Sociology 35: 513–530. https://doi.org/10.1146/annurev-soc-070308-115913
- Blossfeld, H.-P. and J. Huinink. 1991. Human capital investments or norms of role transition? How women’s schooling and career affect the process of family formation, American Journal of Sociology 97(1): 143–168. https://doi.org/10.1086/229743
- Blossfeld, H.-P. and A. Timm. 2003. (eds), Who Marries Whom?: Educational Systems as Marriage Markets in Modern Societies. Dordrecht: Springer.Series: European Studies of Population (Vol. 12).
- Bolano, D., and D. Vignoli. 2021. Union formation under conditions of uncertainty: The objective and subjective sides of employment uncertainty, Demographic Research 45: 141–186. https://doi.org/10.4054/DemRes.2021.45.5
- Bourdieu, P., A. Darbel, J.-P. Rivet and C. Seibel. 1963. Travail et travailleurs ein Algérie. The Hague and Paris: Mouton. [Adaptation in English: Bourdieu, P. 1979. The Disenchantment of the World.In R. Nice (Trans.), Algeria 1960: the disenchantment of the world, the sense of honour, the Kabyle house of the world reversed. Cambridge, UK: Cambridge University Press., pp. 1–94]
- Busetta, A., D. Mendola, and D. Vignoli. 2019. Persistent joblessness and fertility intentions, Demographic Research 40: 185–218. https://doi.org/10.4054/DemRes.2019.40.8
- Buss, D. M., T. K. Shackelford, L. A. Kirkpatrick, and R. J. Larsen. 2001. A half century of mate preferences: The cultural evolution of values, Journal of Marriage and Family 63(2): 491–503. https://doi.org/10.1111/j.1741-3737.2001.00491.x
- Bynner, J. 2005. Rethinking the youth phase of the life-course: The case for emerging adulthood?, Journal of Youth Studies 8(4): 367–384. https://doi.org/10.1080/13676260500431628
- Campbell, I. and R. Price. 2016. Precarious work and precarious workers: Towards an improved conceptualisation, The Economic and Labour Relations Review 27(3): 314–332. https://doi.org/10.1177/1035304616652074
- Cherlin, A. J., E. Cumberworth, S. P. Morgan, and C. Wimer. 2013. The effects of the Great Recession on family structure and fertility, The Annals of the American Academy of Political and Social Science 650(1): 214–231. https://doi.org/10.1177/0002716213500643
- Choonara, J. 2019. Insecurity, Precarious Work and Labour Markets. Insecurity, Precarious Work and Labour Markets. London: Palgrave Macmillan.
- Choonara, J. 2020. The precarious concept of precarity, Review of Radical Political Economics 52(3): 427–446. https://doi.org/10.1177/0486613420920427
- Ciganda, D. 2015. Unstable work histories and fertility in France: An adaptation of sequence complexity measures to employment trajectories, Demographic Research 32: 843–876. https://doi.org/10.4054/DemRes.2015.32.28
- Comolli, C. L. 2017. The fertility response to the Great Recession in Europe and the United States: Structural economic conditions and perceived economic uncertainty, Demographic Research 36: 1549–1600. https://doi.org/10.4054/DemRes.2017.36.51
- Comolli, C. L. and D. Vignoli. 2019. Spread-ing uncertainty, shrinking birth rates, Econometrics Working Papers Archive 2019/08. Florence: Universita’ degli Studi di Firenze, Dipartimento di Statistica, Informatica, Applicazioni ‘G. Parenti’.
- Corijn, M. and E. Klijzing (eds). 2001. Transitions to Adulthood in Europe. Dordrecht: Springer European Studies of Population (vol. 10).
- Datta, N., G. Giupponi, and S. Machin. 2019. Zero-hours contracts and labour market policy, Economic Policy 34(99): 369–427. https://doi.org/10.1093/epolic/eiz008
- Dolphin, T. 2012. Young People and Savings: A Route to Improved Financial Resilience. London: Institute for Public policy Research Report. (IPRR) (available at https://www.ippr.org/files/images/media/files/publication/2012/11/young-people-savings_Nov2012_9849.pdf).
- Ermisch, J. 2003. An Economic Analysis of the Family. Princeton, NJ: Princeton University Press.
- Ermisch, J. and M. Francesconi. 2000. Cohabitation in Great Britain: Not for long, but here to stay, Journal of the Royal Statistical Society 163(2): 153–171. https://doi.org/10.1111/1467-985X.00163
- Esteve, A., C. Schwartz, J. Van Bavel, I. Permanyer, M. Klesment, and J. Garcia. 2016. The end of hypergamy: Global trends and implications, Population and Development Review 42(4): 615–625. https://doi.org/10.1111/padr.12012
- Francesconi, M. and K. Golsch. 2005. The process of globalization and transitions to adulthood in Britain, in H. Blossfeld, E. Klijzing, M. Mills and K. Kurz (eds), Globalization, Uncertainty and Youth in Society: The Losers in a Globalizing World. London: Routledge, pp. 255–284.
- Friedman, D., M. Hechter, and S. Kanazawa. 1994. A theory of the value of children, Demography 31(3): 375–401. https://doi.org/10.2307/2061749
- Furlong, A., J. Goodwin, H. O’Connor, S. Hadfield, S. Hall, K. Lowden, and R. Plugor. 2017. Young People in the Labour Market: Past, Present, Future. London: Routledge.
- Gallie, D. (ed.). 2013. Economic Crisis, Quality of Work, and Social Integration. Oxford: Oxford University Press.
- Goldstein, H. and M. J. R. Healy. 1995. The graphical presentation of a collection of means, Journal of the Royal Statistical Society. Series A (Statistics in Society) 158(1): 175–177. https://doi.org/10.2307/2983411
- Goldstein, J., D. D. Karaman Örsal, M. Kreyenfeld, and A. Jasilioniene. 2013. Fertility reactions to the "Great Recession" in Europe, Demographic Research 29: 85–104. https://doi.org/10.4054/DemRes.2013.29.4
- Guetto, R., D. Vignoli, and G. Bazzani. 2021. Marriage and cohabitation under uncertainty: The role of narratives of the future during the COVID-19 pandemic, European Societies 23(S1): S674–S688. https://doi.org/10.1080/14616696.2020.1833359
- Institute for Social and Economic Research. 2019. Understanding society: Waves 1–9, 2009–2018 and harmonised BHPS: Waves 1–18, 1991–2009. Special Licence Access. [data collection]. 12th ed. UK Data Service. SN: 6931. (Data downloaded in November 2019).
- Jalovaara, M. 2012. Socio-economic resources and first-union formation in Finland, cohorts born 1969–81. Population Studies 66(1): 69–85. https://doi.org/10.1080/00324728.2011.641720
- Jones, G. 2002. The Youth Divide: Diverging Paths into Adulthood. New York, UK: Joseph Rowntree Foundation (available at https://www.jrf.org.uk/sites/default/files/jrf/migrated/files/1842630814.pdf)
- Kalleberg, A. L. 2018. Precarious Lives: Job Insecurity and Well-Being in Rich Democracies. Cambridge, UK: Polity Press.
- Kalmijn, M. 2011. The influence of men’s income and employment on marriage and cohabitation: Testing oppenheimer’s theory in Europe, European Journal of Population 27(3): 269–293. https://doi.org/10.1007/s10680-011-9238-x
- Kaminska, O. and P. Lynn. 2019. Weighting and Sample Representation: Frequently Asked Questions (No. 2010-05). Colchester: Institute for Social and Economic Research. https://www.understandingsociety.ac.uk/sites/default/files/downloads/general/weighting_faqs.pdf
- Kiernan, K. 2002. Cohabitation in Western Europe: Trends, issues, and implications, in A. Booth and C. Crowter (eds), Just Living Together: Implications of Cohabitation for Children, Families, and Social Policy. Mahwah, NJ: Lawrence Erlbaum Associates Publishers, pp. 3–31.
- Klesment, M. and J. Van Bavel. 2017. The reversal of the gender gap in education, motherhood, and women as main earners in Europe, European Sociological Review 33(3): 465–481. https://doi.org/10.1093/esr/jcw063
- Kreyenfeld, M. 2015. Economic uncertainty and fertility, KZfSS – Kölner Zeitschrift Für Soziologie Und Sozialpsychologie [Cologne Journal for Sociology and Social Psychology] 67(S1): 59–80. https://doi.org/10.1007/s11577-015-0325-6
- Leonard, P. and R. J. Wilde. 2019. Getting in and Getting on in the Youth Labour Market : Governing Young Peoples Employability in Regional Context. Bristol: Policy Press.
- Matsaganis, M., N. Rabemiafara, and T. Ward. 2013. Young People and Temporary Employment in Europe. Dublin: European Foundation for the Improvement of Living and Working Conditions. https://www.eurofound.europa.eu/observatories/emcc/comparative-information/young-people-and-temporary-employment-in-europe
- McKnight, A., K. Stewart, S. M. Himmelweit, and M. Palillo. 2016. Low Pay and in-Work Poverty: Preventative Measures and Preventative Approaches. Evidence Review Prepared for European Commission DG for Employment, Social Affairs and Inclusion. Luxemburg: Publications office of the European Union. https://doi.org/10.2767/43829
- Mills, M. and H.-P. Blossfeld. 2005. Globalization, uncertainty and the early life course. A theoretical framework, in H.-P. Blossfeld, M. Mills, E. Klijzing, and K. Kurz (eds), Globalization, Uncertainty and Youth in Society. Routledge, pp. 1–23.
- Ní Bhrolcháin, M. and É. Beaujouan. 2013. Education and cohabitation in Britain: A return to traditional patterns?, Population and Development Review 39(3): 441–458. https://doi.org/10.1111/j.1728-4457.2013.00611.x
- Office for National Statistics (ONS). 2013. Women in the Labour Market. https://www.ons.gov.uk/employmentandlabourmarket/peopleinwork/employmentandemployeetypes/articles/womeninthelabourmarket/2013-09-25 (accessed: 22 May 2019).
- Office for National Statistics (ONS). 2018. How Well Are You Doing Compared With Other Young People? https://www.ons.gov.uk/peoplepopulationandcommunity/personalandhouseholdfinances/incomeandwealth/articles/howwellareyoudoingcomparedwithotheryoungpeople/2018-10-04 (accessed: 12 February 2019).
- Office for National Statistics (ONS). 2019. Families and Households in the UK. https://www.ons.gov.uk/peoplepopulationandcommunity/birthsdeathsandmarriages/families/bulletins/familiesandhouseholds/2019 (accessed: 27 June 2021).
- Oppenheimer, V. K. 1988. A theory of marriage timing, American Journal of Sociology 94(3): 563–591. https://doi.org/10.1086/229030
- Oppenheimer, V. K. 2003. Cohabiting and marriage during young men’s career-development process, Demography 40(1): 127–149. https://doi.org/10.1353/dem.2003.0006
- Oppenheimer, V. K., M. Kalmijn, and N. Lim. 1997. Men’s career development and marriage timing during a period of rising inequality, Demography 34(3): 311–330. https://doi.org/10.2307/3038286
- Oppenheimer, V. K. and V. Lew. 1995. American marriage formation in the 1980s: How important was women's economic independence?, in K. Oppenheim Mason and A. M. Jensen (eds), Gender and Family Change in Industrialised Countries. New York: Clarendon Press, pp. 105–138.
- O’Reilly, J., J. MacInnes, T. Nazio, and J. M. Roche. 2009. The United Kingdom: From flexible employment to vulnerable workers, in L. Vosko, M. MacDonald, and I. Campbell (eds), Gender and the Contours of Precarious Employment. London: Routledge, pp. 108–126.
- Pelikh, A. 2019. Transition to Adulthood in England and Wales: The Analysis of Life Trajectories of Young Adults. Liverpool: University of Liverpool.
- Pitrou, A. 1978. La vie précaire des familles face à leurs difficultés [The precarious life of families in front of their difficulties]. Paris: Caisse Nationale Des Allocations Familiales. Études CNAF.
- Platt, L. and A. Nandi. 2020. Ethnic diversity in the UK: New opportunities and changing constraints, Journal of Ethnic and Migration Studies. https://doi.org/10.1080/1369183X.2018.1539229
- Raley, R. K. 2000. Recent trends and differentials in marriage and cohabitation: The United States, in M. Hindin, L. J. Waite, C. Bachrach, E. Thomson, and A. Thornton (eds), The Ties That Bind: Perspectives on Marriage and Cohabitation, New York: Aldine de Gruyter, pp. 19–39.
- Ranjan, P. 1999. Fertility behaviour under income uncertainty, European Journal of Population / Revue Européenne de Démographie 15(1): 25–43. https://doi.org/10.1023/A:1006106527618
- Roberts, S. 2011. Beyond ‘NEET’ and ‘tidy’ pathways: Considering the ‘missing middle’ of youth transition studies, Journal of Youth Studies 14(1): 21–39. https://doi.org/10.1080/13676261.2010.489604
- Rubery, J. 1989. Precarious forms of work in the United Kingdom, in G. Rodgers and J. Rodgers (eds), Precarious Jobs in Labour Market Regulation: The Growth of Atypical Employment in Western Europe. Geneva: International Labour Organisation, pp. 49–74.
- Sassler, S., F. Addo, and E. Hartmann. 2010. The tempo of relationship progression among low-income couples, Social Science Research 39(5): 831–844. https://doi.org/10.1016/j.ssresearch.2010.06.001
- Sassler, S. and A. J. Miller. 2017. Cohabitation Nation : Gender, Class, and the Remaking of Relationships. Oakland, CA: University of California Press.
- Schneider, D. 2017. The effects of the Great Recession on American families, Sociology Compass 11(4): e12463. https://doi.org/10.1111/soc4.12463
- Schwartz, C. R. 2013. Trends and variation in assortative mating: Causes and consequences, Annual Review of Sociology 39(1): 451–470. https://doi.org/10.1146/annurev-soc-071312-145544
- Sealey, C. 2014. Social exclusion, risk and the UK youth labour market, in L. Antonucci, M. Hamilton, and S. Roberts (eds.) Young People and Social Policy in Europe. London: Palgrave Macmillan, pp. 87–105.
- Singer, J. D. and J. B. Willett. 2003. Applied Longitudinal Data Analysis: Modeling Change and Event Occurrence. New York: Oxford University Press.
- Sironi, M. and F. F. Furstenberg. 2012. Trends in the economic independence of young adults in the United States: 1973-2007, Population and Development Review 38(4): 609–630. https://doi.org/10.1111/j.1728-4457.2012.00529.x
- Sobotka, T., V. Skirbekk, and D. Philipov. 2011. Economic recession and fertility in the developed world, Population and Development Review 37(2): 267–306. https://doi.org/10.1111/j.1728-4457.2011.00411.x
- Standing, G. 2011. The Precariat : The New Dangerous Class. London: Bloomsbury Academics.
- Standing, G. 2014. A Precariat Charter : From Denizens to Citizens. London: Bloomsbury Academic.
- StataCorp. 2019a. Stata 16 Base Reference Manual: Margins. College Station, TX: Stata Press. https://www.stata.com/manuals/rmarginsplot.pdf
- StataCorp. 2019b. Stata 16 Base Reference Manual: Marginsplot. College Station, TX: Stata Press. https://www.stata.com/manuals/rmargins.pdf#rmargins
- StataCorp. 2021. Stata Statistical software: release 17, College Station, TX: StataCorp LLC.
- Steele, F. 2005. Event history analysis, NCRM Methods Review Paper (NCRM/004). Bristol: ESRC National Centre for Research Methods (available at https://eprints.ncrm.ac.uk/id/eprint/4467/1/MethodsReviewPaperNCRM-004.pdf).
- Stone, J., A. Berrington, and J. Falkingham. 2011. The changing determinants of UK young adults’ living arrangements, Demographic Research 25: 629–666. https://doi.org/10.4054/DemRes.2011.25.20
- Stone, J., A. Berrington, and J. Falkingham. 2014. Gender, turning points, and boomerangs: Returning home in young adulthood in Great Britain, Demography 51(1): 257–276. https://doi.org/10.1007/s13524-013-0247-8
- Sweeney, M. M. and M. Cancian. 2004. The changing importance of white women’s economic prospects for assortative mating, Journal of Marriage and Family 66: 1015–1028. https://doi.org/10.1111/j.0022-2445.2004.00073.x
- Tocchioni, V., A. Berrington, D. Vignoli, and A. Vitali. 2021. The changing association between homeownership and the transition to parenthood, Demography 58(5): 1843–1865. https://doi.org/10.1215/00703370-9420322
- UKHLS Support Forum. 2013. Support #228: Wave 3 equivalent of b_indscbh_xw - Understanding Society User Support. https://iserredex.essex.ac.uk/support/issues/228 (accessed: 16 January 2022).
- Understanding Society. 2022. Interview and Fieldwork Process. https://www.understandingsociety.ac.uk/documentation/mainstage/user-guides/main-survey-user-guide/interview-and-fieldwork-process (accessed: 19 January 2022).
- Van Bavel, J. 2018. What do men want? The growing importance of men’s characteristics for fertility, Vienna Yearbook of Population Research 1: 41–47. https://doi.org/10.1553/populationyearbook2017s041
- Van De Kaa, D. J. 1987. Europe’s second demographic transition, Population Bulletin 42(1): 1–59.
- Vignoli, D., G. Bazzani, R. Guetto, A. Minello, and E. Pirani. 2020. Uncertainty and narratives of the future: A theoretical framework for contemporary fertility, in R. Schoen (ed.), Analyzing Contemporary Fertility. Cham: The Springer Series on Demographic Methods and Population Analysis (Vol. 51), pp. 25–47.
- Watson, T. and S. McLanahan. 2011. Marriage meets the Joneses: Relative income, identity, and marital status, Source: The Journal of Human Resources 46(3): 482–517. https://doi.org/10.3368/jhr.46.3.482
Appendix
Table A1 Descriptive statistics for individual control variables: sample of never-partnered young adults aged 18–34, UK