
Abstract
The Brazilian period total fertility rate (PTFR) dropped to 1.8 in 2010 (1.5 among those with high education). Due to shifts in fertility timing, the PTFR may provide a misleading picture of fertility levels. The consequences of these changes for the cohort total fertility rate (CTFR)—a measure free from tempo distortions—and for educational differences in completed fertility remain unknown. Due to data limitations, CTFR forecasts in low- and middle-income countries are rare. We use Brazilian censuses to reconstruct fertility rates indirectly and forecast the CTFR for all women and by educational level. Four forecasting methods indicate that the CTFR is unlikely to fall to the level of the PTFR. Educational differences in the CTFR are likely to be stark, at 0.7–0.9, larger than in many high-income countries with comparable CTFRs. We show how the CTFR can be forecasted in settings with limited data and call for more research on educational differences in completed fertility in low- and middle-income countries.
Introduction
From the 1950s to 2010, the period total fertility rate (PTFR) in Brazil plummeted from above 6.00 to 1.76 (Castanheira and Kohler Citation2016). As a result of this sharp decline, Brazil became the first, out of all countries in Latin America that have experienced rapid fertility declines since the 1950s, to reach low fertility levels (Chackiel and Schkolnik Citation1996). This development has led to concerns being raised about the potential implications of Brazil’s below-replacement fertility for the country’s population age structure and for the sustainability of its intergenerational relationships (Goldani Citation2002; Castanheira and Kohler Citation2016).
It is well known that period fertility measures can be subject to fluctuations due to changes in fertility timing: so-called tempo effects (Bongaarts and Feeney Citation1998). If women are advancing or postponing motherhood, the PTFR can be inflated or depressed, even if the number of children women have over their lifespan is not changing. In many European and East Asian countries, parenthood postponement was one of the drivers of very low period fertility during the 1990s and of the subsequent rebounds in the PTFR during the 2000s (Kohler et al. Citation2002; Goldstein et al. Citation2009). Due to shifts towards later childbearing, cohort fertility indicators in these settings have been higher than period fertility indicators (Myrskylä et al. Citation2013). This is because the cohort total fertility rate (CTFR) measures the average number of children women have during their lifetime and is free from the impact of tempo distortions. Consequently, a growing number of studies have focused on examining and forecasting cohort fertility in order to provide a more comprehensive picture of changes in fertility levels. However, these detailed studies on cohort fertility (e.g. Hellstrand et al. Citation2020, Citation2021) have focused on high-income countries (HICs), such as Finland and other Nordic settings.
While the future of fertility in low- and middle-income countries (LMICs) where fertility has declined rapidly (e.g. Brazil) is being increasingly debated, the research on fertility in these countries has thus far been dominated by studies of the PTFR, and there have been few attempts to study and forecast cohort fertility. However, given recent changes in the timing of motherhood, it is becoming increasingly important to take the limitations of period fertility measures into account. In Brazil, a reversal of previously pervasive increases in teenage fertility started to occur in the 2000s, and women started to postpone motherhood (Rosero-Bixby et al. Citation2009; Rios-Neto et al. Citation2018). Currently, we have only a limited understanding of whether the continued declines in period fertility observed in Brazil will translate into decreases in the average number of children women have throughout their lifetime.
Moreover, one of the most notable features of fertility patterns in LMICs, including those in Latin America, is the large disparities in reproductive behaviour by educational level. Because social and economic inequality is high in Brazil, some have argued that different population strata in the country are at distinct stages of fertility transition (Miranda-Ribeiro and Garcia Citation2013). The stark polarization of reproductive behaviour has been reflected in uneven changes in the PTFR, which has been below replacement level since the 1990s among women with at least one year of secondary education but above 2.00 children per woman in 2010 among those with less than secondary school education (Berquó and Cavenaghi Citation2005, Citation2014; Cavenaghi and Berquó Citation2014). Examinations of cohort fertility in HICs have shown that in these countries, there have been important shifts in the associations between education, timing of childbearing, and fertility levels, as well as substantial variation in completed fertility by educational level between and within countries (e.g. Yoo Citation2014; Berrington et al. Citation2015; Jalovaara et al. Citation2019; Nisén et al. Citation2021). Moreover, focusing on European countries, Nisén et al. (Citation2021) suggested that settings characterized by lower levels of development tend to report larger differences in completed fertility by educational level. Although it is clear that there are pronounced disparities in reproductive behaviour by socio-economic status, there has been little research on educational differences in completed fertility in LMICs or specifically in Brazil (Rios-Neto et al. Citation2018). Moreover, to the best of our knowledge, no previous study has attempted to forecast cohort fertility disaggregated by educational level in LMICs with low fertility. Performing such an analysis could enhance our knowledge about the relationship between the level of development and the educational gradient in completed fertility.
The aim of this study is to make a novel contribution by forecasting cohort fertility for the total female population and by educational level in Brazil. In doing so, we address one of the main barriers to cohort fertility forecasting in LMICs: namely, a scarcity of published estimates of fertility rates disaggregated by single age and year, which are among the inputs necessary for such forecasts. The forecasting of fertility by educational level is particularly challenging because there are no available, detailed fertility data series disaggregated by measures of education. In this study, we use data from four rounds of censuses conducted between 1980 and 2010 that are available through the International Public Use Microdata Series (from IPUMS International), and we use indirect estimation techniques to reconstruct long-term series of detailed fertility rates, both for the total female population and by educational level. To the best of our knowledge, there have been no previous attempts to examine the potential of using IPUMS data to estimate long-term time series of fertility rates disaggregated by single age and year.
In the following, we forecast completed fertility for women born between 1967 and 1984, including by educational level, using four methods: a simple freeze rate method; a method based on the five-year extrapolation of age-specific fertility rates (ASFRs) (Myrskylä et al. Citation2013); a Bayesian model developed by Schmertmann et al. (Citation2014); and a Bayesian model proposed by Ellison et al. (Citation2020). Previous large-scale evaluations of the accuracy of different forecasting methods have shown that the simple freeze rate method outperforms most other forecasting approaches and that the limited extrapolation method developed by Myrskylä et al. (Citation2013) and the Bayesian method proposed by Schmertmann et al. (Citation2014) are among the best-performing methods (Bohk-Ewald et al. Citation2018). We also apply the Bayesian method put forward by Ellison et al. (Citation2020). This is the forecasting approach most recently proposed in the literature, and the authors claim that it performs as well as the other three methods. We present the results obtained from the four forecasting approaches, allowing us to provide the most comprehensive examination to date of future cohort fertility developments in a middle-income country with low fertility. To the best of our knowledge, we are also the first to do so for subpopulations according to educational level.
Fertility and timing of childbearing in Brazil
The rapid decline in the PTFR in Brazil since the 1950s has been attributed to a number of factors. These include: social and economic transformations, such as urbanization, and growing women’s labour market participation (Carvalho and Rodríguez Wong Citation1996; Martine Citation1996); changes in values and attitudes due to, among other factors, the spread of mass communication and TV, including the popularity of soap operas (Rios-Neto et al. Citation1998; Ferrara et al. Citation2012); and the specificity of the contraceptive method mix in Brazil, with ‘limiting’ methods such as sterilization being the main method of birth control (Potter Citation1999; Leone Citation2002; Caetano and Potter Citation2004).
Brazil provides clear evidence of the validity of the ideational theory of fertility decline, as the shift in fertility was observed first among the most privileged urban social groups in the most developed parts of the country. For example, in Rio de Janeiro and Sao Paulo, fertility decline started as early as the 1930s; since the 1960–70s, the decline rapidly spread across the whole country (Carvalho and Rodríguez Wong Citation1996; Rios-Neto Citation2000; Gonçalves et al. Citation2019). PTFRs have been falling among all social classes, in both urban and rural areas and across all states, with the highest socio-economic strata leading the trend. Nevertheless, differences in reproductive behaviour between population groups have persisted. By the 1990s, the PTFR had already fallen below replacement level among women with at least one year of secondary education and for women with higher earnings. Among women who had not attended secondary school or with lower household income levels, the PTFR remained above 2.0 in 2010 (Berquó and Cavenaghi Citation2005, Citation2014; Cavenaghi and Berquó Citation2014). Thus, in Brazil, educational differences in fertility levels remain large.
During the 1990s, the uninterrupted decline in fertility in Brazil took place in the context of increases in teenage fertility and decreases in average age at first birth. The trend towards earlier motherhood was observed among all population groups but was most prominent among women with lower levels of schooling who belonged to poorer population groups (Rodríguez Vignoli Citation2013; Martins Citation2016). This development highlights the role of education in shaping not only fertility levels but also fertility timing. Although there is no clear-cut explanation for this unique phenomenon, the reasons for the rejuvenation of the fertility pattern in Brazil, and Latin America more broadly, have been discussed extensively in the literature. While some studies have suggested factors such as limited access to contraception and increasing levels of unintended childbearing, other researchers have pointed to the effects of poverty, limited social mobility, and the low opportunity costs of early motherhood (Azevedo et al. Citation2012; Marteleto and Dondero Citation2013; Rodríguez Vignoli Citation2014, Citation2017).
A number of studies have shown that the trend towards earlier motherhood reversed during the 2000s. Teenage fertility in Brazil decreased for the first time between 2000 and 2010 (Verona Citation2018). According to Miranda-Ribeiro and Garcia (Citation2013), after a steady decline starting in the 1980s, the mean age of childbearing and mean age at first birth increased in Brazil between 2000 and 2010. The onset of the postponement transition in Brazil has been discussed in Rios-Neto et al. (Citation2018). This study, along with other research on the topic, suggested that the retreat from early childbearing has been most pronounced among more educated women (Rosero-Bixby et al. Citation2009; Lima et al. Citation2018). Thus, to understand the course of fertility change in these settings, it is becoming increasingly necessary to go beyond a reliance on fertility measures that are prone to tempo distortions. It is also important to take into account variations in fertility behaviour by socio-economic status.
Impact of changes in the timing of fertility on period and cohort fertility in Brazil
Previous attempts to examine the effects of the changes in the timing of childbearing on fertility levels in Brazil have focused on applying TFR tempo-adjustment methods (Miranda-Ribeiro et al. Citation2008; Rios-Neto and Miranda-Ribeiro Citation2015). These studies suggested that changes in the timing of childbearing were responsible for, first, an inflating TFR tempo effect between the late 1980s and 2000s and, subsequently, a deflating TFR tempo effect between 2005 and 2010. A well-known limitation of the tempo-adjusted TFR is that it is a synthetic indicator and thus does not allow the possible levels of fertility of real cohorts of women to be examined. By contrast, cohort fertility measures correspond to women’s actual fertility experiences. Thus, these measures can be used to examine whether women are having more or fewer children over their lifespan, and the interpretation of these measures is straightforward.
Previous studies that have examined the future of cohort fertility in Brazil have shown that the CTFR decreased among women born between 1950 and 1965, from around 3.5 to 2.5 (Schmertmann et al. Citation2014; Miranda-Ribeiro et al. Citation2017). The Bayesian forecast by Schmertmann et al. (Citation2014) suggested that the CFR for women born between 1975 and 1985 was likely to plateau at around 2.2 children per woman. These results are different from the forecast by Miranda-Ribeiro et al. (Citation2017) using ARIMA models; their findings suggested that the CTFR could continue to decrease, to around 1.7 for women born in 1980. Thus, our knowledge about future cohort fertility developments in Brazil is still limited. Moreover, forecasts of cohort fertility by educational level are lacking, and this leaves a gap in our understanding of the plausible course of educational differentials in cohort fertility.
Data
This study uses microdata from the Brazilian Population and Housing Censuses conducted in 1980, 1991, 2000, and 2010. These data come from IPUMS (Minnesota Population Center Citation2017). IPUMS provides harmonized census samples, which are well suited for the analysis of demographic phenomena over time. We reconstruct the time series of period ASFRs by single age and year, as well as by educational level. The rates are calculated for women of reproductive age (15–49) for the years 1966–2010, using the information about women aged 15–64 from each of the censuses. The details about the census microdata samples used in this study are in .
Table 1 IPUMS census microdata sample sizes and number of women aged 15–64 in each sample, plus period for which ASFRs are reconstructed from each census: Brazil
We estimate the time series of ASFRs using the own children method (OCM) (Cho et al. Citation1986). The OCM is an indirect technique that can be applied to estimate fertility rates in settings where vital registration data and/or birth histories from surveys are unavailable. This method has previously been used to reconstruct trends in ASFRs in Brazil (Lima Citation2013), but the rates have been aggregated into five-year age groups. The fertility forecasting methods we use here require ASFRs disaggregated by single age and year. Although aggregated rates can be split into more granular estimates using smoothing or interpolation techniques, in this paper we use the OCM to estimate rates directly for single age and year groups, using the raw data for the analysis. We prefer this approach for two reasons. First, no additional data manipulation, such as smoothing or interpolation, is necessary. This avoids the risk of the data being over-adjusted or over-smoothed due to the initial grouping and subsequent disaggregation of the rates. The question of how this kind of data manipulation influences fertility trends cannot be answered if the disaggregated estimates are unavailable. Second, this approach allows us to assess the quality of the raw, single-age estimates, as we discuss in the next paragraphs. The advantage of the OCM over other fertility reconstruction techniques (e.g. a method developed by Miranda-Ribeiro [Citation2007]) is that it is more straightforward to implement using available programmes: for example, the FERT software developed by the East–West Center (Citation1992) or the programme written by Lwendo and Levin (Citation2017) that we use in this paper. Next, we describe the input data that are needed to reconstruct fertility trends using the OCM for Brazil. The analysis is performed in two stages.
First, our method involves matching the children (aged 0–14) enumerated in the census to their mothers (women aged 15–64), if they live in the same household. The method allows for the estimation of fertility trends for the period of 15 years prior to the census for women aged 15–49. It is conventionally assumed that a large percentage of children will be living in the same household as their mother up to age 15 (Cho et al. Citation1986). The IPUMS data are well suited to OCM estimation because they include the Constructed Family Interrelationship module. We use two variables that together allow us to identify children’s biological mothers and stepmothers: (1) ‘momloc’ (mother’s position in the household); and (2) ‘stepmom’ (probable stepmother). The matched children (‘own’ children of biological mothers) are then classified according to their age and the age of their mother, in order to generate a mother–child matrix. This matrix also includes the number of children who cannot be matched to any woman (‘non-own’ children), by age.
Second, the non-own children of a given age are redistributed proportionally among women according to the distribution of own children by age of woman. We make adjustments for under-enumeration in the census based on the information published by the Brazilian Statistical Office (IBGE Citation2008). Next, both children and mothers are reverse-survived to estimate two quantities for each of the 15 years prior to the census: (1) the number of births by woman’s age; and (2) the number of women by age. For the reverse survival, we use information about life expectancy at birth for each year 1966–2010 as published by the World Bank (Citation2020). These estimates are based on annual estimates from the United Nations Population Division that are interpolated from five-year period data. We compare these estimates with those published by the Brazilian Statistical Office for periods for which estimates are available (IBGE Citation2010a). The estimates from these sources are consistent. To obtain a mortality pattern from the information on life expectancy at birth for each year preceding the census, we use the ‘West’ Coale–Demeny model life table (UNDESA Citation1982). Finally, the ASFRs for each year are calculated by dividing the number of reverse-survived births by the number of reverse-survived women.
The OCM has several key limitations (Brass Citation1975; Retherford et al. Citation1979; Cho et al. Citation1986). Trends in fertility estimated using the OCM may be distorted by misreporting of women’s or children’s ages. Estimates may be biased by migration and by the fact that the fertility of surviving women may be different from that of deceased women. The assumption that a large percentage of children live in the same household as their mother might not hold in settings with high levels of orphanhood or union dissolution. In Brazilian censuses, the percentage of children who cannot be matched to their mother ranges from 3 per cent for those aged 0 at the 1991 Census to 17 per cent for those aged 14 at the 2010 Census. These percentages are of similar magnitude to those found in other settings and consistent with previous knowledge that they increase with children’s age. Although the presence of non-own children can bias fertility estimates, these biases have been shown to be small (Cho et al. Citation1986; Abbasi-Shavazi Citation1997; Timæus Citation2021).
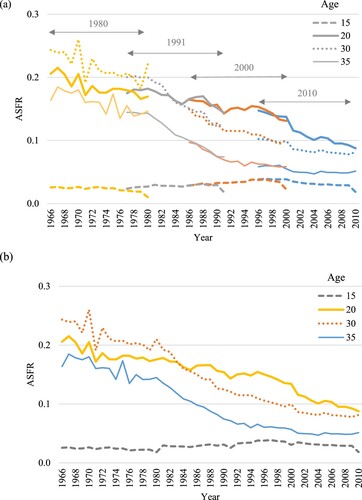
One of the ways to assess the existence of such biases is to compare overlapping retrospective estimates from two censuses (Cho et al. Citation1986). Since censuses in Brazil have been conducted every 10 years, it is possible to compare the estimates from two census rounds for a five-year period. If the data are affected by age misreporting or other sources of bias, the trends between the two censuses will overlap poorly. However, we find that the agreement between rates from each of the two pairs of censuses is very good ((a)). This check gives us confidence that the age-specific trends do not show systematic inconsistencies that could affect the results of further analysis. For the years for which overlapping estimates exist, we combine them as follows. We sum the number of reverse-survived births to women aged x in year t from two censuses and divide them by the sum of the number of reverse-survived women aged x exposed to the risk of birth in year t from two censuses ((b)). A similar approach has previously been used to combine overlapping estimates from surveys (Cetorelli Citation2014).
Figure 1 Trends in period ASFRs at selected ages, Brazil, 1966–2010: (a) raw data from the 1980, 1991, 2000, and 2010 Censuses; and (b) combined census data
Note: Data refer to all women in Brazil and are not split by educational level.
Source: Authors’ calculations from the 1980, 1991, 2000, and 2010 Censuses in Brazil using microdata from IPUMS (Minnesota Population Center Citation2017); own children method estimates.
While the procedure for reconstructing ASFRs by educational level using the OCM is the same as for all women, two additional aspects need to be considered when education is included. First, when fertility trends are estimated by socio-economic characteristics, the OCM method is based on the assumption that the value of a given characteristic at the time of the census applies to the time period for which the rates are reconstructed (Rindfuss and Sweet Citation1977). Thus, this method should be used with caution when disaggregating trends by characteristics that might change over time. In the case of education, women might progress to higher educational levels after the beginning of the reproductive period. For that reason, we group women into two educational groups that are not very likely to change after age 15 but that still provide an informative distinction between women with lower and higher levels of schooling. The first group is made up of women with no education or who have completed primary school only (up to eight years of schooling), while the second group consists of women who have completed at least the first year of secondary school (nine or more years of schooling). Throughout this study, these groups are referred to as the ‘low’ and ‘high’ educational groups, respectively. The rationale for this division is that in Brazil, students start primary school at the age of seven and graduate at the age of 15. This classification aims to minimize the problem of the subsequent progression to higher educational levels among the youngest women. It means that we are unable to disaggregate the trends by more detailed educational groups, for example for women who have entered university. However, this division is still relevant for examining the changes in the PTFR and CTFR in Brazil because it captures the social status disparities in fertility well and points to a similar gradient as with a more detailed classification. It also allows us to capture the two subpopulations of women, one with fertility above and one with fertility below replacement level. Further details regarding the estimation of ASFRs by educational level and the classification of educational levels are described in the supplementary material (Appendices 1 and 4).
The second aspect to consider is that to the best of our knowledge, for the period covered by this analysis, neither detailed life tables nor estimates of life expectancy at birth are available for educational groups in Brazil. We therefore assume that the mortality pattern is the same among all individuals. We conduct a sensitivity analysis to examine how the results would change if differentiated patterns of mortality between educational groups were assumed (see supplementary material, Appendix 2). The differences in the reconstructed trends in fertility are small, and the main conclusions of this study remain unchanged. These findings are consistent with previous analyses that showed the OCM to be insensitive to mortality assumptions (Retherford et al. Citation1980; Cho et al. Citation1986; Scalone and Dribe Citation2017).
Overall, the PTFR estimates based on the reconstructed ASFRs align with the existing PTFR estimates for each census year for the total female population (IBGE Citation2010b) and for women with nine or more years of schooling (Rios-Neto et al. Citation2018) (see supplementary material, Appendix 3). We are unable to identify any studies that have estimated the PTFR for women with less than nine years of schooling. Usually, rates are estimated for more detailed educational categories, and this does not allow us to conduct direct comparisons with existing estimates.
Methods
We use the estimated time series of ASFRs for the years 1966–2010 to calculate PTFRs. Combining these trends in period ASFRs from four censuses allows for the reconstruction of the entire age-specific fertility schedules and thus CTFRs for women born between 1951 and 1966. We consider the fertility experience of a cohort to be complete at the age of 44, since few births occur beyond that age (Frejka and Sardon Citation2004). For consistency, PTFRs are also calculated for the 15–44 age group. For women born after 1966, the full fertility schedules are unknown, and so we forecast the ASFRs and CTFRs for these cohorts using approaches described next. Fertility forecasts are usually limited to women who are at least 30 years old at the time of the forecast (Myrskylä et al. Citation2013; Hellstrand et al. Citation2020, Citation2021) because forecast uncertainty (and the risk of forecast error) increases for younger women. Consequently, although we show CTFR forecasts for women born up to 1984 (26 years old at the forecast in 2010), we mainly discuss forecasts for women born up to 1980 (30 years old at the forecast in 2010) due to the high degree of uncertainty inherent in forecasting the fertility of younger women.
We apply four forecasting methods: a simple freeze rate method, a method based on five-year extrapolation of the ASFRs (Myrskylä et al. Citation2013), a Bayesian model developed by Schmertmann et al. (Citation2014), and a Bayesian model proposed by Ellison et al. (Citation2020). All these methods require ASFRs by single age and year but are based on different assumptions. The simple freeze rate method assumes that the most recent ASFRs will remain constant for subsequent cohorts. It involves freezing a given age-specific rate at its last observed value and assuming that the fertility rates at a given age for cohorts with incomplete schedules will be the same as those for the last cohort with the observed fertility rate. The method based on the five-year extrapolation assumes that recent trends in ASFRs will continue into the future. This method involves estimating the trend based on the past five years, extrapolating it five years into the future, and then freezing the rates (Myrskylä et al. Citation2013).
The two Bayesian models produce probabilistic forecasts. The advantage of these models is that they provide estimates of uncertainty. The model by Schmertmann et al. (Citation2014) incorporates information about historical age patterns in cohort fertility and trends in ASFRs. These historical data are used as a source of prior information about changes in cohort fertility schedules (the shape prior) and in fertility rates at each age (the time-series prior, which balances two extrapolation techniques: the freeze rate and the freeze slope). These priors are combined to identify fertility surfaces that are plausible or implausible, given the fertility patterns observed in the historical data. Although this model originally uses both shape and time-series priors, it can also be applied using the time-series prior only. This approach may be preferable when the cohort fertility schedule of interest is not well represented in the historical data (Hellstrand et al. Citation2020). Our application suggests that this is the case for Brazil, as the model with the shape prior imposes a heavy penalty on the Brazilian cohort age pattern. This could be because the historical data, which are the source of prior information about plausible cohort fertility schedules, do not include examples of age profiles of fertility similar to those of Brazil, as they are based on data only from the United States and countries in Europe and Asia. Consequently, we implement this Bayesian model but incorporating only the time-series priors.
The Bayesian model by Ellison et al. (Citation2020) is built on an idea similar to that of Schmertmann et al. (Citation2014). It is also based on prior information from historical data but does not build the shape prior into the model. It incorporates the assumptions about the time-series trends (by balancing the freeze rate and freeze slope approaches) but, among other differences, applies them to the error terms of the model rather than to actual rates as Schmertmann et al. (Citation2014) did. When describing the results, we refer to this model as ‘Bayesian 2020’, and we refer to the model from Schmertmann et al. (Citation2014) as ‘Bayesian 2014’.
We chose these four methods based on a recent evaluation of forecast performance across a large number of countries (Bohk-Ewald et al. Citation2018). This evaluation suggested that only a few methods out of the 20 considered perform better than the simple freeze rate method. The five-year extrapolation method tends to outperform other methods in terms of forecast accuracy. The limitation of this approach is that it does not perform well in the quantification of uncertainty, whereas the two Bayesian models have been shown to provide more accurate uncertainty estimates. Thus, there is a benefit to producing forecasts using all four methods, and so we show CTFR forecasts based on all four. We use the same methods to forecast cohort fertility by educational level. For the Bayesian approaches, we include data for the total female population and the educational subgroups as separate ‘national’ populations within the same model. Finally, as a robustness check, we use the education-specific forecasts to obtain cohort fertility estimates for all women. We examine whether this approach produces similar fertility scenarios to the total female population forecast described in the previous paragraphs. In Appendix 4, supplementary material, we confirm that our conclusions about cohort fertility trajectory remain unchanged, which increases confidence in our estimates. To implement the forecasting methods, we use the Stata code provided by Myrskylä et al. (Citation2013) and the R codes provided by Schmertmann et al. (Citation2014) and Ellison et al. (Citation2020).
Results
shows recent PTFR and CTFR trends for Brazil’s female population. The CTFR is observed for women born in 1964–66 and forecasted for those born in or after 1967. The PTFR prior to 1990 and the observed CTFR for women born before 1964 are presented in the supplementary material (Appendix 3). In order to plot the period and cohort measures together, we lag the CTFR by the mean age of childbearing (26 years) of the most recent cohort with completed fertility.
Figure 2 CTFR (observed 1964–66 and forecasted 1967–84) and PTFR, 1966–2010: all women, Brazil
Notes: The CTFR is shown on the bottom x-axis and the PTFR on the top x-axis. Forecasts are shown for all four methods, and shadings indicate 95 per cent CIs for the two Bayesian methods: darker (grey) for the Bayesian 2014 and lighter (yellow) for the Bayesian 2020.
Source: Authors’ calculations from the 1980, 1991, 2000, and 2010 Censuses using microdata from IPUMS (Minnesota Population Center Citation2017).
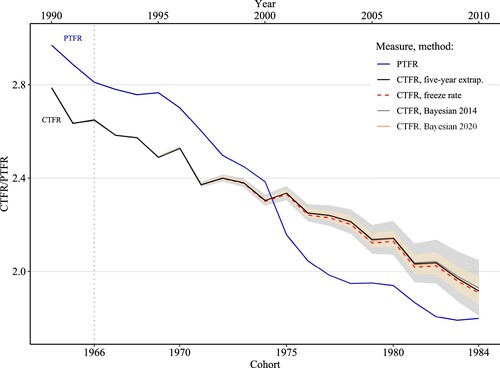
According to the reconstructed trend, the PTFR declined to 1.79 in 2010. The CTFR of the cohort born in 1966 was around 2.6, which corroborates findings from previous studies (Schmertmann et al. Citation2014; Miranda-Ribeiro et al. Citation2017). According to all four forecasts, lifetime fertility is likely to continue declining for women born after 1966 and to reach around 2.3 children per woman for those born in 1975. For the 1980 cohort, the CTFR is likely to remain close to 2.1 children per woman. The 95 per cent probability intervals from the Bayesian 2014 and 2020 models suggest that its value could range around 2.1–2.2. Although further declines are likely, the uncertainty around the estimates increases markedly for younger women. For example, for women born in 1984, the mean of the CTFR forecast is 1.9, with confidence intervals (CIs) indicating that it could range from 1.8 to 2.1. The freeze rate method produces the lowest CTFR of all the methods, because it assumes that the fertility rates at a given age for subsequent cohorts will remain the same. Nonetheless, all four methods point to a similar future trend. Overall, the forecasts suggest that for women born in the 1980s, the CTFR is likely to remain around or just below replacement level but above the PTFR value of around 1.79 observed in 2010.
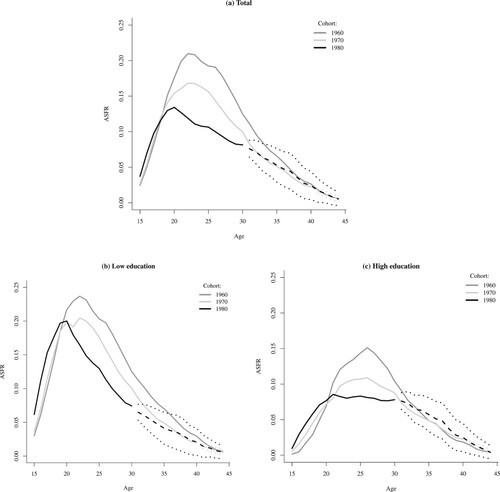
The decrease in Brazil’s PTFR between 2000 and 2010—as shown in —was driven by a decline in fertility rates below age 25, particularly among teenagers (Berquó and Cavenaghi Citation2014; Verona Citation2018). Since these changes correspond to shifts in the behaviour of women who are not covered by our forecast, we are unable to speculate about the likely completed fertility of these cohorts. Instead, we can explore the likely evolution of cohort ASFRs for women born up to the 1980s, to provide insights into emerging shifts in the timing of childbearing across cohorts in Brazil. (a) shows the age-specific fertility profiles of three cohorts: 1960, 1970, and 1980 (forecasts from Bayesian 2014 model). The fertility schedule of women born in 1960 is complete and is presented as a solid line. The solid lines for women born in 1970 and 1980 represent observed rates, while the forecasts are shown as dashed and dotted lines, indicating the mean and 95 per cent CIs of the CTFR forecast, respectively. These schedules show a drastic change in the age profile of fertility driven by a general fertility decline, as reflected in the large reductions in fertility at ages 20–35 between the 1960 and 1970 cohorts. The subsequent declines in fertility observed for the 1980 cohort were concentrated between ages 20 and 30. The mean of the CTFR forecast (dashed line) for this more recent cohort suggests that the decline in fertility rates above age 30 observed among the earlier cohorts is likely to halt, and there might even be very subtle increases in the rates of this cohort compared with those of the 1970 cohort. This implies that the age pattern indicating the timing of fertility may be shifting, with rates at older ages no longer declining. The advantage of using a Bayesian model is that it allows us to highlight the uncertainty inherent in the forecast, as shown by the 95 per cent CIs (dotted lines). We return to later.
Figure 3 Age-specific fertility schedules for selected cohorts of women in Brazil: observed and forecasted rates from the Bayesian 2014 model for: (a) all women; (b) women with low education; and (c) women with high education
Notes: Solid lines show observed fertility schedules. Dashed lines show means of the CTFR forecast; dotted lines show 95 per cent CIs.
Source: As for .
shows that the education-specific trends in total fertility are very different and that the analysis of the total female population conceals important differences in fertility behaviour between educational groups. Among the women with low education, the PTFR declined rapidly between the mid-1990s and 2000s, to around 2.3 children per woman on average in 2007 (, upper section). While the CTFR trend is likely to be more stable, it also points to a plausible continuation of the fertility decline from around 3.0 to around 2.7 children per woman on average between the 1966 and the 1975 cohorts. For women born after 1975, the forecasts from the four methods start to diverge slightly. While the freeze rate and Bayesian forecasts are very close together, the five-year extrapolation method suggests that there is likely to be a more pronounced decline. Nonetheless, the estimate from the latter method is within the 95 per cent CI of the Bayesian 2014 model (but not the 2020 model). Overall, all the methods suggest that the decline in cohort fertility among women with low education is plausible, but there is a high probability that the CTFR will remain above 2.0 children per woman on average for those born during the 1980s.
Figure 4 CTFR (observed 1964–66 and forecasted 1967–84) and PTFR (1966–2010) by educational level: Brazil
Notes: The CTFR is shown on the bottom x-axis and the PTFR on the top x-axis. Forecasts are shown for all four methods, and shadings indicate 95 per cent CIs for the two Bayesian methods: darker (grey) for the Bayesian 2014 and lighter (yellow) for the Bayesian 2020. The PTFR estimates for women with low levels of education are truncated starting in 2007 for the reasons explained in the Data section.
Source: As for .
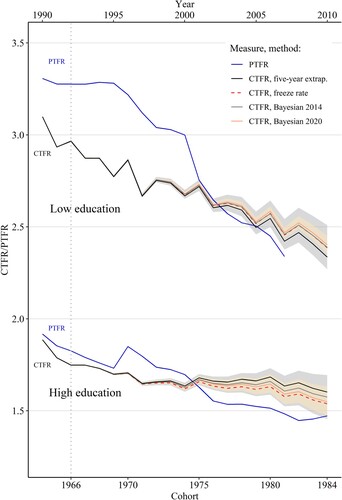
Conversely, among women with the higher level of schooling, the PTFR was already below replacement level in 1990 and continued to decline to around 1.5 in 2010 (, lower section). Similarly, the CTFR for the 1964 cohort was around 1.9 and is forecasted to continue declining to around 1.6–1.7 among women born in 1975. As we observe for the women with low education, the mean estimates from the Bayesian models and the freeze rate method for women with high education born after 1975 are more similar than those suggested by the five-year extrapolation method. Nonetheless, the differences between the forecasts are not large, and all the mean estimates are within the 95 per cent CIs of both Bayesian models. All four methods suggest that there is likely to be a plateauing of the CTFR for women born between 1975 and 1980, or even a plausible reversal of the decline according to the five-year extrapolation method. The 95 per cent CIs indicate that for women with high education born in the 1980s, the CTFR could range from 1.6 to 1.7.
The changes in cohort fertility schedules, both observed and forecasted, cast further light on the stark differences in the fertility patterns of the two educational groups ((b) and (c)). Among women with low education, the age schedule has shifted to the left in more recent cohorts due to the substantial decreases in fertility above age 20 and subsequent increases in fertility below age 20. The forecasted declines in the CTFR among women with low education born between 1970 and in 1980 (shown in ) are the result of the observed reductions in fertility between ages 20 and 30, and according to the mean of the Bayesian 2014 CTFR forecast (dashed line), rates are likely to continue to decline between ages 30 and 35. The fertility decline among women with high education was also concentrated between ages 20 and 30. As observed among the women with low education, teenage fertility increased for women with high education born in 1980, relative to earlier cohorts. This is not unexpected: as we explained in the Data section, the ‘high education’ group in this study includes women with at least one year of secondary education. Although the increase in teenage fertility was most pronounced among women with the lowest levels of schooling, it can be observed among the secondary school entrants as well (Rodríguez Vignoli Citation2013; Martins Citation2016). The mean of the CTFR forecast (dashed line, (c)) suggests that fertility rates above age 30 are likely to be higher for the 1980 cohort than for the 1970 cohort. Thus, the pronounced decreases in fertility observed among some members of the 1980 cohort during their 20s are likely to be recuperated to some extent at older ages. These results suggest that there has been a plausible and important shift in the pattern of fertility at older ages among women with more advanced levels of schooling.
So that we can examine the likely developments of educational differences in CTFRs in greater depth, shows differences by educational level in completed fertility calculated from the observed (1960 and 1964 cohort) and forecasted (1970, 1974, 1980, and 1984 cohorts) CTFRs. Educational differences in completed fertility declined from around 1.41 children per woman on average for the 1960 cohort to around 1.16 for the 1970 cohort. According to all the forecasts, this downward trend is likely to continue. Nonetheless, even for the most recent cohorts (born in the early 1980s), for whom forecasted CTFRs are close to replacement level, the educational differences in completed fertility are likely to remain substantial. They could range from 0.73 to 0.94 children per woman on average, depending on the method and cohort.
Table 2 Educational differences in CTFRs based on education-specific observed CTFRs (1960–64) and forecasted CTFRs (1970–84) using four methods, with total female population CTFR in parentheses: Brazil
Although comparisons are difficult due to differences in how educational levels have been classified across studies, the forecasted educational differences in completed fertility in Brazil appear to be larger than those documented in many other settings with comparable cohort fertility levels. In South Korea, the decline of the CTFR to below replacement level coincided with a convergence in fertility between educational groups (Yoo Citation2014). In the Nordic countries, as the CTFR declined from around 2.1–2.3 to 1.9 (Denmark, Norway) or remained constant at around 1.9 (Finland, Sweden), educational differences in completed fertility between the lowest and most highly educated remained at around 0.3 children per woman in Finland and disappeared in Denmark, Norway, and Sweden (Jalovaara et al. Citation2019). A study of 15 European countries suggested that for countries where the CTFR was between 1.9 and 2.1, educational differences ranged from 0.03 (Norway, CTFR of 2.0) to 0.69 in Hungary (CTFR of 1.86). According to a study conducted in the UK, on cohorts for whom the CTFR was around 2.0 children per women, the difference in completed fertility of the lowest and most highly educated women was 0.67 (Berrington et al. Citation2015). Our forecasts indicate that educational differences in Brazil are likely to be larger than the differences documented for these settings with similar CTFR levels. Education gaps in Brazil are likely to be of a more comparable magnitude to those documented for cohorts who completed their reproductive careers under state socialism in Central and Eastern Europe (Brzozowska Citation2015). For example, in Croatia or Slovenia, with the decline in CTFR to just below replacement level, educational differences between the lowest and most highly educated women remained between approximately 0.8 and 1.0 children per woman. It should be noted, however, that our estimates of differences for Brazil constitute a conservative scenario because in our study, ‘high education’ is defined as secondary school attendance. In the studies just highlighted, higher education typically pertained to tertiary education. It is possible that if we were able to forecast completed fertility for women in tertiary education, the educational differences between women with low and high education in Brazil would be even larger.
Conclusions
This study has provided a comprehensive picture of the plausible future developments in cohort fertility in Brazil, including for subpopulations according to educational level. Unlike the PTFR, the CTFR is a measure that is free from the impact of tempo distortions and can be used to estimate how many children, on average, women have over their lifespan. The range of methods that we used, which included indirect methods of fertility reconstruction and probabilistic forecasting approaches, allowed us to cast light on the likely future cohort fertility trajectory, as well as the uncertainty around the forecasted rates. This research has several implications for the study and measurement of fertility in Brazil, Latin America, and LMICs more broadly.
First, we showed that the Brazilian fertility pattern is undergoing substantial shifts related to the timing of childbearing and to completed fertility and that these vary between educational groups. Although cohort fertility is forecasted to continue declining at the population level, our results suggest that the long-observed declines in fertility rates above age 30 are likely to stop among more recent cohorts. Among women with high education, we documented plausible increases in fertility rates above age 30 and a halt, or even reversal, of declines in completed fertility. These processes reflect the postponement and the plausible beginning of recuperation of fertility among some members of that subpopulation. These results suggest that the long-standing early childbearing pattern in Brazil has weakened, and this is likely to translate into novel changes in fertility rates at older ages among more recent cohorts. In addition, these results lead us to conclude that in future, period fertility measures are likely to increasingly underestimate ‘true’ fertility levels and will thus provide only a limited picture of changes in fertility levels. This might be particularly the case in the coming years, given the large declines in fertility among women below age 25 that have been observed since the 2000s (Berquó and Cavenaghi Citation2014; Verona Citation2018) and also, most recently, the plausible impacts of the Zika epidemic and Covid-19 pandemic and associated crises on women’s fertility intentions (Marteleto et al. Citation2021). Forecasting of cohort fertility when these women reach their 30s will be needed to assess the impact on fertility levels of the ongoing changes in the timing of childbearing. Thus, in future, more attention should be paid to studying and forecasting cohort fertility in Brazil and in other Latin American countries that have experienced similar changes in fertility timing. Echoing the results of large-scale forecast accuracy evaluations showing that more complex methods do not necessarily outperform less sophisticated approaches (Bohk-Ewald et al. Citation2018), we found that, in the case of Brazil, the results from the simpler extrapolation method and the more complex Bayesian models produced similar results. Nonetheless, an important advantage of Bayesian models is that they provide estimation of uncertainty; thus, future studies on cohort fertility in Latin America are likely to benefit from exploring a range of complementary methods.
This study has provided a description of the process for estimating the time series of ASFRs, and the cohort fertility analysis can be easily replicated for upcoming censuses and in other Latin American countries. The countries in the region have a long history of census data collection. The samples from the majority of these censuses have been harmonized and are available through IPUMS; this is also the case for many other LMICs. By contrast, access to full census data is often more restricted. Another advantage of the IPUMS data for the estimation of time series of fertility rates using the OCM is the availability of the constructed family interrelationship variables, which greatly facilitates the analysis. One of the largest barriers to studying and forecasting cohort fertility in LMICs is the lack of necessary input data. This study showed that using the IPUMS census microdata, it is possible to estimate detailed trends in fertility rates by single year and age indirectly, at least for Brazil. While the internal consistency of the ASFRs does not guarantee their accuracy, it assures us that the trends are not systematically distorted by the kinds of problems that often arise in fertility estimates in LMICs. Given the scarcity of published time series of fertility rates in settings such as Latin America, such fertility reconstruction techniques provide a promising alternative.
Another novelty of this study was that we applied the aforementioned fertility reconstruction and forecasting techniques to study educational differences in completed fertility. This is important because, in the Latin American context, analysis of the total female population can conceal large differences in fertility between population strata. The results show that although educational differences in completed fertility are likely to continue to decline, they are unlikely to disappear for the most recent cohorts. Indeed, our forecasts suggest that these differences could remain large. Although the cohort fertility of women with high education is likely to plateau, and we can expect to observe increases in fertility rates above age 30, completed fertility is forecasted to remain below replacement level (at around 1.6–1.7 for women with high education born after 1975). It is evident that large shares of educated women in Brazil are stopping having children after the birth of their first child. This could mean that women who transition to motherhood later in life do not have enough time to ‘catch up’ or do not want to continue childbearing after having one child. To shed more light on these processes, future research should focus on exploring the determinants of cohort fertility in Brazil and in Latin America more broadly. While an increasing body of literature has investigated the socio-economic disparities in timing of childbearing in the region, there is a scarcity of studies examining the determinants of socio-economic differences in completed fertility.
Research on fertility in Europe has suggested that there is a relationship between economic development and the educational gradient in completed fertility and that this gradient is steeper in less developed settings (Nisén et al. Citation2021). Our study has shown that the educational gaps in Brazil could be larger than those observed in many HICs with similar CTFRs. This finding highlights the importance of extending research on the topic to LMICs characterized by low fertility and also of conducting comparative analyses between settings at various stages of economic development. This is vital, given the evidence suggesting that polarization in reproductive behaviour is more pronounced in Latin America and other LMICs than it is in HICs (e.g. Lima et al. Citation2018). Although we are learning more about the past and possible future differences in cohort fertility by educational level in HICs, the evolution of these trends remains largely unexplored outside that context. Further research on the topic is needed in LMICs to enable us to broaden our knowledge about changes in fertility patterns worldwide.
Supplementary Material
Download PDF (284.5 KB)Disclosure statement
No potential conflict of interest was reported by the authors.
Notes
1 Please direct all correspondence to Ewa Batyra, Center for Demographic Studies (CED-CERCA), Carrer de Ca n’Altayó, Edifici E2, 08193 Barcelona, Spain; or by E-mail: [email protected]
2 Ewa Batyra is based at the Max Planck Institute for Demographic Research, Germany, the Centre for Demographic Studies (CED-CERCA) in Spain and the London School of Economics and Political Science, UK. Tiziana Leone is at the London School of Economics and Political Science, UK. Mikko Myrskylä is at the Max Planck Institute for Demographic Research, Germany, the London School of Economics and Political Science, UK, and the Center for Social Data Science and Population Research Unit, University of Helsinki, Finland.
3 Acknowledgments: Most of this research was conducted while Ewa Batyra was a PhD student in the Department of Social Policy, London School of Economics and Political Science, and was supported by the UK’s Economic and Social Research Council Doctoral Studentship (ES/J500070/1). Ewa Batyra also acknowledges support from the University of Pennsylvania (through the National Science Foundation, grant number 1729185 for the Global Family Change Project, PIs: Kohler and Furstenberg), the Max Planck Institute for Demographic Research (through the Max Planck Society Grant), and finally the Center for Demographic Studies (through the Juan de la Cierva Individual Fellowship grant number FJC2019–040652-I and MINEQ grant number H2020-ERC-2020-STG-GA-948557-MINEQ), which hosted her as a postdoctoral fellow while part of this research was conducted. Mikko Myrskylä was supported by an ERC grant 336475 (COSTPOST) and by the Strategic Research Council (SRC), FLUX consortium: decision numbers 345130 and 345131.
4 The authors wish to acknowledge the statistical office that provided the underlying data making this research possible: Institute of Geography and Statistics, Brazil.
References
- Abbasi-Shavazi, M. J. 1997. An assessment of the own-children method of estimating fertility by birthplace in Australia, Journal of the Australian Population Association 14(2): 11–17.
- Azevedo, J. P., M. Favara, S. E. Haddock, L. F. Lopez-Calva, M. Müller, and E. Perova. 2012. Teenage Pregnancy and Opportunities in Latin America and the Caribbean. Washington, DC: World Bank Group.
- Berquó, E. S., and S. Cavenaghi. 2005. Brazilian Fertility Regimes: Profiles of Women Below and Above Replacement Levels. Paper presented at the International Union for the Scientific Study of Population. Tours, July 18–23.
- Berquó, E. S., and S. Cavenaghi. 2014. Notas sobre os diferenciais educacionais e econômicos da fecundidade no Brasil [Notes on the educational and economic differentials in fertility in Brazil], Revista Brasileira de Estudos de População 31(2): 471–482. https://doi.org/10.1590/S0102-30982014000200012
- Berrington, A., J. Stone, and É. Beaujouan. 2015. Educational differences in timing and quantum of childbearing in Britain: A study of cohorts born 1940-1969, Demographic Research 33(1): 733–764. https://doi.org/10.4054/DemRes.2015.33.26
- Bohk-Ewald, C., P. Li, and M. Myrskylä. 2018. Forecast accuracy hardly improves with method complexity when completing cohort fertility, Proceedings of the National Academy of Sciences 115(37): 9187–9192. https://doi.org/10.1073/pnas.1722364115
- Bongaarts, J., and G. Feeney. 1998. On the quantum and tempo of fertility, Population and Development Review 24(2): 271–291. https://doi.org/10.2307/2807974
- Brass, W. 1975. Methods for Estimating Fertility and Mortality from Limited and Defective Data. Chapel Hill: University of North Carolina Press.
- Brzozowska, Z. 2015. Female education and fertility under state socialism in central and Eastern Europe, Population 70(4): 689–725.
- Caetano, A. J., and J. E. Potter. 2004. Politics and female sterilization in northeast Brazil, Population and Development Review 30(1): 79–108. https://doi.org/10.1111/j.1728-4457.2004.00004.x
- Carvalho, J. A. M. De, and L. L. Rodríguez Wong. 1996. The fertility transition in Brazil: Causes and consequences, in J. M. Guzmán, S. Singh, G. Rodriguez and E. A. Pantelides (eds), The Fertility Transition in Latin America. Oxford: Clarendon Press, pp. 373–396.
- Castanheira, H. C., and H.-P. Kohler. 2016. It Is Lower Than You Think It Is: Recent Total Fertility Rates in Brazil and Possibly Other Latin American Countries. Paper presented at the Annual Meeting of the Population Association of America, Washington DC, March 30–April 2.
- Cavenaghi, S., and E. S. Berquó. 2014. Perfil socioeconômico e demográfico da fecundidade no Brasil de 2000 a 2010 [Socioeconomic and demographic profile of fertility in Brazil from 2000 to 2010]. Paper presented at the VI Congress of the Latin American Population Association, Lima, 12–15 August.
- Cetorelli, V. 2014. The effect on fertility of the 2003-2011 war in Iraq, Population and Development Review 40(4): 581–604. https://doi.org/10.1111/j.1728-4457.2014.00001.x
- Chackiel, J., and S. Schkolnik. 1996. Latin America: Overview of the fertility transition, 1950-1990, in J. M. Guzmán, S. Singh, G. Rodriguez and E. A. Pantelides (eds), The Fertility Transition in Latin America. Oxford: Clarendon Press, pp. 3–26.
- Cho, L.-J., R. D. Retherford, and M. Choe. 1986. The Own-Children Method of Fertility Estimation. Honolulu: University of Hawaii Press.
- East-West Center. 1992. EASWESPOP Fertility Estimate Programs. The East-West Center Research Program, USA.
- Ellison, J., E. Dodd, and J. J. Forster. 2020. Forecasting of cohort fertility under a hierarchical Bayesian approach, Journal of the Royal Statistical Society: Series A (Statistics in Society) 183(3): 829–856. https://doi.org/10.1111/rssa.12566
- Ferrara, E. La, A. Chong, and S. Duryea. 2012. Soap operas and fertility: Evidence from Brazil, American Economic Journal: Applied Economics 4(4): 1–31. https://doi.org/10.1257/app.4.4.1
- Frejka, T., and J. P. Sardon. 2004. Childbearing Trends and Prospects in Low-Fertility Countries. A Cohort Analysis. Dordrecht: Kluwer Academic Publishers.
- Goldani, A. M. 2002. What Will Happen to Brazilian fertility? Population Bulletin of the United Nations: Completing the Fertility Transition. Special Issue Nos. 48/49. New York: United Nations.
- Goldstein, J., T. Sobotka, and A. Jasilioniene. 2009. The end of “lowest-low” fertility?, Population and Development Review 35(4): 663–699. https://doi.org/10.1111/j.1728-4457.2009.00304.x
- Gonçalves, G. Q., J. A. M. De Carvalho, L. L. Rodríguez Wong, and C. M. Turra. 2019. A transição da fecundidade no Brasil ao longo do século XX – uma perspectiva regional [Fertility transition in Brazil across the twentieth century – A regional perspective], Revista Brasileira de Estudos de População 36(e0098): 1–34. https://doi.org/10.20947/s0102-3098a0098
- Hellstrand, J., J. Nisén, V. Miranda, P. Fallesen, L. Dommermuth, and M. Myrskylä. 2021. Not just later, but fewer: Novel trends in cohort fertility in the nordic countries, Demography 58(4): 1373–1399. https://doi.org/10.1215/00703370-9373618
- Hellstrand, J., J. Nisén, and M. Myrskylä. 2020. All-time low period fertility in Finland: Demographic drivers, tempo effects, and cohort implications, Population Studies 74(3): 315–329. https://doi.org/10.1080/00324728.2020.1750677
- IBGE. 2008. Metodologia das Estimativas das Populações Residentes nos Municípios Brasileiros [Methodology for Estimating Resident Populations in Brazilian Municipalities]. Rio de Janeiro: IBGE.
- IBGE. 2010a. Indicators and Basic Data, Brazil, 2010. Rio de Janeiro: IBGE.
- IBGE. 2010b. Censo Demografico 2010: Fecundidade e Mortalidade Infantil [2010 Demographic Census: Fertility and Infant Mortality]. Rio de Janeiro: IBGE.
- Jalovaara, M., G. Neyer, G. Andersson, J. Dahlberg, L. Dommermuth, P. Fallesen, and T. Lappegård. 2019. Education, gender, and cohort fertility in the Nordic countries, European Journal of Population 35(3): 563–586. https://doi.org/10.1007/s10680-018-9492-2
- Kohler, H.-P., F. C. Billari, and J. A. Ortega. 2002. The emergence of lowest-low fertility in Europe during the 1990s, Population and Development Review 28(4): 641–680. https://doi.org/10.1111/j.1728-4457.2002.00641.x
- Leone, T. 2002. Fertility and union dynamics in Brazil, PhD Thesis, University of Southampton.
- Lima, E. E. C. 2013. Age-Specific Fertility Rates: Estimations Based on Brazilian Census Data. Human Fertility Collection. Rostock: Max Planck Institute for Demographic Research.
- Lima, E. E. C., K. Zeman, T. Sobotka, M. Nathan, and R. Castro. 2018. The emergence of bimodal fertility profiles in Latin America, Population and Development Review 44(4): 723–743. https://doi.org/10.1111/padr.12157
- Lwendo, M., and M. Levin. 2017. New Own Children: Methodology and Results from Africa DHS and Census data (IPUMS). Methodology presented at the Conference Children, Mothers and Measuring Fertility: New Perspectives on the Own Child Method, University of Cambridge. September 18–20.
- Marteleto, L., and M. Dondero. 2013. Maternal age at first birth and adolescent education in Brazil, Demographic Research 28(28): 793–820. https://doi.org/10.4054/DemRes.2013.28.28
- Marteleto, L., M. Dondero, and A. Koepp. 2021. Double Exposure to Novel Infectious Diseases: ZIKV, Covid-19 and the Context of Fertility. Paper presented at the Annual Meeting of the Population Association of America, April 4–8, 2021.
- Martine, G. 1996. Brazil’s fertility decline, 1965-95: A fresh look at key factors, Population and Development Review 22(1): 47–75. https://doi.org/10.2307/2137686
- Martins, P. H. V. 2016. Mudanças recentes na fecundidade adolescente no Brasil: a associação com a escolaridade continua a mesma? [Recent changes in adolescent fertility in Brazil: Does the association with schooling continue to be the same?], Master’s Thesis, Universidade Federal de Minas Gerais.
- Minnesota Population Center. 2017. Integrated Public Use Microdata Series, International: Version 6.5 [Brazil 1980,1991,2000,2010].
- Miranda-Ribeiro, A. De. 2007. Reconstrução de Histórias de Nascimentos a partir de Dados Censitários: aspectos teóricos e evidências empíricas [Reconstruction of Birth Histories from Census Data: theoretical aspects and empirical evidence], PhD Thesis, Centro de Desenvolvimento e Planejamento Regional Faculdade de Ciências Econômicas - UFMG.
- Miranda-Ribeiro, A. De and R. A. Garcia. 2013. Transition or transitions ? Analyzing the fertility decline in Brazil in the light of educational levels, Revista Latinoamericana de Población 7(13): 91–106. https://doi.org/10.31406/relap2013.v7.i2.n13.4
- Miranda-Ribeiro, A. De, P. De Miranda-Ribeiro, and E. L. G. Rios-Neto. 2017. Brazilian Cohort Fertility by Education and Color/ Race: Trends and Future Scenarios for Projections. Paper presented at the International Union for Scientific Study of Population, Cape Town, October 29–November 4.
- Miranda-Ribeiro, A. De, E. L. G. Rios-Neto, and J. A. Ortega. 2008. Declínio da fecundidade no Brasil e México e o nível de reposição: efeitos tempo, parturição e quantum [Fertility decline in Brazil and Mexico and the replacement level: Tempo, parity composition and quantum effects], in L. Rodríguez Wong (ed.), Población y Salud Sexual y Reproductiva en América Latina. Rio de Janeiro: ALAP, pp. 81–100.
- Myrskylä, M., J. R. Goldstein, and Y. H. A. Cheng. 2013. New cohort fertility forecasts for the developed world: Rises, falls, and reversals, Population and Development Review 39(1): 31–56. https://doi.org/10.1111/j.1728-4457.2013.00572.x
- Nisén, J., S. Klüsener, J. Dahlberg, L. Dommermuth, A. Jasilioniene, M. Kreyenfeld, T. Lappegård, et al. 2021. Educational differences in cohort fertility across sub-national regions in Europe, European Journal of Population 37(1): 263–295. https://doi.org/10.1007/s10680-020-09562-0
- Potter, J. E. 1999. The persistence of outmoded contraceptive regimes: The cases of Mexico and Brazil, Population and Development Review 25(4): 703–739. https://doi.org/10.1111/j.1728-4457.1999.00703.x
- Retherford, R. D., A. Chamratrithirong, and A. Wanglee. 1980. The impact of alternative mortality assumptions on own-children estimates of fertility for Thailand, Asian and Pacific Census Forum 6(3): 5–8.
- Retherford, R. D., C. Pejaranonda, L. Cho, A. Chamratrithirong, and F. Arnold. 1979. Own-Children Estimates of Fertility for Thailand Based on the 1970 Census, Papers of the East-West Population Institute No. 63 (63).
- Rindfuss, R. R. and J. A. Sweet. 1977. Postwar Fertility Trends and Differentials in the United States. Amsterdam: Elsevier Science.
- Rios-Neto, E. L. G. 2000. Passado, presente e futuro da fecundidade : uma visão de idade, período e coorte [Past, present and future of fertility: An age, period and cohort view], Revista Brasileira de Estudos de População 17(1/2): 5–15.
- Rios-Neto, E. L. G. and A. De Miranda-Ribeiro. 2015. Fertility Decline in Brazil: Tempo, Quantum and Parity Composition Effects. Paper presented at the Population Association of America Annual Meeting, San Diego, April 30–May 2.
- Rios-Neto, E. L. G., A. De Miranda-Ribeiro, and P. De Miranda-Ribeiro. 2018. Fertility differentials by education in Brazil: From the conclusion of fertility to the onset of postponement transition, Population and Development Review 44(3): 489–517. https://doi.org/10.1111/padr.12165
- Rios-Neto, E. L. G., P. De Miranda-Ribeiro, and J. E. Potter. 1998. I Saw It on TV: Television and Demographic Change in Brazil. Paper presented at the Workshop on the Social Dynamics of Fertility Change in Developing Countries. National Academy of Sciences, Washington, DC.
- Rodríguez Vignoli, J. 2013. High Adolescent Fertility in the Context of Declining Fertility in Latin America. Expert Paper No. 2013/14. New York: United Nations.
- Rodríguez Vignoli, J. 2014. Fecundidad adolescente en América Latina: una actualización [Adolescent fertility in Latin America: An update], in S. Cavenaghi and W. Cabella (eds), Comportamiento reproductivo y fecundidad en Latin America: una agenda inconclusa. Rio de Janeiro: ALAP, pp. 33–65.
- Rodríguez Vignoli, J. 2017. Deseabilidad y planificación de la fecundidad adolescente en América Latina y el Caribe: tendencias y patrones emergentes [Desirability and planning of adolescent fertility in Latin America and the Caribbean: Emerging trends and patterns], Notas de Población 104: 119–144.
- Rosero-Bixby, L., T. Castro-Martín, and T. Martín-García. 2009. Is Latin America starting to retreat from early and universal childbearing?, Demographic Research 20(9): 169–194. https://doi.org/10.4054/DemRes.2009.20.9
- Scalone, F. and M. Dribe. 2017. Testing child-woman ratios and the own-children method on the 1900 Sweden census: Examples of indirect fertility estimates by socioeonomic status in a historical population. Paper presented at the conference Children, Mothers and Measuring Fertility: New Perspectives on the Own Child Method, University of Cambridge. September 18–20.
- Schmertmann, C. P., E. Zagheni, J. R. Goldstein, and M. Myrskylä. 2014. Bayesian forecasting of cohort fertility, Journal of the American Statistical Association 109(506): 500–513. https://doi.org/10.1080/01621459.2014.881738
- Timæus, I. M. 2021. The own-children method of fertility estimation: The devil is in the detail, Demographic Research 45(25): 825–840. https://doi.org/10.4054/DemRes.2021.45.25
- UNDESA. 1982. Model Life Tables for Developing Countries. Department for International Economic and Social Affairs, Population Studies, no. 77. United Nations: New York.
- Verona, A. P. 2018. The end of the rejuvenation of the fertility schedule in Brazil: Evidence from changes in contraception use and reproductive preferences among adolescents and young women, Population Review 57(1): 20–27. https://doi.org/10.1353/prv.2018.0001
- World Bank. 2020. The World Bank Data. Washington, DC: World Bank Group.
- Yoo, S. H. 2014. Educational differentials in cohort fertility during the fertility transition in South Korea, Demographic Research 30(53): 1463–1494. https://doi.org/10.4054/DemRes.2014.30.53