
 ?Mathematical formulae have been encoded as MathML and are displayed in this HTML version using MathJax in order to improve their display. Uncheck the box to turn MathJax off. This feature requires Javascript. Click on a formula to zoom.
Abstract
The net reproduction rate (NRR) is an alternative fertility measure to the more common total fertility rate (TFR) and accounts for the mortality context of the population studied. This study is the first to compare NRR trends in high- and low-income countries and to decompose NRR changes over time into fertility and survival components. The results show that changes in the NRR have been driven mostly by changes in fertility. Yet improvements in survival have also played an important role in explaining changes in the NRR over the last century and represent a substantial component of change in some low-income countries today. Furthermore, the decomposition of the survival component by age indicates that the survival effect on population reproduction is concentrated mostly in infancy, although the HIV/AIDS epidemic altered this age profile in some populations. The findings highlight the importance of mortality’s effect on reproduction in specific periods and contexts.
Introduction
One of the most common indicators of fertility and family planning is the total fertility rate (TFR), which measures the average number of children born to a hypothetical cohort of women who conform to the age-specific fertility rates (ASFRs) of a given time (Preston et al. Citation2001). In a recent paper on population policy targets, van Dalen and Henkens (Citation2021) identified upper and lower bounds for the TFR for policy interventions, based on the views of demographers worldwide. In their study, they made extensive use of the net reproduction rate (NRR), which is considered to be ‘the most appropriate variable for capturing the context of decision-making in a parsimonious manner, as it incorporates information not only on fertility but also on women’s mortality’ (van Dalen and Henkens Citation2021, p. 295). The NRR is defined as the average number of daughters that would be born over a woman’s lifetime according to the age-specific rates of fertility and mortality in a given period. The NRR combines mortality and fertility information into one statistic, whereas the TFR relies on the assumption that all women in a cohort will survive through their childbearing years. In recent decades this assumption has typically been met in most high-income countries, where mortality rates under age 50 are very low. However, this is not the case for historical populations or for many contemporary populations with significant levels of premature mortality.
The NRR is a more accurate indicator of generational replacement than the TFR, since its definition incorporates women’s survival. Indeed, in order to measure replacement, the pertinent question is not merely whether women are having sufficient births to replace themselves and their partners, but rather whether fertility and mortality are such that the generation will replace itself (Kuczynski Citation1928). In high-income countries, replacement-level total fertility without migration is roughly 2.1 children per woman. However, this threshold can vary greatly across countries due to differences in mortality rates and sex ratios at birth; it reaches nearly 4.0 in low-income regions of the world (Gietel-Basten and Scherbov Citation2020). Despite this substantial global variation in the replacement level, the NRR provides a value at which female populations exactly replace themselves that is the same across countries, namely unity (NRR equals one). Since fertility and mortality information only for females is used, the NRR is a female-dominant measure. In epidemiology and biology, the NRR is applied to study the spread of infectious diseases (Heesterbeek Citation2002; Locatelli et al. Citation2021) and bacteria (Nandini et al. Citation2019). In demography, it is one of the fertility indicators regularly published by the United Nations (UN) (United Nations Citation2019a) and is used in publications by national statistical offices, such as the National Center for Health Statistics in the United States (US) (Hamilton and Kirmeyer Citation2017). Nevertheless, in demographic research, the NRR remains much less used than the TFR.
The idea of applying life-table concepts to the analysis of net replacement is attributed to William Farr (1807–83), from the General Register Office in London (Lewes Citation1984), and Richard Boeckh (1824–1907), director of the statistical office of the city of Berlin (Kuczynski Citation1932; Glass Citation1973). The same concept was used by Dublin and Lotka (Citation1925) in the development of the ‘true’ rate of natural increase (the intrinsic growth rate), that is, the rate of growth of a stable population associated with constant levels of fertility and mortality by age. This intrinsic growth rate is a measure of population renewal. Indeed, it is not simply given by subtracting deaths from births as in the population balance equation, but it considers the probability of whether a woman survives from birth until the end of her reproductive life.
The intrinsic growth rate, r, and the NRR use similar demographic components and are directly related to each another. When the NRR is over one, r is above zero; when the NRR is equal to one, the intrinsic growth rate equals zero (Preston et al. Citation2001, p. 152). Furthermore, at replacement-level fertility, the intrinsic growth rate is zero and the NRR is one. However, as already noted, replacement-level fertility can vary substantially across countries (Espenshade et al. Citation2003), mainly due to differences in the mortality of women before the completion of their reproductive lifespan. In contrast, an NRR of one provides a threshold that is the same across countries, despite their differences in survival.
The intrinsic growth rate has been studied by demographers and biologists. Caswell (Citation1989) applied a general linear algebra partial derivative decomposition approach called the Life Table Response Experiment to decompose the population growth rate into mortality and fertility components. Another example is the study by Riffe (Citation2013), who decomposed changes in the intrinsic growth rate into sex-specific components for mortality, fertility, and the sex ratio at birth using the pseudo-continuous approximation method (Horiuchi et al. Citation2008). Our approach adds to this collection of works by presenting the decomposition of another intuitive measure of population change, the NRR, which is derived from both fertility and mortality rates.
As explained by demographic transition theory, during the nineteenth and early twentieth centuries, the lagged interaction between deaths and births led to a period of natural increase in Western societies (Caldwell Citation1976). Less developed countries, especially those countries in sub-Saharan Africa with the highest fertility, are still in the early stages of the transition (Lee Citation2003). Thus, the study of historical changes in the NRR can also contribute to our understanding of the interaction between deaths and births during the demographic transition.
The aim of this paper is to quantify the mortality effect, overall and by age, in population reproduction by disentangling the survival and fertility contributions to changes in the NRR over time. While it is known that survival improvement is associated with population reproduction, this paper adds to the existing literature by quantifying its overall and age-specific impact for 201 countries and areas. Adopting a decomposition method similar to that of Jiang et al. (Citation2019), we separate change in the NRR into two components: those driven by changes in the average number of daughters (fertility component) and those due to changes in the survival of women from birth to the end of reproductive age (survival component). Applying this method to large data sets will offer a deeper understanding of the relationship between survival and reproduction.
The remainder of the paper is structured as follows. The next section presents the data and methods used in the analysis as well as the decomposition method. The results section follows, including results on period changes in NRRs for high- and low-income countries. The discussion section highlights the relevance of our results for historical and current demographic trends. In the conclusion, we summarize the main findings, mention limitations, and suggest potential new directions for future research.
Data
Our calculations for all high-income countries are based on age-specific births, deaths, and populations at risk by period from the Human Mortality Database (HMD Citation2022) and the Human Fertility Database (HFD Citation2022), from 1840 to the most recent year available. The data are by single age, year, sex, and country. Calculations for all other countries are based on period life tables, five-year ASFRs, and NRRs sourced from the UN’s World Population Prospects (WPP) (United Nations Citation2019a) from 1950–55 to 2015–20. To present our results concisely, we select four high-income countries from the HMD and HFD, namely Japan, Spain, and Sweden, along with the US, and four low-income countries from the UN WPP, namely Afghanistan, Laos, Nigeria, and Zimbabwe. The selection criteria for the high-income countries are availability of high-quality data and a long time series, while low-income countries are selected mainly because of their recent survival improvements, which make them an interesting case study for analysing changes in the underlying components of the NRR. presents a summary of the data used.
Table 1 List of selected countries, years, and data sources
While the HFD and HMD meet the highest quality standards, results for the low-income countries included in this study should be interpreted with caution as the UN data incorporate statistical estimations using surveys and censuses to account for the paucity of registration data in those areas (United Nations Citation2019b). Despite their limitations, the UN data provide consistent global comparability over a long time series, enabling us to explore the past and current trends in many low-income countries.
Methods
The TFR in a given year t, denoted TFR(t), is the average number of children women would have if they followed the ASFRs experienced in year t throughout their lives. This measure assumes that all women survive over their entire reproductive age span (in HFD, this is ages 12–55). The NRR in a given year, NRR(t), relaxes this assumption by including the survival of women in year t and focusing on the number of female births that would ‘replace’ the women (including those who do not survive). In mathematical notation, NRR(t) is defined between reproductive ages and
(in HFD,
and
) as:
(1)
(1) where
is the maternity rate for female births at age a and
is the probability of a woman surviving from age zero to age a, both at time t. The age-specific maternity rate is equal to
, where the proportion of female births to women at age a is denoted as
, and
is the ASFR. The data for
are not usually available, so we assume that it is fixed at
(see Appendix 1, supplementary material, for more sensitivity analysis of this assumption). Therefore, we have
, which is essentially a fertility component. Time t refers to both period and cohort measures; the results section focuses primarily on period illustrations, but additional cohort results are included in Appendix 2 (supplementary material).
Jiang et al. (Citation2019) decomposed change in the NRR into four components, namely: (1) marital fertility rate; (2) proportion of women married; (3) proportion of female births over total births; and (4) survival of women from age zero. In this paper, we adopt and extend their method to enable a longer time series and decomposing the survival component of the NRR by age.
Change over time in the NRR can be decomposed into the change in two components: (1) fertility and (2) survival. Let a dot on top of a variable denote the derivative of a function with respect to time (Newton’s notation which allows succinct equations). Thus, change over time in the NRR can be decomposed as:
(2)
(2) where the first term on the right-hand side represents the contribution of fertility change and the second the contribution of survival change. The change in fertility is associated with change in the TFR (which is the aggregate of the ASFRs):
. For low-mortality populations, the relationship between the TFR and NRR will be based almost fully on the sex ratio at birth, where
in populations with a balanced sex ratio at birth. (Appendix 3, supplementary material, offers an alternative derivation of change in the NRR over time and further details on the relationship of the first term in equation (2) to changes in the TFR).
Age-specific decomposition of the survival contribution to change in the NRR over time
Both the first and second terms in equation (2) can be decomposed by age. The age decomposition of fertility is the change in age-specific maternity rates weighted by the age-specific probability of survival. As for the age decomposition of survival, it is less intuitive, given the cumulative nature of the life-table survival function (age-specific mortality from age zero to a). This survival function can also be calculated as the product of age-specific probabilities of survival,
, with
and where the radix of the life table
equals one (Canudas-Romo and Guillot Citation2015). Based on this product of age-specific probabilities of survival, the second term in equation (2) can be rewritten as:
(3)
(3) From equation (3), we can see that for terms with the initial age lower than the lower bound of fertile age (
), the changes (or relative derivatives) in probabilities of survival between two consecutive ages are weighted by the full NRR (since α is the lower bound of fertile age and
is zero below age α, so
is equivalent to the full
). This weight decreases with the increase in age for terms with age
and eventually becomes zero (
) at the end of the reproductive age span, since survival cannot affect reproduction any more. Hence, each term on the right-hand side of equation (3) represents the age-specific survival contribution to the NRR (Appendix 4, supplementary material, details the derivation of equation (3)).
Our direct analytic decomposition enables simulation-based confidence intervals for the NRR and its components. We briefly present one possible way to include uncertainty in our decomposition results using the binomial assumption proposed by Chiang (Citation1984); see Appendix 5, supplementary material. Results for a wider group of countries are available in the online interactive application: https://demo268.shinyapps.io/dnrr. All calculations were performed using R statistical software v. 3.6.3 (R Core Team Citation2020). The R code is available on GitHub: https://github.com/tyaSHEN/NRRdecom.
Results
Trends in the NRR and TFR
shows trends in period and cohort TFRs and NRRs for Japan, Spain, Sweden, and the US over time. The calculations for the cohort and period measures are very similar, but cohort measures are lagged to match the trend in period measures. The shift is based on the mean age at childbearing, which we set at age 30, since ‘it almost always lies between 26 and 33’ (Preston et al. Citation2001, p. 152). The US period and cohort trends are less aligned than in other countries because the mean age at childbearing is relatively lower, making a 26-year shift a better fit (Schoen Citation2004). Yet, for consistent comparison, we set this shift to 30 years for all countries.
Figure 1(a) TFR and NRR for periods 1910–20211 and cohorts 1880–19722, selected high-income countries
1Or earliest and latest year available, as described in Table 1.2Or earliest and latest birth cohort available, as described in Table A1.Note: Cohort rates are lagged by 30 years.Source: Authors’ calculations based on Human Mortality Database (2022) and Human Fertility Database (2022).
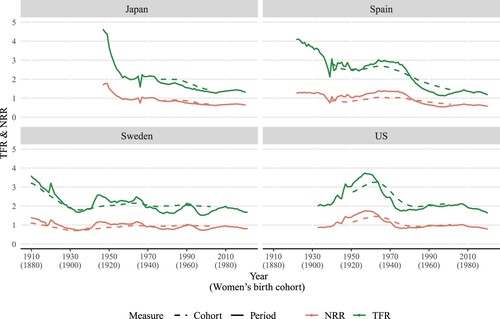
The expected number of female offspring produced by a woman during her entire reproductive life (NRR) is of course lower (roughly half when mortality is very low) than her total expected number of children (TFR). Although the two indices move in a similar fashion, relative changes in the TFR are generally greater than relative changes in the NRR due to the compensating effect of improved survival on fertility reduction. Since the NRR accounts for changes in both fertility and survival but the TFR only for changes in fertility, differences between these trends are expected. In Japan, the TFR more than halved from 4.6 to 2.0 from 1947 to 1960, while the NRR declined from 1.7 to approximately 1.0. Similarly, Spain witnessed a sharp decrease in the TFR from 1922 to 1935, while the NRR remained more stable, from both cohort and period perspectives. The historical time series for Sweden shows a sharp decline in the TFR prior to 1930. Yet, as with other countries, the NRR decreased at a slower pace than the TFR. Declines in fertility are generally accompanied by increases in survival, and changes in survival contribute to smoothing fluctuations in the NRR as compared with the TFR. Yet, the gap between the NRR and TFR tends to stabilize over time. This gap corresponds to approximately half the TFR, as survival improvements slow and mortality before the end of the reproductive ages becomes extremely low. For the US, the transition towards such stabilization is less apparent since the improvement in survival has been slower.
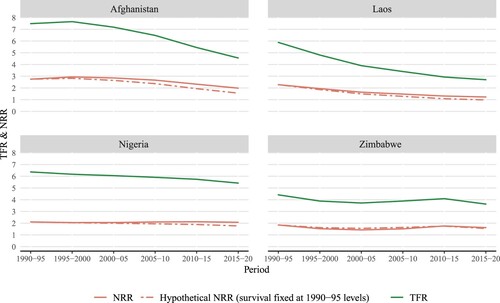
In high-income countries, there has been almost no survival contribution to the NRR over the past three decades (). In contrast, across low-income countries, the discrepancy in relative decline between the TFR and NRR is still evident in recent decades (). To better illustrate the relative importance of the survival component in increasing (or lowering) reproduction in low-income countries in recent years, presents results for a hypothetical scenario (dash-dot line). In this scenario, survival probabilities are kept fixed at the level observed in 1990–95 to simulate the extremely small change in survival before the end of reproductive age observed in high-income countries, as we demonstrate further in the next subsection. As compared with the observed NRR (solid line), the hypothetical NRR drops below 1.0 for Laos in 2015–20 when the TFR is still 2.7. Afghanistan presents a gap of more than 0.4 between the hypothetical and observed NRR in 2015–20. This gap highlights the effect of mortality change, as also observed in many other low-income countries in recent decades.
Figure 1(b) TFR and NRR for periods between 1990–95 and 2015–20, selected low-income countries
Source: Authors’ calculations based on World Population Prospects (United Nations Citation2019a).
From , it is evident that the trends in cohort and period NRRs are largely identical. The main difference is that the period measure is more susceptible to short-term shocks, such as the outbreak of the Spanish Flu in 1918 (shown in the Swedish time series) and the Second World War in the early 1940s (seen in Japan, Spain, and the US). Therefore, except for being less volatile, the change in the cohort NRR is similar to that of the period NRR. In the following results, the focus is on period trends, but cohort analyses can be found in Appendix 2 and the online interactive application.
The contribution of survival and fertility components to the NRR
shows how changes in fertility and survival affected the period NRR between 1910 and 2018. (All values of change in the NRR and the contribution of its terms are multiplied by 100 here and in the rest of the paper.) In Spain, the average annualized change in the NRR between 1922 and 1927 was 0.15, which can be decomposed into the contribution from changes in fertility (corresponding to fertility declines of −2.15) and in survival before age 55 (corresponding to improvements in survival of 2.30).
Figure 2(a) Change in period NRR and its components between 19101 and 20212, selected high-income countries
1Or earliest year available, as described in Table 1. 2Or latest year available, as described in Table 1.Note: Change in NRR is calculated over five years, for periods from year (t−5) to t. For example, the first year for the US, 1938, corresponds to the change in NRR from 1933 to 1938.Source: As for (a).
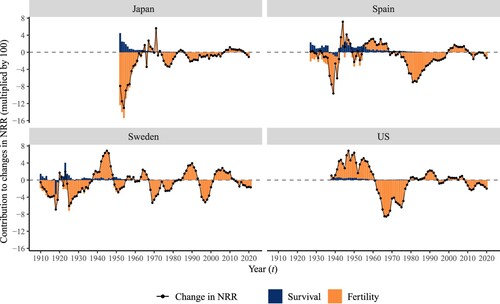
In all four countries, changes in the NRR were driven mainly by changes in fertility, particularly towards the end of the observation period, when all countries were at the leading edge of the demographic transition and further improvement in women’s survival from age zero to age 55 was minimal. Over time, there has been a constant improvement in survival, with only a few exceptions including Sweden during the Spanish Flu in 1918 and the Second World War in the 1940s. In Spain, the contribution of the survival component to changes in the NRR reduced from a peak of 2.3 in 1927 (much greater than the change observed in the NRR) to almost zero in the late twentieth century. Likewise, since the 1960s in Sweden and the US and the 1970s in Japan, the importance of the survival component has reduced, meaning that further improvements in survival only played a minor role in changes in the NRR.
A similar assessment, applied to low-income countries, is shown in for the period from 1990–95 to 2015–20. In Afghanistan, the change in the NRR declined consistently after 1995–2000 because of declining fertility rates. Improvements in survival had a positive effect on the NRR, reducing its decline and partly compensating for the negative effect of the fertility component. In Laos, the fertility component had a major negative impact on NRR change, while survival improvements consistently contributed to increasing the NRR. In Nigeria, the fertility effect was persistently negative and outweighed by the effect of survival, resulting in a relatively stable NRR. Between 2000–05 and 2010–15, the survival component contributed to a small increase in the NRR, which rose from 1.5 to 1.8. In Zimbabwe, decreasing survival and declining fertility both contributed to lowering the NRR between 1995–2000 and 2000–05 (in the next subsection, the negative survival component in Zimbabwe is further explored by decomposing it by age). Subsequently, increases in fertility and improvements in survival contributed to increases in the NRR, before it declined again as a consequence of a decrease in fertility.
Figure 2(b) Change in period NRR and its components between 1990–95 and 2015–20, selected low-income countries
Note: Change in NRR is calculated over five years, for periods from year (t−5) to t. For example, the first year, 1995–2000, corresponds to the change in NRR from 1990–95 to 1995–2000.Source: As for (b).
presents a global comparison showing the contribution of the survival component to changes in the NRR in two time periods: between 1950–55 and 1955–60, and between 2005–10 and 2010–15, in 201 countries/areas and globally. The size of the circles refers to the NRR in the years 1955–60 and 2010–15, respectively. Countries are listed by world region and, within each region, by descending order of the contribution of the survival component between 1950–55 and 1955–60. For most countries, the survival component is positive, indicating that survival has increased. For the world as a whole, the survival improvement has had a much bigger effect on the change in the NRR between 1950–55 and 1955–60 than between 2005–10 and 2010–15. Only a few countries, such as Syria, Venezuela, and Guyana, show negative values of the survival component, indicating that survival among women aged 55 and below has decreased.
Figure 3 Contribution of the survival component to change in the NRR for 1950–55 to 1955–60 (indicated by year 1955) and 2005–10 to 2010–15 (year 2010): 201 countries/areas and world total
Note: Values above 5.0 are cut off at 5.0. Number of countries/areas within each region are shown in parentheses after the region’s name. The size of the circles refers to the NRR in the years 1955–60 and 2010–15, respectively. Average survival over the five-year periods is used where data are available in HMD and HFD. A figure with names of every country/area can be found in the online interactive application: https://demo268.shinyapps.io/dnrr.Source: Authors’ calculations based on Human Mortality Database (2022), Human Fertility Database (2022), and World Population Prospects (United Nations 2019a).
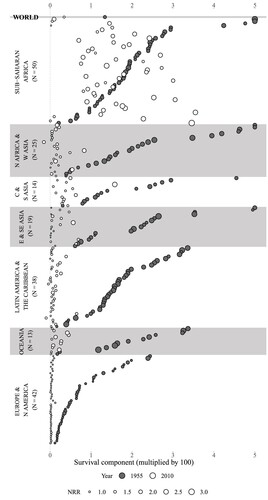
In most countries the importance of the survival component has declined substantially, the only exception being some countries in sub-Saharan Africa, where this component still plays an important role in explaining change in the NRR. In the 1950s, the contribution of survival in many sub-Saharan African countries was as high as that of countries in Asia and Latin America. Over the past 60 years, many countries in Asia and Latin America have transitioned to low mortality and small survival improvement among children and young adults. However, despite Sub-Saharan Africa experiencing considerable improvement in survival since the 1950s, reductions in mortality during childhood and childbearing years in the region are still high and now lag behind those seen in Asia and Latin America. Based on these changes, sub-Saharan Africa appears to be in the early second stage of the demographic transition. As for other regions, most countries survival components are now below 1.0, with the only exception being Afghanistan. Countries with high NRRs (larger circles) tend to have experienced larger improvements in survival over the period of analysis. In Europe and North America, changes in survival have been extremely small. The highest values of the survival component in this region are recorded among former Soviet Union countries.
Age-specific decomposition of the survival contribution to change in the NRR
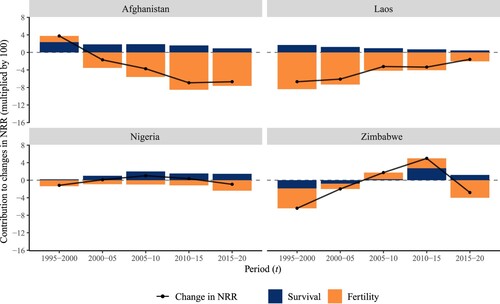
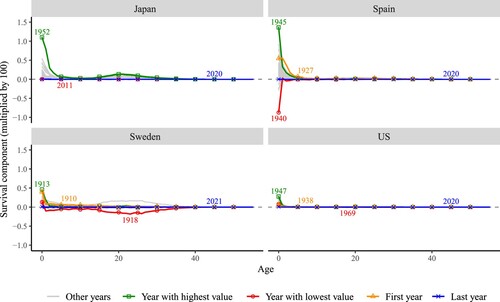
The survival component of the change in the period NRR (survival bars in ) is further decomposed into age-specific contributions in . The greatest contribution to change in the NRR has been at younger ages, as improvements in survival were highly concentrated in infancy and early childhood, rather than in the reproductive ages. Survival contributions were positive in most years, excepting the turbulent war period in the early 1940s and the 1918 influenza pandemic. Sharp negative contributions to survival, caused by short-term shocks, were generally compensated by pronounced survival improvements soon after: compare the years 1940 and 1945 in Spain. Therefore, these relatively high improvements in survival need to be interpreted in the context of relatively high deterioration in survival five years before. However, in recent years, the small contributions of survival to changes in the NRR have been due to the low mortality levels already achieved in these countries. Very similar age patterns are observed in changes in the survival component of cohort NRRs (shown in Figure A4 in Appendix 2).
Figure 4(a) Age-specific contributions of the survival component of changes over time in period NRR, selected high-income countries
Note: Change in survival between years (t−5) and t. For example, the first year for the US, 1938, corresponds to the change in NRR from 1933 to 1938. First year is the same as the year with highest value in Japan, so only one is shown.Source: As for (a).
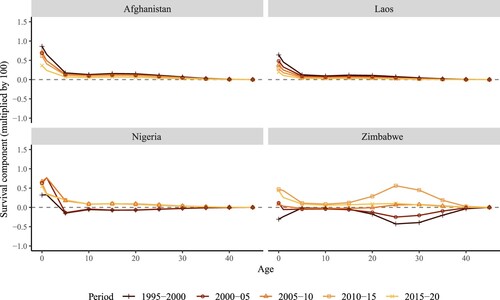
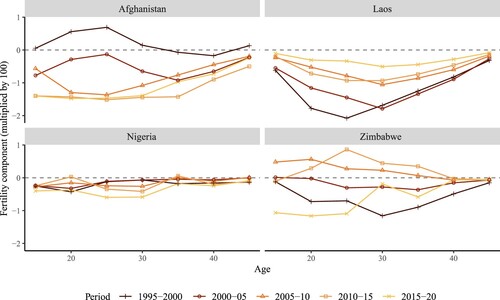
Substantial improvements in infant mortality have led to similar changes among the group of low-income countries, namely Afghanistan, Laos, and Nigeria, shown in . Yet changes in mortality at older ages have also contributed to changes in NRRs in some countries. For instance, Zimbabwe shows two peaks/troughs representing large contributions of mortality change: in infancy and in the age group 20–35. One of the main explanations for this unusual age pattern with two negative peaks in the survival contribution is likely the impact of the HIV/AIDS pandemic, as the pattern also occurs in other sub-Saharan African countries (such as Zimbabwe and Kenya) around the same period, 1985–2005. According to estimates from UNAIDS (Citation2022), the number of people newly infected with HIV spiked in the 1990s and the disease was gradually controlled after 2000. In Zimbabwe, the number of AIDS-related deaths among adults (aged 15+) declined from about 100,000 in 2005 to 24,000 in 2015 (UNAIDS Citation2022). depicts a positive peak among young adult women in 2010–15, which can be attributed to this decline. This reduction in deaths was partly due to changes in sexual behaviour in Zimbabwe (Gregson et al. Citation2006). This is consistent with the dip among those aged in their mid-20s in the 1990s when the pandemic hit hardest and then the recovery at the start of the twenty-first century ().
Figure 4(b) Age-specific contributions of the survival component of changes over time in period NRR, selected low-income countries
Note: Change in survival between years (t−5) and t. For example, the first year, 1995–2000, corresponds to the change in NRR from 1990–95 to 1995–2000.Source: As for (b).
Age-specific decomposition of the fertility contribution to change in the NRR
The age-specific contributions of the fertility component to change in the period NRR (fertility bars in ) are presented in . Age-specific contributions vary greatly by country and depending on the time period of analysis. shows that fertility changes in Spain and the US were concentrated mainly between ages 20 and 30. Japan also follows this pattern, except for the sharp decline in fertility across all ages after the Second World War up until 1960. The larger age-specific contributions are in line with the overall fertility changes observed in those years in . In the most recent years (indicated by the darkest lines), fertility changes have been less pronounced and have shifted to older ages, around age 35, reflecting the trend towards fertility delay in these countries. Sweden stands out because of substantial waves of fertility change observed between ages 20 and 35 during the past 100 years.
Figure 5(a) Age-specific contributions of the fertility component of changes over time in period NRR, selected high-income countries
Note: Change in fertility between years (t−5) and t. For example, the first year for the US, 1938, corresponds to the change in NRR from 1933 to 1938.Source: As for (a).
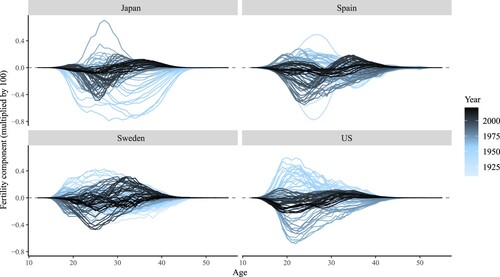
Figure 5(b) Age-specific contributions of the fertility component of changes over time in period NRR, selected low-income countries
Note: Change in fertility between years (t−5) and t. For example, the first year, 1995–2000, corresponds to the change in NRR from 1990–95 to 1995–2000.Source: As for (b).
Moving to , which displays trends for the low-income countries, a wide range of age-specific contributions can be observed across settings. In Afghanistan, substantial decreases in fertility are seen in all age groups after 1995–2000. It is noteworthy that from 2010–15 to 2015–20, the decline in fertility of the youngest age group (15–19) contributed a substantial proportion of the overall fertility decline. Laos exhibits a pattern similar to high-income countries (such as Japan and the US) in the 1960s and 1970s, with the decrease in fertility experienced by all age groups but concentrated primarily in the most fertile age range (20–35). The changes in fertility in Nigeria were marginal () and evenly spread out across age groups, meaning that the age-specific contributions were negligible. Zimbabwe experienced an increase in fertility rates at very young reproductive ages in 2005–10, followed by a trend reversal in 2015–20.
Discussion
The decomposition method used in this study disentangled the contributions of survival and fertility components to the changes in period and cohort NRRs over time and across populations. While the analysis focused mostly on four high-income and four low-income countries, we also provided results for a total of 201 populations (see the online interactive application). Overall, the results showed that changes in NRRs were driven mainly by variations in fertility. However, improvements in survival also played an important role in explaining changes in NRRs during the first half of the twentieth century in the most developed nations of the world, and survival still represents an important component of NRR change in some low-income countries today. This difference occurs mostly because in higher-income countries, improvements in women’s survival during their childhood and reproductive ages have largely been completed. The results of the decomposition are robust, with small confidence intervals, as discussed in Appendix 5.
Demographic transition theory describes the interaction between fertility and mortality and its effects on population growth (Bongaarts Citation2009). During the transition, the opposing trends in fertility decline and increased survival smooth changes in the NRR. A period of natural population increase (Caldwell Citation1976) is followed by the stabilization of the population to a postmodern regime of low mortality and low fertility. High-income countries are in the last stage of the demographic transition and hence are now characterized by low mortality and fertility. These countries have seen minor improvements in mortality rates in early childhood and reproductive ages in recent decades, while fertility rates, although remaining low, have been fluctuating. By contrast, in low-income countries, a long-term decline in mortality has triggered a gradual decline in fertility, corresponding to the second and third stages of the demographic transition. In the second half of the twentieth century, there were major falls in mortality in low-income countries. In recent years, many low-income countries have seen a slowdown in survival improvements, particularly in early childhood, and these changes have been accompanied by rapid fertility decline. A few studies have documented this transition in specific countries (e.g. Garenne et al. Citation2007; Cai Citation2008; James Citation2011). Nevertheless, the decomposition presented here enabled direct comparisons of the effects of mortality and fertility on reproduction across time and between populations at different stages of the demographic transition.
In times of sudden changes in mortality, such as during a pandemic or a war, decomposition of the NRR can reveal to what extent mortality and fertility simultaneously affect net reproduction. An example is the HIV/AIDS pandemic in sub-Saharan Africa. The pandemic had a direct effect on survival and an indirect effect on reproduction through the increase in mortality among reproductive-age women. Research has shown that maternal mortality is much higher among HIV-infected women than among their non-infected counterparts (Lathrop et al. Citation2014), contributing to shortening the life expectancy of HIV-infected females aged 15–49 (Canudas-Romo et al. Citation2014). In Zimbabwe, high levels of HIV prevalence among women of childbearing ages (Bicego et al. Citation2002) exerted a significant effect on reproduction by reducing the number of women in their childbearing years.
Another example is the recent Covid-19 pandemic, which could further decrease reproduction in high-income countries by increasing the death rate of women of reproductive ages. The US, with one of the highest numbers of confirmed Covid-19 cases globally (WHO Citation2021), has seen around 16,200 deaths related to the virus among females under 50 in 2021, with the majority of fatalities occurring in the 30–49 age group (CDC Citation2022). This corresponds to 13 per cent of all deaths to females under 50 in 2021 in the US, highlighting the significant impact of the Covid-19 pandemic in further decreasing population reproduction through the increase in deaths among reproductive-age women. Some heavily affected middle-income countries, such as India and Indonesia (Wang et al. Citation2022), may lack accurate data on Covid-19-related deaths, so estimating the effect of Covid-19 mortality on reproduction for those countries is more challenging. Apart from epidemics, negative survival contribution may derive from violent conflicts (e.g. the Syrian civil war), which are likely to lead to higher mortality among reproductive-age women and, in turn, to lower net reproduction of the population.
Our analysis has revealed that the long-term decline in total fertility rate in high-income countries to low and lowest-low fertility levels (Billari and Kohler Citation2004) occurred during a period of small but continuous gains in the survival of women up to and during reproductive ages. Without such improvements, the observed drop in the NRR would have been even more dramatic. As survival improvements among children and reproductive-age women either markedly slow down or approach their end, further declines in NRRs may be observed, due to the lack of the offsetting effect of survival improvements on fertility decline. The patterns seen in the age decomposition of the fertility component also confirm the emergence of childbearing delay in most high-income countries (Kohler et al. Citation2002): fertility at younger ages has progressively declined and has been partly compensated for by increases in fertility at older ages. Discussions on policies for fertility interventions were outside the scope of this paper since our focus lies in the contribution of survival to net reproduction. This paper has highlighted that high fertility does not necessarily correspond to high net reproduction. Besides, moderately low fertility may be less problematic than expected and could even improve individuals’ standards of living (Lee et al. Citation2014). Finally, fertility change can also be moderated by migration, which is embedded in fertility and mortality rates but was not directly decomposed in this paper due to data limitations.
Although the current data enabled us to explore the effect of the two main components of population reproduction, namely fertility and mortality, data limitations prevented us from examining the effect of the sex ratio at birth and migration in detail. The NRR is a single-sex demographic measure, which considers only the female population. As such, in future it may be relevant to analyse fertility trends in the presence of sex imbalances at birth, such as those observed in China (Cai Citation2008; Keilman et al. Citation2014). Another potential direction for future research is the study of how migrants, or other subpopulations, contribute to the NRR and its change. Although there is no migration factor in the conventional calculation of the NRR (or TFR), migrants contribute to fertility and survival in the population, meaning that the NRR is underestimated for receiving countries. Preston and Wang (Citation2007) presented an alternative NRR derived from three terms, with one term being ‘the proportionate increase or decrease that would be produced in the size of a hypothetical cohort between birth and age a as a result of the age-specific migration rates prevailing at time t’ (Preston and Wang Citation2007, p. 663). With this adjusted NRR, the contribution of migration to change in the NRR can be decomposed. Moreover, Inaba (Citation2009) elaborated the definition of the multiregional net reproduction rate and captured the migration contribution. If age-specific migration data are available, the contribution of internal and international migration to the NRR can be quantified.
In sum, in contemporary highly developed societies, reproduction is predominantly dependent on fertility rates, although notable survival improvements and sharp declines in total fertility have exerted counteracting effects on their population reproduction over the last century. By contrast, many low-income countries in Asia and Africa are currently undergoing the demographic transition, where both survival and fertility are changing. While most of the survival improvements occur among infants, maternal deaths still represent an important factor affecting reproduction in some countries. In highlighting the interaction between two key demographic components of change—fertility and mortality—this study has taken a holistic view in documenting their contributions to reproduction across time and populations.
Supplementary Material
Download PDF (2.3 MB)Disclosure statement
No potential conflict of interest was reported by the authors.
Notes
1 Tianyu Shen and Vladimir Canudas-Romo are based at the School of Demography, Australian National University, Canberra, Australian Capital Territory, Australia. Ester Lazzari is based at the University of Vienna (Wittgenstein Centre for Demography and Global Human Capital (IIASA, OeAW, University of Vienna)).
2 Please direct all correspondence to Tianyu Shen, School of Demography, Australian National University, 146 Ellery Crescent, Acton ACT 2601, Australia; or by E-mail: [email protected].
3 The authors are grateful to our colleagues at the Australian National University—Collin F. Payne, Mu Li, and Heather Booth—for their valuable comments on an earlier version of the manuscript. The authors also thank the editor and reviewers for their insights that helped in improving this article significantly.
References
- Bicego, G., J. T. Boerma, and C. Ronsmans. 2002. The effect of AIDS on maternal mortality in Malawi and Zimbabwe, AIDS 16(7): 1078–1081. https://doi.org/10.1097/00002030-200205030-00019
- Billari, F. C. and H.-P. Kohler. 2004. Patterns of low and lowest-low fertility in Europe, Population Studies 58(2): 161–176. https://doi.org/10.1080/0032472042000213695
- Bongaarts, J. 2009. Human population growth and the demographic transition, Philosophical Transactions of the Royal Society B: Biological Sciences 364(1532): 2985–2990. https://doi.org/10.1098/rstb.2009.0137
- Cai, Y. 2008. An assessment of China’s fertility level using the variable-r method, Demography 45(2): 271–281. https://doi.org/10.1353/dem.0.0003
- Caldwell, J. C. 1976. Toward a restatement of demographic transition theory, Population and Development Review 2(3/4): 321. https://doi.org/10.2307/1971615
- Canudas-Romo, V. and M. Guillot. 2015. Truncated cross-sectional average length of life: A measure for comparing the mortality history of cohorts, Population Studies 69(2): 147–159. https://doi.org/10.1080/00324728.2015.1019955
- Canudas-Romo, V., L. Liu, L. Zimmerman, S. Ahmed, and A. Tsui. 2014. Potential gains in reproductive-aged life expectancy by eliminating maternal mortality: A demographic bonus of achieving MDG 5, PLoS ONE 9(2): e86694. https://doi.org/10.1371/journal.pone.0086694
- Caswell, H. 1989. Analysis of life table response experiments I. Decomposition of effects on population growth rate, Ecological Modelling 46(3): 221–237. https://doi.org/10.1016/0304-3800(89)90019-7
- Centers for Disease Control and Prevention (CDC). 2022. Provisional COVID-19 Deaths by Sex and Age. Available: https://data.cdc.gov/NCHS/Provisional-COVID-19-Deaths-by-Sex-and-Age/9bhg-hcku (accessed: 28 May 2022).
- Chiang, C. L. 1984. The Life Table and Its Applications. Malabar, FL: R.E. Krieger Pub. Co.
- Dublin, L. I. and A. J. Lotka. 1925. On the true rate of natural increase, Journal of the American Statistical Association 20(151): 305. https://doi.org/10.2307/2965517
- Espenshade, T. J., J. C. Guzman, and C. F. Westoff. 2003. The surprising global variation in replacement fertility, Population Research and Policy Review 22(5/6): 575–583. https://doi.org/10.1023/b:popu.0000020882.29684.8e
- Garenne, M. L., S. M. Tollman, M. A. Collinson, and K. Kahn. 2007. Fertility trends and net reproduction in Agincourt, rural South Africa, 1992—2004 1, Scandinavian Journal of Public Health 35(69_suppl): 68–76. https://doi.org/10.1080/14034950701355650
- Gietel-Basten, S. and S. Scherbov. 2020. Exploring the ‘true value’ of replacement rate fertility, Population Research and Policy Review 39(4): 763–772. https://doi.org/10.1007/s11113-019-09561-y
- Glass, D. V. 1973. Numbering the People: The Eighteenth-Century Population Controversy and the Development of Census and Vital Statistics in Britain. Farnborough: Saxon House.
- Gregson, S., G. P. Garnett, C. A. Nyamukapa, T. B. Hallett, J. J. C. Lewis, P. R. Mason, S. K. Chandiwana, et al. 2006. HIV decline associated with behavior change in eastern Zimbabwe, Science 311(5761): 664–666. https://doi.org/10.1126/science.1121054
- Hamilton, B. E. and S. E. Kirmeyer. 2017. Trends and variations in reproduction and intrinsic rates: United States, 1990-2014, National Vital Statistics Reports 66(2): 1. https://www.cdc.gov/nchs/data/nvsr/nvsr66/nvsr66_02.pdf
- Heesterbeek, J. A. P. 2002. A brief history of R0 and a recipe for its calculation, Acta Biotheoretica 50(3): 189–204. https://doi.org/10.1023/a:1016599411804
- Horiuchi, S., J. R. Wilmoth, and S. D. Pletcher. 2008. A decomposition method based on a model of continuous change, Demography 45(4): 785–801. https://doi.org/10.1353/dem.0.0033
- Human Fertility Database (HFD). 2022. Human Fertility Database. Available: https://www.humanfertility.org (accessed: 11 December 2022).
- Human Mortality Database (HMD). 2022. Human Mortality Database. Available: http://www.mortality.org (accessed: 11 December 2022).
- Inaba, H. 2009. The net reproduction rate and the type-reproduction number in multiregional demography, Vienna Yearbook of Population Research 7(1): 197–215. https://doi.org/10.1553/populationyearbook2009s197
- James, K. S. 2011. India’s demographic change: Opportunities and challenges, Science 333(6042): 576–580. https://doi.org/10.1126/science.1207969
- Jiang, Q., S. Yang, S. Li, and M. W. Feldman. 2019. The decline in China’s fertility level: A decomposition analysis, Journal of Biosocial Science 51(6): 785–798. https://doi.org/10.1017/s0021932019000038
- Keilman, N., K. Tymicki, and V. Skirbekk. 2014. Measures for human reproduction should be linked to both men and women, International Journal of Population Research 2014: 1–10. https://doi.org/10.1155/2014/908385
- Kohler, H.-P., F. C. Billari, and J. A. Ortega. 2002. The emergence of lowest-low fertility in Europe during the 1990s, Population and Development Review 28(4): 641–680. https://doi.org/10.1111/j.1728-4457.2002.00641.x
- Kuczynski, R. R. 1928. The Balance of Births and Deaths. Washington, DC: Brookings Institution.
- Kuczynski, R. R. 1932. Fertility and Reproduction: Methods of Measuring the Balance of Births and Deaths. New York: Falcon Press.
- Lathrop, E., D. J. Jamieson, and I. Danel. 2014. HIV and maternal mortality, International Journal of Gynecology & Obstetrics 127(2): 213–215. https://doi.org/10.1016/j.ijgo.2014.05.024
- Lee, R. 2003. The demographic transition: Three centuries of fundamental change, Journal of Economic Perspectives 17(4): 167–190. https://doi.org/10.1257/089533003772034943
- Lee, R., A. Mason, Members of the NTA Network. 2014. Is low fertility really a problem? Population aging, dependency, and consumption, Science 346(6206): 229–234. https://doi.org/10.1126/science.1250542
- Lewes, F. M. M. 1984. A note on the origin of the net reproduction ratio, Population Studies 38(2): 321. https://doi.org/10.2307/2174080
- Locatelli, I., B. Trächsel, and V. Rousson. 2021. Estimating the basic reproduction number for COVID-19 in Western Europe, PLoS ONE 16(3): e0248731. https://doi.org/10.1371/journal.pone.0248731
- Nandini, S., C. Sánchez-Zamora, and S. S. S. Sarma. 2019. Toxicity of cyanobacterial blooms from the reservoir Valle de Bravo (Mexico): A case study on the rotifer Brachionus calyciflorus, Science of The Total Environment 688: 1348–1358. https://doi.org/10.1016/j.scitotenv.2019.06.297
- Preston, S. H., P. Heuveline, and M. Guillot. 2001. Demography: Measuring and Modeling Population Processes. Oxford: Blackwell Publishers.
- Preston, S. H. and H. Wang. 2007. Intrinsic growth rates and net reproduction rates in the presence of migration, Population and Development Review 33(4): 357–666. https://doi.org/10.1111/j.1728-4457.2007.00192.x
- R Core Team. 2020. R: A Language and Environment for Statistical Computing (Version 3.6.3). R Foundation for Statistical Computing, Vienna, Austria. http://www.r-project.org/
- Riffe, T. 2013. The two-sex problem in populations structured by remaining years of life. Doctoral dissertation, Universitat Autònoma de Barcelona. TDX. http://hdl.handle.net/10803/120251
- Schoen, R. 2004. Timing effects and the interpretation of period fertility, Demography 41(4): 801–819. https://doi.org/10.1353/dem.2004.0036
- UNAIDS. 2022. HIV Estimates with Uncertainty Bounds 1990-Present. Available: https://www.unaids.org/en/resources/documents/2022/HIV_estimates_with_uncertainty_bounds_1990-present (accessed: 21 February 2023).
- United Nations, Department of Economic and Social Affairs, Population Division. 2019a. World Population Prospects 2019. New York: United Nations.
- United Nations, Department of Economic and Social Affairs, Population Division. 2019b. World Population Prospects 2019: Methodology of the United Nations Population Estimates and Projections. New York: United Nations.
- van Dalen, H. P. and K. Henkens. 2021. When is fertility too low or too high? Population policy preferences of demographers around the world, Population Studies 75(2): 289–303. https://doi.org/10.1080/00324728.2020.1784986
- Wang, H., K. R. Paulson, S. A. Pease, S. Watson, H. Comfort, P. Zheng, A. Y. Aravkin, et al. 2022. Estimating excess mortality due to the COVID-19 pandemic: A systematic analysis of COVID-19-related mortality, 2020–21, The Lancet 399(10334): 1513–1536. https://doi.org/10.1016/S0140-6736(21)02796-3
- World Health Organization (WHO). 2021. Weekly Epidemiological Update on COVID-19–4 May 2021. Available: https://www.who.int/publications/m/item/weekly-epidemiological-update-on-covid-19—4-may-2021 (accessed: 28 May 2022).