
 ?Mathematical formulae have been encoded as MathML and are displayed in this HTML version using MathJax in order to improve their display. Uncheck the box to turn MathJax off. This feature requires Javascript. Click on a formula to zoom.
ABSTRACT
This study examines the structural and geographical patterns of knowledge flows in order to investigate the centrality of regions. It exploits patent citations and combines social networks analysis and graphs theory to assess the importance of regions as places for knowledge sourcing and creation from the perspective of firms. It offers a novel applied approach to help regions position themselves in a technological space and integrate micro-economic insights into the design of strategies for Smart Specialisation. The analysis includes more than 400 worldwide regions and the patent applications of 1000 research and development-leading firms at the European Patent Office.
INTRODUCTION
The ability of local actors to access relevant knowledge sources and connect to global knowledge and innovation networks is an important driver of regional performances (Huggins & Thompson, Citation2014; Rodríguez-Pose & Crescenzi, Citation2008). Also, less connected regions would often offer fewer opportunities for entrepreneurial search, thus limiting the ability of regions to adopt and adapt new knowledge, as well as the scope for regional diversification (McCann & Ortega-Argilés, Citation2015). Hence, explaining the patterns that underlie the creation of knowledge at local and regional levels is important to understand the differences in regional innovation capacities.
This study examines a few structural and geographical properties of interregional knowledge flows based on patent citations of large research and development (R&D)-investing firms. It mainly aims at assessing the importance of different regions, namely the centrality of regions, as knowledge sourcing and creation places in a given techno-industrial space. In doing so, the network centrality approach also constitutes a relevant framework to inform the design and implementation of regional Smart Specialisation processes during both the analytical phase and the identification of priority domains and interregional benchmarking and partnerships. The empirical approach relies on the tools and methods from social networks analysis (SNA) (Borgatti & Everett, Citation2006; Freeman, Citation1978; Wasserman & Faust, Citation1994) and the graphs theory (Berge, Citation1958; Harary, Citation1969).Footnote1 It builds upon and extends the centrality measures of the SNA framework by suggesting complementary indicators derived from the graph theory perspective. More precisely, such approach allows relating the centrality of a region to a hierarchy of firms. In doing so, our analysis offers a novel conceptual approach to help regions to position themselves in a technological space as well as to better integrate microeconomic processes into the design of regional research and innovation (R&I) Strategies for Smart Specialisation (RIS3).
The main indicator for our analysis is the betweenness centrality. The betweenness centrality of a region A refers to the ability of the region (node in the network) to enable but also to control knowledge flows between the different regions or nodes in the network. Region A would act as a ‘gatekeeper’ influencing the diffusion of knowledge within the network (Wanzenböck, Scherngell, & Brenner, Citation2014). Graph theory exploits the same approach at the level of the actors located in the regions, here the firms. It allows one to assess the influence of individual firms located in a given region on the structure or cohesiveness of the whole network. In doing so, it also enables one to weight the hierarchical contribution of single firms to a region’s observed centrality within the network. In the present study, this approach is applied to the regionalized patents applications of top corporate R&D investors worldwideFootnote2 at the European Patent Office (EPO) between 2010 and 2012. The knowledge flows are proxied by the citations of these patents to prior patents and the spatial patterns are derived from the regional addresses of inventors mentioned in the citing and cited patents. The data set refers to 495 worldwide territories or regions.Footnote3
The paper is structured as follows. The next section mainly overviews the literature dedicated to the study of knowledge flows derived from patent citations and introduces the notion of network centrality. The relevance of network centrality analyses for the design of RIS3 are then discussed. The third section details the construction of the main data set, the methodology and indicators. The fourth section presents the empirical results. The fifth section concludes and suggests future research avenues.
PATENT CITATIONS, KNOWLEDGE FLOWS AND NETWORK ANALYSIS: AN OVERVIEW AND IMPLICATIONS FOR RIS3
The use of patent citations to analyse knowledge flows
The exploitation of patent citations data to analyse the diffusion of knowledge has given rise to a flourishing literature following the seminal works of Jaffe, Trajtenberg, and Henderson (Citation1993). The basic rationale is twofold. First, the relation between the cited and the citing patent can be relevantly used to partially portray the knowledge flows between individual organizations, inventors or institutions. Second it is possible to add a geographical dimension to this relation; that is, the geographical localization of the inventors of cited and citing patents can be used to map the spatial distribution and diffusion of knowledge flows or spillovers (Jaffe et al., Citation1993; Jaffe & Trajtenberg, Citation1999, Citation2002; Jaffe, Trajtenberg, & Fogarty, Citation2000, 2002; Peri, Citation2005; Rave & Goetzke, Citation2013; Verspagen & de Loo, Citation1999; Verspagen & Schoenmakers, Citation2004). The empirical works generally use the geographical and technology information provided in the patent documents. Citation patterns can be mapped at distinct aggregation levels, for instance, the sector, technological field, region or country levels.
A key finding of this literature relates to the spatial concentration of knowledge flows: knowledge tends to spill over relatively close locations. This pattern holds true at country (Jaffe et al., Citation1993; Jaffe & Trajtenberg, Citation1999) and regional levels (Maurseth & Verspagen, Citation2002; Verspagen & Schoenmakers, Citation2004). These works exploit information from patents applications at the US Patent and Trademark Office and at the EPO. For instance, Maurseth and Verspagen (Citation2002) construct a region-by-region citations matrix (citing and cited regions, EPO patents) and show that knowledge flows are more important within European countries than between European regions from different countries. In addition to the significance of (smaller) geographical distances for the scope of knowledge diffusion, they confirm the importance of language, industry structure and technological specialization in determining the patterns of knowledge flows between regions. The study of Verspagen and Schoenmakers (Citation2004) examines the patterns of world’s largest multinational enterprises (MNEs) patenting from European regions. Their findings suggest that spatial concentration occurs at firm levels for both intra- and inter-firm flows. In other words, patents citations are more likely to take place between units that are located relatively near to each other.
Verspagen and de Loo (Citation1999) examine R&D spillovers between sectors over time using EPO data. The matrix of knowledge flows is derived from information available in patent citations. A main finding highlights the existence of a sector-specific time lag in the distribution of R&D spillovers. In the study, this is illustrated by the skewed distribution of R&D spillovers in the machinery sector. This sector presents a citation lag of around 4.5 years between the spillover and the time of R&D performance. The degree and nature of R&D spillovers will be influenced by, among other, the characteristics of sectoral knowledge bases (e.g., tacit, codified), of dominant technologies and technological opportunities, and the relationships with other sectors (Verspagen & de Loo, Citation1999).
At the sub-field level, Fontana, Nuvolari, and Verspagen (Citation2009) use patent citations networks to study the dynamics of technical change in the ethernet. Their main insight is that patent citation are an appropriate information source to better understand the cumulativeness associated with the development of a technology as well as the discontinuities punctuating the trajectories (Fontana et al., Citation2009). More recently, the analysis of Rave and Goetzke (Citation2013) on the mobile air-conditioning sector shows that a large proportion of knowledge flows occurs within countries; across countries, they also remain concentrated among a few places. Furthermore, a growing number of studies that exploit patent citations as useful and relevant proxy for knowledge flows have looked at the determinants of knowledge flows (Aldieri & Vinci, Citation2016; Azagra-Caro & Consoli, Citation2016), their effects (e.g., Peri, Citation2005), while other works have used citation data in order to compare the quality of patents (Hall, Jaffe, & Trajtenberg, Citation2005; Trajtenberg, Citation1990).
Following this literature, this study considers that backward citations links, or citations made to prior patents, are a noisy but relevant indicator to help exploring the patterns of knowledge flows that underpin the generation of new inventions.
Network analysis and graph theory to examine actors’ centrality
The recent developments of SNA have opened up a wide range of perspectives to investigate the properties of networks. Since the seminal contributions of Freeman (Citation1978) and Friedkin (Citation1991), the literature has focused on the concept of centrality as a proxy to assess the position or contribution of a specific actor (node) to the structuring or cohesiveness of a network (Valente, Coronges, Lakon, & Costenbader, Citation2008; Wanzenböck et al., Citation2014; Wasserman & Faust, Citation1994; see Borgatti & Everett, Citation2006; and Borgatti, Citation2005, for the conceptual foundations of centrality measures). There are different measures of centrality including, for instance:
The degree centrality denotes the count of the number of incoming or outcoming links to a given a node; for instance, the in-degree centrality of a region A in a patent citations network can refer to the number of different regions mentioned in region A’s patents.
The closeness centrality corresponds to the sum of distances (shortest paths) from a given node to all other nodes and, in this case, the more central a region is, the closer it is to all other regions in terms of citations, often acting as a hub in the network.
The betweenness centrality refers to the number of times any actor requires another actor (whose centrality is being measured) to reach a third actor via the shortest path (Borgatti, Citation2005; Borgatti & Everett, Citation2006; Freeman, Citation1978). This centrality allows one to assess the ability of a region to enable or control knowledge flows between different regions or nodes in the network.
In terms of centrality measures, two broad approaches can be distinguished. The radial centralities (e.g., degree and closeness) and medial centrality approaches are both used to assess the contribution of a node or an actor to the cohesiveness of a given network (Borgatti & Everett, Citation2006). According to the authors, the medial measures appear particularly relevant when networks are characterized by an important variation in its local density. In the present study, we adopt a similar measurement approach to the patent citations-based network between regions; thus, the centrality of a region will refer its potential for withholding or disrupting flows or to act as a gatekeeper for the technological knowledge flows (Wanzenböck et al., Citation2014).
In parallel of the SNA, a few works have exploited the influence graph theory to explore the structural properties of networks involving directed and weighted flows (Defourny & Thorbecke, Citation1984; Lantner, Citation1974; Lantner, Citation2001; Lantner & Carluer, Citation2004; Lantner & Lebert, Citation2015). This literature enriches the SNA perspective as it provides a conceptual framework to assess the second-order contributions or the contributions of selected layers (firms) to a given region’ centrality (node). Although we do not provide the linear algebra (e.g., Lantner & Lebert, Citation2015), details here, Appendix B in the supplemental data online gives a generic example of the transformation of the flows matrix into a matrix of influence. This matrix will be the basic input for the computations of the centrality and contribution to centrality indicators (in the third section).
The next subsection briefly outlines the steps to design RIS3 and presents important dimensions of network centrality analyses, which can relevantly inform RIS3 design processes.
Linking patents and network centrality analyses to the design of RIS3
RIS3 are place- and evidence-based economic transformation agendas implemented under the European Union (EU) regional policy. They aim at matching R&I resources and potential with development challenges in order to achieve desired structural changes within regional economies. The design of RIS3 unfolds into six fundamental steps including: the analysis of regional strengths, weaknesses and potential; a dedicated and inclusive governance; the adoption of a shared vision for local development; the identification and selection of priority R&I areas; the design of supporting policy mixes; and the setting of monitoring and evaluation schemes (M&E) (European Commission, Citation2012). At the core of RIS3 are entrepreneurial discovery processes (EDP), which are the main source of information about the new exploration and transformation activities (Gianelle, Kyriakou, Cohen, & Przeor, Citation2016).
In this perspective, patents-related indicators have been widely used to assess regional technological developments and opportunities or to achieve technology foresight (Organisation for Economic Co-operation and Development (OECD), Citation2013). Besides, patents are also of prime importance both to measure the EDP ex-post, that is, once technological developments have materialized into patented inventions, and to assess structural changes – in the form of transition, diversification, modernization or radical foundations of industries and/or services – through the evolution of inventions contents (Foray, Citation2015).
The design of a RIS3 implies to achieve initial benchmarking exercises and interregional comparisons (Step 1). Our study contributes to such dimensions and offers complementary tools for the assessment of regional technological potential and positioning. Indeed, the analyses of networks centrality are relevant not only to understand where regions stand in a given industrial and/or technological space but also to better map collaborations opportunities for upgrading of technological and industrial capabilities in national and global contexts. The selected development paths or technological trajectories are more likely to succeed if Smart Specialisation processes targets (new) industrial activities that are technologically related in order to facilitate inter-industry spillovers and new (re)combinations (Boschma & Gianelle, Citation2014; Boschma & Iammarino, Citation2009). Moreover, an important insight of network analyses is that the position within knowledge networks matter for economic performances.
Beyond comparative assessments, the network centrality approach provides an analytical framework to locate hierarchically close or technologically related regions within a given technological space. Combined with microeconomic data, applied graph theory can assist regions in identifying key stakeholders to involve in the process, both local actors and also possibly those from other regions that can be beneficial for the process. From a regional development perspective, such knowledge is valuable to inform the EDP, to identify unique regional niches (Step 4) and opportunities for interregional collaborations (Step 2). This is in line with the outward-looking dimension of RIS3 (Uyarra, Sörvik, & Midtkandal, Citation2014).
Applied to large and highly connected R&D-investing firms (the layers in our analysis), the graph theory sheds a light on interconnected technological capabilities at the global scale and firms-led global innovations networks (GINs). Indeed, lead actors in GINs build and rely upon multiple pipelines to global knowledge sources, from which local actors could build upon and benefit from. Graphs of such networks flows for such regional (p)layers enable mapping the concentration and integration of technological capabilities. Alternatively, they may actually signal either unexplored potential or ‘connections’ to be redressed. This formulation is consistent with global value chains- or GVC-oriented industrial innovation policies, which aim at strengthening export and technological positions of territories by sourcing inputs from other regions (Radosevic, Curaj, Gheorghiu, Andreescu, & Wade, Citation2017). Such policies require regions to identify the relevant linkages and knowledge flows, unveiling the possible patterns of integration with partner regions and complementary clusters of innovative and economic activities. A key implication of this integrative policy approach is that regions will opt for different roles and technology domains (Foray, Citation2015).
DATA SET STRUCTURE AND METHODOLOGICAL APPROACH
Primary patent data set construction
For the purposes of the structural analysis, we combine three different data sources:
The PATSTATFootnote4 database of the EPO is a worldwide patent statistical database that contains applications from more than 80 countries. The autumn 2014 edition is employed for our analyses (EPO, Citation2014). The database contains more than 80 million records and provides information on the patent application such as the inventors and owners, technology classes, publication instances, and citations.
The OECD REGPAT data set (February 2016 edition) gives patent applications published by the EPO (derived from PATSTAT) and by the World Intellectual Property Organization (WIPO) under the Patent Co-operation TreatyFootnote5 (PCT patents at the international phase). The patent filings are linked to more than 5000 regions using the inventors’ or applicants’ addresses (the data set covers regional information for most OECD and EU-28 member countries and Brazil, Russia, India, China and South Africa – the BRICS).
The patent data matched by the European Commission’s Joint Research Centre (JRC) and OECD provides for the period 2010–12 the applications of the top 2000 corporate R&D investors worldwide, as ranked in the 2013 EU Industrial R&D Investment ScoreboardFootnote6 (EC, Citation2013). The matching of their patents was performed by Dernis et al. (Citation2015) using string matching algorithms from the Idener Multi Algorithm Linker developed for the OECD by IDENER, Seville, 2013.Footnote7 The procedure integrates information from the scoreboard companies and their subsidiaries (about 500,000 subsidiaries) provided by Bureau Van Dijk’s ORBIS database.Footnote8 Patent applications are associated with their ultimate owner.
The final data set is obtained as follows. Patents are assigned to the inventor’s regional addressFootnote9 and according to the priority date (or first filing date). While the former allows one to proxy where the invention was made, the priority year is the closest to the actual date of invention (Maraut, Dernis, Webb, Spiezia, & Guellec, Citation2008), and thus from the actual occurrence of knowledge flows. The data set includes the patent applications of top corporate R&D investors at the EPO for the period 2010–12. Only patents containing information on inventors’ regional address and the International Patent Classification (IPC) codes, allowing for the identification of the areas of technology to which patents pertain, are covered by the analysis.
The merged data set consists of 29,290 unique patent applications by 1006 top corporate R&D investors, that is, about one-fourth of the corporate patent data is geographically and technologically localizable. Moreover, in order to prevent the double counting of patents from the same family – i.e., the filings/applications in different jurisdictions for the same invention – the initial set of patents are further combined into 28,477 International Patent Documentation Centre or INPADOC’s patent families (via PATSTAT) for the 1006 scoreboard companies (see Webb, Dernis, Harhoff, & Hoisl, Citation2005 and Bakker, Verhoeven, Zhang, & Van Looy, Citation2016, on the concept of patent family).
A further step consists in extracting the citation information from the sampled patent families. A patent application may cite other patent publications, as well as non-patent literature (e.g., scientific literature). The second type of citations is not considered in the perimeter of the analysis; similarly, the scientific production of large R&D-investing firms is not analysed. Our focus on the technological knowledge should be considered when interpreting the centrality of regions, as scientific networks may or may not match with patent-based networks. Nevertheless, if data would allow, our approach could be further applied to these types of citations and could indeed offer insights on the matches between regional scientific communities and (new) industrial activities. Due to the period of application of patents by top corporate R&D investors (2010–12), we focus on backward citations before this period. Accordingly, 57,234 EPO citations (citing and cited patent families with the geographical location) and PCT (cited patent family with the geographical location) to 44,430 unique cited families are identified. The citations refer to 495 worldwide territories or regionsFootnote10 defined according to the Nomenclature of Territorial Units for StatisticsFootnote11 (NUTS) level 2 in the EU (or equivalent in non-EU territories) and to 591 technological classes or IPCs at the four-digit levelFootnote12 (see Appendix A in the supplemental data online for the country and regional coverage).
Finally, fractional counting of the patent families and the related citations are used in reference to multiregional inventors (the related regional weights are provided on the OECD REGPAT) and in multiple classes cases (Maraut et al., Citation2008).
Caveats about patent and patent citation dataFootnote13
Patent data entail several shortcomings that should be kept in mind in the analytical and interpretative steps (Brusoni et al., Citation2006; Griliches, Citation1990; OECD, Citation2009). First the use of patents greatly differs across sectors and firm size. Indeed, the pharmaceutical and semiconductor industries would appear as relatively appropriate candidates for this use. Whereas it may be less appropriate in industries where alternative intellectual property protections prevail (e.g., services) or when the invention is simply not patented, though further leading to a successful innovation. Second, due to the patenting costs and time resources, large firms tend to recourse to a greater extent to patents than small firms would do. Third, patents entail different market potential and are not of equal monetary value; indeed, more than one-third of patents is neither commercially exploited within the patent-holding organization nor licensed to other organizations (Brusoni et al., Citation2006). Last but not least, firms may apply for a patent for strategic purposes, which are different from the legal protection of an invention (Blind, Edler, Frietsch, & Schmoch, Citation2006; Torrisi et al., Citation2016). Bearing in mind these limitations, patents nevertheless constitute a relevant and unique proxy to study the inventive activities of companies (Acs & Audretsch, Citation1989; De Rassenfosse, Dernis, Guellec, Picci, & van Pottelsberghe de la Potterie, Citation2013; OECD, Citation2009).Footnote14 Further treating patent data as relational data, through, for instance, citations, gives considerable possibilities to analyse the patterns and dynamics of regional knowledge and innovation networks (Ter Wal & Boschma, Citation2009). We briefly remind the limitations related to patent citations below.
In relation to patent citation data, several limitations should also be underlined. First, as only citations made so far are known, this leads to systematic truncations in the number of citations. In other word, there is always the risk that the bulk of citations to a particular patent come or would come later in the stages of technological development.
Second, citation practices differ across offices, which may lead to different citation intensities (OECD, Citation2009), reflecting examiners rather than firms or inventors’ behaviours (Alcacer & Gittelman, Citation2006, on USPTO citations data). This is particularly important in the present context where the coverage is limited to EPO (and PCT for cited), where the citations to prior art, known as the ‘duty of candour’, are optional (OECD, Citation2009). It implies that most citations may be added during the examining phase, thus citations are inherently a very noisy measure.
Third, as underlined by Hall et al. (Citation2005), there is a kind of citation ‘inflation’ as more patents are combined with more citations, suggesting that later citations are less significant than earlier ones from a statistical perspective.
Fourth, as for the patents they relate to, the citations show technological and sectoral specific patterns partially due to the degree of technological dependence or cumulativeness in the given technological field or industry; thus, backward citation intensities will inherently differ across technologies and industries.Footnote15
However, as underlined by the OECD (Citation2009), patent citations yield relevant opportunities to analyse the origins, the evolution of technologies and the diffusion of knowledge between inventing organizations or individuals, institutions and geographical areas. Furthermore, and this is the case for the present study, several studies following the seminal works of Jaffe (Citation1986) and Jaffe et al. (Citation1993) confirm that an appropriate and careful use of citations data can reveal key patterns of knowledge flows and spillovers, thus greatly contributing to our knowledge on how technologies are created and diffused over time and space (e.g., Aldieri, Citation2011; Jaffe & Trajtenberg, Citation1999; Sorenson, Rivkin, & Fleming, Citation2006; Ter Wal & Boschma, Citation2009).
The next section presents the methodological approach focusing on the tools and insights offered by the SNA and the graph theory.
Table 1. Main indicators for the analysis of the matrix of technological knowledge flows.
Data structure and main indicators
We use the regionalized backward citations of top corporate R&D investors to build up the aggregated matrices of technological knowledge flows between regions. They serve as the primary input to assess mainly:
the centralities of regions within the interregional knowledge flows; and
the relative influences of individual firms in the position of individual regions.
As shown in , the rows of the matrix correspond to regions to which the cited patents are assigned to, while the columns of the matrix refer to the citing region.
Figure 1. Matrix of cited region (row) x citing region (column) x firm.
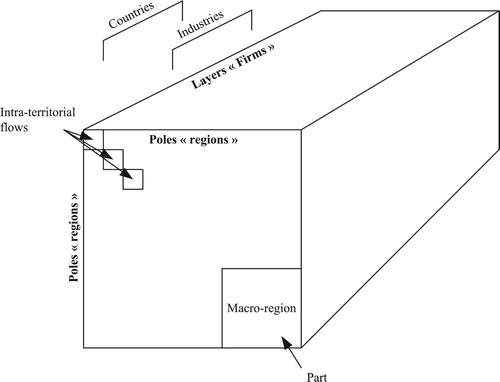
Each generic element or cell measures the extent (or weight) of the technological knowledge inflows from region i to region j. These matrices can be disaggregated in several layers or firms () – or related aggregates such as industries and countries of headquarters as well as technological domains or fields.
The flows of knowledge from a region towards another region are quantified employing a procedure that breaks down every citation according to the weight of a relation region × r. × citing firm. These matrices constitute the main input for the data treatment and computations of the indicators presented further below (). In reference to , Appendix C in the supplemental data online provides an example of the construction of a technological flow matrix and the related influence matrix.
The main indicators retained for the analysis are summarized as follows:
The betweenness centrality of a pole (region) corresponds to the ratio between the diagonal cofactors of the influence matrix and the determinant of the matrix. The values obtained for each territory are superior or equal to 1. The more central the territory is, the more it contributes to the cohesiveness of the network and the higher will be the ratio. The value of
corresponds to the extent to which the pole
The betweenness centrality of a layer (firm). The basic principle consists in excluding from the aggregated structure the flows specific to each layer, which allows one to compute the determinants of the partial graphs. Their values increase as much as the given layers contribute to the global circularities. The value of
The contribution of the layers to the poles centrality. The exclusion principle holds again: by removing, for each layer, the flows related to a selected pole, we can derive a ranking of the different layers according to the circularities they internalize on the selected pole. The value of
EMPIRICAL OBSERVATIONS
The centrality of regions in the knowledge networks of R&D leading firms
provides the ranking of the most central regions based on the betweenness indicator. The observations support prior findings in terms of spatial concentration and regional hierarchy in the geography of corporate knowledge flows across world regions. The analysis shows that these findings hold true for the knowledge flows initiated by large R&D-driven firms. Expectedly, the most central regions mainly include capital-regions (Capital Region in Korea, Helsinki-Uusimaa in Finland, Ile-de-France in France, Kanto in Japan) or world-class thematic regional cluster (California in the United States, Kinki in Japan).
Table 2. Betweenness centrality of regions.
Focusing on European territories, the highest centrality scores exclusively feature regions ranking as innovation leaders or strong innovators.Footnote16 All together, these territories belong to the densest transregional clusters and often reach the critical mass and the related variety to impact on technological development and diffusion in Europe. Moreover, the innovation leaders’ or strong innovators’ regions present strong connections and interactions with other central knowledge-producing regions, also through channels established by MNEs, as our analysis would suggest. Importantly, more aggregated analyses confirm that the ranking of regions remains consistent, also when all regional patents (REGPAT data set) and citations are considered. This is in line with the leading role of these firms in the development of new technologies (Dernis et al., Citation2015) and their abilities to build up and manage global knowledge pipelines.
Moreover, Japanese and Korean regions’ high centrality indicates that these regions are able to attract the ‘well-networked’ companies. Such companies are able, based on home and host-countries knowledge, to absorb geographically dispersed and cumulated technological knowledge in order to produce new technological knowledge and to diffuse knowledge produced locally over a wide geographical space. Also, this result somehow reflects the specialization of these Asian companies’ groups oriented towards highly patenting sectors and general purpose technologies (e.g., information and communication technologies; Dernis et al., Citation2015), and the associated connectedness and attractiveness of the hosting territories for other groups of large R&D-investing firms.
Regions and the firm: the contribution of top R&D investors to the centrality of regions
shows the upper part of the ranking based on our third indicator for Southern Kanto (Japan), Lemanic Region (Switzerland) and Ile-de-France (France). They belong to the top 10 most central territories. While there is no strong industrial determinism, the most central contributors are domestic groups. Indeed, our centrality scores derive from the aggregated behaviour of specific sets of large (domestic) firms and their relations to other institutions, which can belong to any category of patenting actors, for example, university, research centres, firms, individual, etc. Yet, the most central firms (see Appendices C and D in the supplemental data online) appear more geographically diversified than what one could have expected from the ranking of regions. To illustrate these results, we break down at the corporate level the interregional flows for the three most central firms: Siemens (Germany, Electrical Components & Equipment), General Electric (United States, General Industrials) and Valeo (France, Automobiles & Parts) (see Appendices C and D online).
Table 3. Contribution of firms (layers) to regions’ centrality: selected regions (poles).
The firm-regions graphs confirm the important (geographical) diversity of regional sources exploited by top corporate R&D investors in order to generate knowledge across fewer poles. This observation indicates that, in spite of a given hierarchy between regions, many of them may assume a role in the technological knowledge creation. In the RIS3 framework, this argument has been underlined in relation to the different roles of leaders’ and followers’ regions in the invention, development and diffusion of general purposes technologies (see Bresnahan, Citation2010, on GPTs). A main rationale is that only few regions will be central for the invention of fundamental knowledge needed for the development of GPTs and tools. Followers regions will rather develop the applications of the GPT in one or several regional economic domains. In our framework, this also means that not all regions should try to attract ‘well-connected’ firms. Home regions should instead focus on identifying which local actors to engage in strategy development, but also possibly to identify other regions and companies in other regions that could be directly vital to the success of the home regions’ strategy towards transformation (as opposed to perpetuation of low growth positioning).
Besides, understanding regions–firms links (and vice versa) also matter as large and well-connected firms may importantly contribute to local knowledge spillovers and upgrading of local capabilities, as well as act as connection channels for (other) regional actors, that is, smaller firms, universities to more relevant global knowledge sources. Indeed, larger firms have played a fundamental role in setting up and managing such non-local connections. Moreover, in peripheral regions and/or in cases of RIS3 that are quite ‘thin’, the development of new industrial paths will often require one or few strong organizations with global knowledge linkages (Trippl, Grillitsch, & Isaksen, Citation2018).
CONCLUSIONS
Bringing together regions and firms, our study provides novel insights on interregional and technological patterns of knowledge creation. Applied to firms or organizations, the combination of SNA and graph theory offers relevant tools for regions to better integrate network perspectives into the design of their RIS3. In the EU regional policy context, a better understanding of how (actors from) different regions connect through large firms’ pipelines is a particularly valuable knowledge. The related evidence can inform policies that aim at fostering the interregional innovation networks and the participation of EU regions into global innovation networks.
The empirical observations confirm prior findings in terms of spatial concentration, complexity (or density) and regional hierarchy in the geography of corporate knowledge flows across world regions. Importantly, the most central firms appear geographically more dispersed than the ranking of territories would suggest. Combined to the diversity of regional knowledge sourcing, this supports the fact that indeed many regions can assume a role in the creation of knowledge at local and global levels. But, only a few of them should expect to host the top ‘well-connected’ or most central firms, though all are welcome to pursue attracting or generating them; yet, on the one hand RIS3 require evidence on the concentration and integration of local and techno-industrial capabilities in strategic groups of actors. On the other hand, the outward orientation implies that regions should benchmark their position, identify key stakeholders and companies for regional partnerships and relevant external knowledge sources. This obviously would require regions to map their existing knowledge assets and networks and the local entrepreneurial potential and opportunities in order to better connect themselves to exogenous knowledge sources, for instance through relevant regional and globally embedded organizations.
Furthermore, the combination of network analysis and graph theory approaches opens up several analytical perspectives, among which only few ones have been shown here. First, our approach can help in looking at connections and networks for a specific domain of (inter)-regional interest. Second, the availability of firm-level and regional network data over longer time periods could allow analysing emerging trends and identifying which organizations, domains and regions are becoming more important over time. Last but not least, extending our approach to scientific linkages or citations can offer important insights for RIS3 priority selection by shedding light on the regional scientific communities’ works and their possible correspondences with new activities performed by the regional industrial tissue.
Supplemental Material
Download PDF (1.5 MB)DISCLOSURE STATEMENT
The analyses presented in this paper do not necessarily represent the views of the European Commission. Neither the European Commission nor anyone acting on its behalf can be held responsible for any use made thereof.
Notes
1. The mathematical graphs theory analyses the properties of structures made up of nodes (regions in our analysis) and links (citations) connecting these nodes.
2. The ranking is based on the 2013 EU Industrial R&D and Investment Scoreboard; see http://iri.jrc.ec.europa.eu/scoreboard13.html/.
3. See Appendix A in the supplemental data online.
4. See http://www.epo.org/.
6. For statistics on the companies included in the annual scoreboards, see http://iri.jrc.ec.europa.eu/scoreboard.html/.
7. For more information on IMALINKER, see http://www.idener.es/?portfolio=imalinker/.
8. The ORBIS database is a private database providing private company information on financials, corporate structure, merger and acquisition deals, etc; see http://www.bvdinfo.com/en-gb/our-products/company-information/international-products/orbis/.
9. This is especially important for the companies analysed here, as many patents are filed by large companies having several establishments or subsidiaries located in different regions and countries.
10. See Appendix A in the supplemental data online.
11. The NUTS nomenclature subdivides the economic territory of the EU into regions at three different levels (NUTS-1–3 respectively, moving from larger to smaller territorial units). Above NUTS-1, there is the ‘national’ level of the member states. For a section dedicated to the NUTS, see http://ec.europa.eu/eurostat/web/nuts/overview/.
13. For critical reviews and discussions about the use of citations, see Alcacer and Gittelman (Citation2006).
14. See also Gambardella (Citation2013) for a state of the art on the debate about the economic value of patented inventions.
15. Also, mainly due to the focus of our analysis (regions and top R&D-investing firms) and the matched data set, the intersectoral and interdiscipline knowledge flows are not explored; indeed, while citing patents are assigned to a firm, the same does not hold for the regionalized cited patents, which spread over more than 20 years.
16. For the regional innovation scoreboards, see http://ec.europa.eu/growth/industry/innovation/facts-figures/regional_en/.
Related Research Data
REFERENCES
- Acs, Z. J., & Audretsch, D. B. (1989). Patents as a measure of innovative activity. Kyklos, 42(2), 171–180. doi: 10.1111/j.1467-6435.1989.tb00186.x
- Alcacer, J., & Gittelman, M. (2006). Patent citations as a measure of knowledge flows: The influence of examiner citations. Review of Economics and Statistics, 88(4), 774–779. doi: 10.1162/rest.88.4.774
- Aldieri, L. (2011). Technological and geographical proximity effects on knowledge spillovers: Evidence from the US patent citations. Economics of Innovation and New Technology, 20(6), 597–607. doi: 10.1080/10438599.2011.554632
- Aldieri, L., & Vinci, C. P. (2016). Technological spillovers through a patent citation analysis. International Journal of Innovation Management, 20(2), 1–23. doi: 10.1142/S1363919616500286
- Azagra-Caro, J. M., & Consoli, D. (2016). Knowledge flows, the influence of national R&D structure and the moderating role of public–private cooperation. Journal of Technology Transfer, 41(1), 152–172. doi: 10.1007/s10961-014-9382-7
- Bakker, J., Verhoeven, D., Zhang, L., & Van Looy, B. (2016). Patent citation indicators: One size fits all? Scientometrics, 106(1), 187–211. doi: 10.1007/s11192-015-1786-0
- Berge, C. (1958). Théorie des graphes et ses applications. Paris: Dunod.
- Blind, K., Edler, J., Frietsch, R., & Schmoch, U. (2006). Motives to patent: Empirical evidence from Germany. Research Policy, 35, 655–672. doi: 10.1016/j.respol.2006.03.002
- Borgatti, S. P. (2005). Centrality and network flow. Social Networks, 27, 55–71. doi: 10.1016/j.socnet.2004.11.008
- Borgatti, S. P., & Everett, M. G. (2006). A graph-theoretic perspective on centrality. Social Networks, 28, 466–484. doi: 10.1016/j.socnet.2005.11.005
- Boschma, R., & Gianelle, C. (2014). Regional branching and Smart Specialisation policy (JRC Technical Reports No. 06/2104). Luxembourg: Publications Office of the European Union.
- Boschma, R., & Iammarino, S. (2009). Related variety, trade linkages, and regional growth in Italy. Economic Geography, 85(3), 289–311. doi: 10.1111/j.1944-8287.2009.01034.x
- Bresnahan, T. F. (2010). General purpose technologies. In B. Hall & N. Rosenberg (Eds.), Handbook in economics of innovation (pp. 761–792). Amsterdam: North-Holland Elsevier.
- Brusoni, S., Crespi, G., Francoz, D., Gambardella, A., Garcia-Fontes, W., Geuna, A., … Romanelli, M. (2006). Everything you always wanted to know about inventors (but never asked): Evidence from the PatVal-EU Survey (CEPR Discussion Paper No. 5752).
- De Rassenfosse, G., Dernis, H., Guellec, D., Picci, L., & van Pottelsberghe de la Potterie, B. (2013). The worldwide count of priority patents: A new indicator of inventive activity. Research Policy, 42(3), 720–737. doi: 10.1016/j.respol.2012.11.002
- Defourny, J., & Thorbecke, E. (1984). Structural path analysis and multiplier decomposition within a social accounting matrix framework. Economic Journal, 94, 111–136. doi: 10.2307/2232220
- Dernis, H., Dosso, M., Hervás, F., Millot, V., Squicciarini, M., & Vezzani, A. (2015). World corporate top R&D investors: Innovation and IP bundles (JRC and OECD Common Report). Luxembourg: Publications Office of the European Union.
- European Commission, EC. (2012). Guide to research and innovation strategies for Smart Specialisation (RIS 3). Brussels: European Commission.
- European Commission, EC. (2013). The 2013 EU industrial R&D investment scoreboard. European Commission – JRC, IPTS. Luxembourg: Publications Office of the European Union.
- European Patent Office (EPO). (2014). Data catalog PATSTAT 2014 autumn edition. Retrieved from http://www.epo.org/searching/subscription/raw/product-14-24.html
- Fontana, R., Nuvolari, A., & Verspagen, B. (2009). Mapping technological trajectories as patent citation networks. An application to data communication standards. Economics of Innovation and New Technology, 18(4), 311–336. doi: 10.1080/10438590801969073
- Foray, D. (2015). Smart specialisation, opportunities and challenges for regional innovation policy. Abingdon: Routledge.
- Freeman, L. C. (1978). Centrality in social networks conceptual clarification. Social Networks, 1(3), 215–239. doi: 10.1016/0378-8733(78)90021-7
- Friedkin, N. E. (1991). Theoretical foundations for centrality measures. American Journal of Sociology, 96(6), 1478–1504. doi: 10.1086/229694
- Gambardella, A. (2013). The economic value of patented inventions: Thoughts and some open questions. International Journal of Industrial Organization, 31(5), 626–633. doi: 10.1016/j.ijindorg.2013.02.007
- Gianelle, C., Kyriakou, D., Cohen, C., & Przeor, M. (Eds.). (2016). Implementing smart specialisation: A handbook (EUR 28053 EN). Brussels: European Commission.
- Griliches, Z. (1990). Patent statistics as economic indicators: A survey. Journal of Economic Literature, 28, 1661–1707.
- Hall, B. H., Jaffe, A., & Trajtenberg, M. (2005). Market value and patent citations. RAND Journal of Economics, 36(1), 16–38.
- Harary, F. (1969). Graph theory. Reading: Addison-Wesley.
- Huggins, R., & Thompson, P. (2014). A network-based view of regional growth. Journal of Economic Geography, 14(3), 511–545. doi: 10.1093/jeg/lbt012
- Jaffe, A. B. (1986). Technological opportunity and spillovers of R&D: Evidence from firms' patents, profits, and market value. American Economic Review, 76(5), 984–1001.
- Jaffe, A. B., & Trajtenberg, M. (1999). International knowledge flows: Evidence from patent citations. Economics of Innovation and New Technology, 8(1–2), 105–136. doi: 10.1080/10438599900000006
- Jaffe, A. B., & Trajtenberg, M. (2002). Patents, citations, and innovations: A window on the knowledge economy. Cambridge, MA: MIT Press.
- Jaffe, A. B., Trajtenberg, M., & Fogarty, M. (2000). Knowledge spillovers and patent citations: Evidence from a survey of inventors. American Economic Review, 90(2), 215–218. doi: 10.1257/aer.90.2.215
- Jaffe, A. B., Trajtenberg, M., & Henderson, R. (1993). Geographic localization of knowledge spillovers as evidenced by patent citations. Quarterly Journal of Economics, 108(3), 577–598. doi: 10.2307/2118401
- Lantner, R. (1974). Théorie de la dominance économique. Paris: Dunod.
- Lantner, R. (2001). Influence graph theory applied to structural analysis. In M. L. Lahr & E. Dietzenbacher (Eds.), Input–output analysis: Frontiers & extensions (pp. 297–317). London: Palgrave Macmillan.
- Lantner, R., & Carluer, F. (2004). Spatial dominance: A new approach to the estimation of interconnectedness in regional input–output tables. Annals of Regional Science, 38, 451–467. doi: 10.1007/s00168-003-0178-1
- Lantner, R., & Lebert, D. (2015). Dominance et amplification des influences dans les structures linéaires. Économie Appliquée, 68(3), 143–166.
- Maraut, S., Dernis, H., Webb, C., Spiezia, V., & Guellec, D. (2008). The OECD REGPAT database: A presentation (OECD STI Working Papers No. 2008/02).
- Maurseth, B., & Verspagen, B. (2002). Knowledge spillovers in Europe: A patent citations analysis. Scandinavian Journal of Economics, 104(4), 531–545. doi: 10.1111/1467-9442.00300
- McCann, P., & Ortega-Argilés, R. (2015). Smart specialization, regional growth and applications to European Union cohesion policy. Regional Studies, 49(8), 1291–1302. doi: 10.1080/00343404.2013.799769
- Organisation for Economic Co-operation and Development (OECD). (2009). The use and analysis of citations in patents. In OECD Patent Statistics Manual. Paris: OECD.
- Organisation for Economic Co-operation and Development (OECD). (2013). Innovation-driven growth in regions: The role of smart specialisation. Paris: OECD.
- Peri, G. (2005). Determinants of knowledge flows and their effect on innovation. Review of Economics and Statistics, 87(2), 308–322. doi: 10.1162/0034653053970258
- Radosevic, S., Curaj, A., Gheorghiu, R., Andreescu, L., & Wade, I. (Eds.). (2017). Advances in the theory and practice of smart specialisation. London: Academic Press/Elsevier.
- Rave, T., & Goetzke, F. (2013). Climate-friendly technologies in the mobile air-conditioning sector: A patent citation analysis. Environmental Economics and Policy Studies, 15(4), 389–422. doi: 10.1007/s10018-013-0069-3
- Rodríguez-Pose, A., & Crescenzi, R. (2008). Research and development, spillovers, innovation systems, and the genesis of regional growth in Europe. Regional Studies, 42(1), 51–67. doi: 10.1080/00343400701654186
- Sorenson, O., Rivkin, J. W., & Fleming, L. (2006). Complexity, networks and knowledge flow. Research Policy, 35(7), 994–1017. doi: 10.1016/j.respol.2006.05.002
- Ter Wal, A. L., & Boschma, R. A. (2009). Applying social network analysis in economic geography: Framing some key analytic issues. Annals of Regional Science, 43(3), 739–756. doi: 10.1007/s00168-008-0258-3
- Torrisi, S., Gambardella, A., Giuri, P., Harhoff, D., Hoisl, K., & Mariani, M. (2016). Used, blocking and sleeping patents: Empirical evidence from a large-scale inventor survey. Research Policy, 45(7), 1374–1385. doi: 10.1016/j.respol.2016.03.021
- Trajtenberg, M. (1990). A penny for your quotes: Patent citations and the value of innovations. RAND Journal of Economics, 21, 172–187. doi: 10.2307/2555502
- Trippl, M., Grillitsch, M., & Isaksen, A. (2018). Exogenous sources of regional industrial change: Attraction and absorption of non-local knowledge for new path development. Progress in Human Geography, 42(5), 687–705. doi: 10.1177/0309132517700982
- Uyarra, E., Sörvik, J., & Midtkandal, I. (2014). Inter-regional collaboration in research and innovation Strategies for Smart Specialisation (RIS3). Seville: European Commission.
- Valente, T. W., Coronges, K., Lakon, C., & Costenbader, E. (2008). How correlated are network centrality measures? Connections, 28(1), 16–26.
- Verspagen, B., & de Loo, I. (1999). Technology spillovers between sectors and over time. Technological Forecasting and Social Change, 60, 215–235. doi: 10.1016/S0040-1625(98)00046-8
- Verspagen, B., & Schoenmakers, W. (2004). The spatial dimension of patenting by multinational firms in Europe. Journal of Economic Geography, 4(1), 23–42. doi: 10.1093/jeg/4.1.23
- Wanzenböck, I., Scherngell, T., & Brenner, T. (2014). Embeddedness of regions in European knowledge networks: A comparative analysis of inter-regional R&D collaborations, co-patents and co-publications. Annals of Regional Science, 53(2), 337–368. doi: 10.1007/s00168-013-0588-7
- Wasserman, S., & Faust, K. (1994). Social network analysis: Methods and applications. Cambridge: Cambridge University Press.
- Webb, C., Dernis, H., Harhoff, D., & Hoisl, K. (2005). Analyzing European and international patent citations: A set of EPO database building blocks (STI Working Paper No. 2005/9). Paris: OECD.