
 ?Mathematical formulae have been encoded as MathML and are displayed in this HTML version using MathJax in order to improve their display. Uncheck the box to turn MathJax off. This feature requires Javascript. Click on a formula to zoom.
ABSTRACT
Support for parties opposed to European Union (EU) integration has risen rapidly, and a wave of discontent has taken over the EU. This discontent is purportedly driven by the very factors behind the surge of populism: differences in age, wealth, education, or economic and demographic trajectories. This paper maps the geography of EU discontent across more than 63,000 electoral districts in the EU-28 and assesses which factors push anti-EU voting. The results show that the anti-EU vote is mainly a consequence of local economic and industrial decline in combination with lower employment and a less educated workforce. Many of the other suggested causes of discontent, by contrast, matter less than expected, or their impact varies depending on levels of opposition to European integration.
INTRODUCTION
This paper provides the first comprehensive overview of the anti-European Union (EU) vote for the whole of the EU at a fine geographical scale. We map the share of the votes for parties that oppose EU integration in the last national election between 2013 and 2018 across more than 63,000 electoral districts in the 28 current member states of the EU. We distinguish between three different levels of EU opposition: strongly opposed, opposed and somewhat opposed. The share of the anti-EU vote is then regressed on a series of factors that reflect the three dominant explanations of anti-system votes in Europe: the personal characteristics of people ‘left-behind’; disparities in age, education and income; and different types of long-term territorial decline.
The results of the analysis indicate that the anti-EU vote is mainly driven by a combination of long-term economic and industrial decline, low levels of education, and a lack of local employment opportunities. Once these factors are taken into consideration, well-off places are more likely to vote for anti-EU parties than places that are worse off, in contrast to explanations linking anti-establishment voting with poor people living in poor places. Moreover, other factors that have featured prominently as drivers of populism – such as ageing, rurality, remoteness, employment decline and population decline – seem to matter much less or matter in different ways (depending on the strength of opposition to EU integration considered).
To demonstrate this, the paper is structured as follows. The next section describes how the public's opinion of the EU has deteriorated over the past 15 years, how anti-EU votes have grown and how this is linked to, but also different from, voting for populist parties. The following section analyses the vote for parties against EU integration. This is followed by an overview of what factors are linked to anti-EU voting. The core of the paper deals with the method and data and presents the results of the econometric analysis. The final sections discuss the results, providing a recap on the reasons behind the rapid surge of a geography of EU discontent, and offer some conclusions and policy implications.
THE GROWING DISENCHANTMENT WITH THE EUROPEAN UNION
On 24 June 2016 the citizens of UK and those of the rest of the world woke up to the news that Britain had voted by a slim majority to leave the EU. This came as a huge surprise as, although many polls had predicted a tight outcome of the vote, the overwhelming expectation – including by most leaders of the leave vote – was that Britain would remain in the EU. It showed that support – albeit often distinctly lukewarm or ambivalent – for the remain option from most UK parties and the benefits of remaining in the EU trumpeted by a multitude of experts were not enough to win the referendum. The outcome has been described in many ways, from the ‘will of the people’ to a flawed result based on misinformation, but its consequences will profoundly shape the future of the UK and the rest of the EU.
Furthermore, the public opinion in the UK around the time of the referendum was not the most anti-EU. In seven member states more people tended not trust the EU in 2016 than in the UK (Eurobarometer). This led to heightened speculations about other referenda about leaving the EU.
The ‘Brexit’ vote, however, was not the first sign of a growing disenchantment with the EU. The share of the votes for parties opposed to EU integration, as defined by the Chapel Hill Expert Survey (CHES),Footnote1 has been steadily increasing over the last 15 years (). The vote for parties (strongly) opposed to EU integration grew from 10% to 18% between 2000 and 2018. The same upward trend remains if we include the parties somewhat opposed to EU integration: from 15% in 2000 to 26% in 2018. This is not the result of more votes in the UK going to anti-EU parties (although they did). The vote against EU integration increased by almost the same amount in the EU without the UK.
Figure 1. Share of vote for parties that oppose European Union integration in the EU-28, 2000–18.
Source: Authors’ own elaboration based on Chapel Hill Expert Survey (CHES) data and national sources.
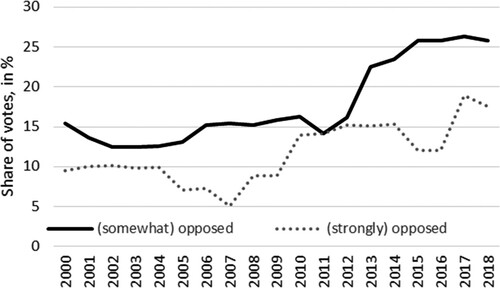
Parties (strongly) opposed to European integration tend to advocate leaving the EU – as has been the case with the UK Independence Party (UKIP), the Dutch Party for Freedom or the French Rassemblement National – or a scaling back of the EU to a loose confederation of states – as posited by the Italian Lega, the German Alternative für Deutschland (AfD) or the Hungarian Jobbik.Footnote2 Parties somewhat opposed to European integration, such as the Italian Movimento Cinque Stelle (Five Star Movement), the Hungarian Fidesz and the UK Conservatives (before the referendum), want the EU to change substantially, but they do not always advocate leaving the union or turning it into a loose coalition of sovereign states.
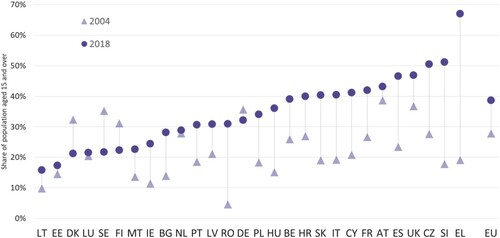
The increase in the vote for parties opposed to EU integration is, in part, a reflection of the changing public opinion. In 2004, only 28% of the population aged 15 years and over did not to trust the EU. This share increased to 47% in 2012 and dropped to 39% in 2018. Between 2004 and 2018, the share of the population that distrusts the EU increased by more than 20 percentage points in nine member states (). In Greece, the level of distrust increased by 48 percentage points. As a result, two-thirds of the Greek population tends not to trust the EU, the highest share among EU member states. In Greece, this opinion is also reflected in a high share of the vote for parties against EU integration, but this is not always the case. Denmark, for example, has one of the lowest levels of distrust, but one of the highest shares of vote for parties (strongly) opposed to EU integration. In Spain, the opposite is the case. It has the fifth highest distrust of the EU, but no significant party yet against EU integration.
Figure 2. Share of the population that tends not to trust the European Union, 2004–18.
Source: Authors’ own elaborations based on Eurobarometer data.
VOTE AGAINST EU INTEGRATION AND THE VOTE FOR POPULIST PARTIES: LINKED BUT DISTINCT
Voting against EU integration
In many EU member states, parties (strongly) opposed to EU integration have become a force to be reckoned with. Parties (strongly) opposed to EU integration gathered more than 25% of the vote in the last national electionFootnote3 in three EU member states: Austria, Denmark and France (). If the parties somewhat opposed to European integration are included, 10 member states had a share of over 25%. In Greece, Hungary, Italy and the UK the share was over 50% ().
Figure 3. Votes by party position on European Union integration, 2014–18.
Note: Countries are ranked by vote share (strongly) opposed, somewhat opposed and (somewhat) in favour. Source: Authors’ own elaboration based on Chapel Hill Expert Survey (CHES) data and national sources.
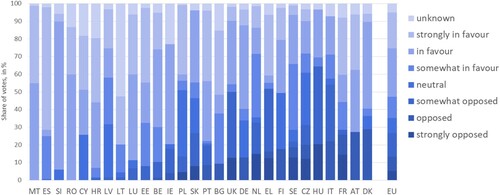
Some countries, such as Cyprus, Malta, Romania, Slovenia and Spain, have so far remained relatively immune to the anti-EU wave. In Croatia and the Baltic countries, Euroscepticism remains marginal with less than 5% going to parties (somewhat) opposed to EU integration. However, these countries are increasingly the exception, not the rule ().
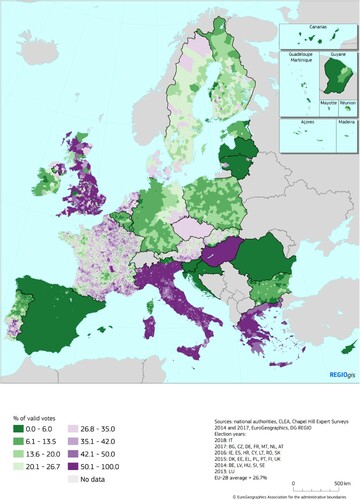
Measuring the share of the anti-EU vote in the last national legislative election in over 63,000 electoral constituencies produces a detailed map of the geography of EU discontent ().
Figure 4. Minimum share of the vote for parties opposed or strongly opposed to European integration, 2013–18.
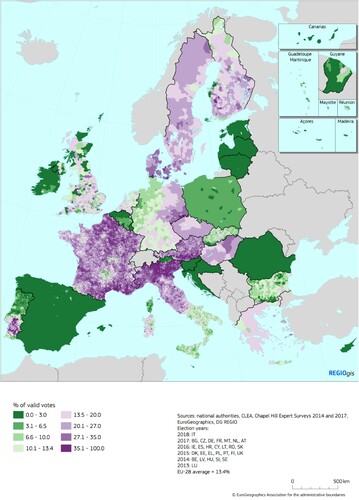
Votes for parties opposed and strongly opposed to European integration are spread across many parts of the EU. Southern Denmark, northern Italy, southern Austria, eastern Germany, eastern Hungary or southern Portugal are hotspots of anti-EU voting. Rural areas and small towns are more Eurosceptic than bigger cities. The anti-European vote is far lower in the French cities of Lille, Metz, Nancy or Strasbourg than in the surrounding countryside (). The same applies in eastern Germany, where the anti-European vote is far less prominent in Berlin, Dresden or Leipzig than in the surrounding areas, or in northern Italy, pitching the two largest cities in the area – Milan and Turin – against a large number of medium-size cities, such as Bergamo, Brescia, Cremona, Mantua, Pavia or Vercelli, and smaller cities and rural areas. Northern and eastern Denmark, Sweden, Finland and the Czech Republic also have a strong presence of radical anti-European parties.
Votes for parties strongly opposed to European integration are virtually inexistent in Spain, the Baltics, Poland, Slovenia, Croatia, Romania, Belgium or Ireland. It is also much less of an issue in western Germany (and, especially in its north-western fringe), Bulgaria, northern Portugal or Slovakia. The share of the vote for extreme anti-European parties also remains rather low in the Netherlands and the UK.
When the share of the vote for moderate anti-European parties is taken into consideration, the panorama changes substantially (). The geography of votes for parties moderately opposed to European integration almost fully encompasses the whole of Greece, Hungary and Italy. Here, indeed, the moderate anti-Europeans of Syriza, Fidesz and the Five Star Movement (in coalition with more radically anti-EU integration Lega), respectively, reached power after the last election. Many areas of the UK are also at this level, while more than one-fifth of the electorate in large swaths of the Czech Republic, the Netherlands, France, Austria, southern Denmark and Slovakia voted for anti-European parties.
Figure 5. Minimum share of the vote for parties somewhat opposed, opposed or strongly opposed to European integration, 2013–18.
Lower shares of moderate anti-Europeanism are found in Poland, western Germany, Ireland and Portugal, while Spain, Romania, Croatia, Slovenia and most of the Baltics have, so far, been relatively spared from all types of anti-Europeanism ().
Another factor worth noting is that the presence of moderately anti-EU parties, pervasive in the UK, Greece, Hungary, the Czech Republic, Slovakia, the Netherlands, Italy or Poland is almost non-existent in places such as Germany, Bulgaria, Finland or Denmark, and only a minor phenomenon in Sweden ().
Populism in the EU
What determines whether a vote for a given party is a populist or an anti-system vote? Defining what is populism is hotly debated within political science. Even the very use of the term ‘populism’ is under scrutiny. In general, populist or anti-system parties pitch the ‘people’ against supposedly self-interested and sometime aloof ‘elites’. In defining the ‘people’ and ‘elites’, populist parties create a dichotomy of ‘us’ against ‘them’, identifying ‘them’ or ‘the other’ as the antagonist and foe.
The 2014 and 2017 CHES assessed the role of anti-establishment and anti-elite rhetoric, often used as a proxy for identifying populist parties. Each political party received a score between 0 (not at all important) and 10 (extremely important). However, the early surveys did not contain this indicator, not allowing a trend analysis.
In the latest national elections, strong populism (rounded score of 10) captured 9% of the vote. Adding populist parties (score of 9) doubled the share to 18%. Including somewhat populist parties (score of 8) pushed the share up to almost a quarter (23%) of the votes coded by CHES.
Most populist parties are also anti-European integration (Polk & Rovny, Citation2017). It is increasingly argued that ‘European integration contributes to the emergence of populism – and hence, to the rise of Euroscepticism as a form of populism – by destabilizing domestic party systems’ (Leconte, Citation2015, p. 256). Buti and Pichelmann (Citation2017, p. 4) go even farther, asserting that ‘the EU has become a popular “punch bag”, an easy target and prey’ for populist rhetoric. Parties on the extreme right and left of the political spectrum agree in portraying ‘the faceless bureaucrats of Brussels as the “other”’ (Rodrik, Citation2018, p. 24). The EU is therefore identified – together with migrants – as the main opponent. Party programme after party programme, electoral manifesto after electoral manifesto, the EU is depicted as a threat to national identity, to democracy, and even to economic stability and progress.
The Dutch Freedom Party in its very short 2017–21 Programme puts the aim of taking the Netherlands out of the EU as its second objective (Partij voor der Vrijheid, Citation2017). UKIP similarly has promoted ‘a Britain released from the shackles of the interfering EU’ (UKIP, Citation2015, manifesto, 5). The French Rassemblement National, when it still was the National Front, had as it first objective of 144 electoral promises ‘to restore France's national sovereignty [by creating] a Europe of independent nations, at the service of the peoples’ (Rassemblement National, Citation2017, p. 3). This implied regaining ‘our freedom and the control of our destiny by restoring to the French people their (monetary, legislative, territorial, economic) sovereignty’ (p. 3).
Other populist and anti-system parties do not necessarily advocate for the abolition of or a withdrawal from the EU, but blame many of the current real or perceived ills on European integration. The 2016 Manifesto for Germany of the AfD states that ‘the EU has become an undemocratic entity, whose policies are determined by bureaucrats who have no democratic accountability’ (p. 16), and, therefore, it should be downgraded to ‘an economic union based on shared interests, and consisting of sovereign, but loosely connected nation states’ (p. 15). The Italian Lega considers:
the EU a gigantic supranational body, devoid of true democratic legitimacy and structured through a sprawling bureaucratic structure that dictates the agenda to our governments even at the expense of the physical and economic protection of the citizens of the individual Member States.
(Lega, Citation2018)
The biggest symbol of European economic integration, the euro, is also the target of most anti-establishment parties. The AfD (Citation2016, p. 18) posits that ‘the Euro actually jeopardises the peaceful co-existence of those European nations who are forced into sharing a common destiny by the Eurocracy’ and calls ‘for an end to the Euro experiment and its orderly dissolution’ (p. 17). Similarly, the Lega identifies ‘the euro [as] the main cause of our economic decline, a currency designed for Germany and multinationals and contrary to the needs of Italy and the small business’ (Lega, Citation2018). And, from the other end of the political spectrum, the Dutch SP argues that ‘we should stop prioritizing the survival of the Euro and the short term economic interests of large companies, banks and shareholders’ (SP, Citation2018).
The Italian Five Star Movement also has European integration in its sight. For it, the crisis profoundly altered the balance of power in Europe, meaning that ‘today the EU is influenced by a small group of states, thus affecting the very democratic character of the EU institutions’ (Movimento Cinque Stelle, Citation2018, p. 2).
Similar arguments are being reproduced in populist manifestos across Europe. This is the case of the Danish Red-Green Alliance or the Danish People's Party (Dansk Folkeparti), the Communist Party of Greece, Golden Dawn or Independent Greeks, the Austrian Freedom Party, Hungary's Jobbik, the Sweden Democrats and the Swedish Left Party, the Portuguese Unitary Democratic Coalition, and many other smaller anti-system parties (see Appendix B in the supplemental data online for the 40 most anti-European parties included in the analysis and their degree of Euroscepticism).
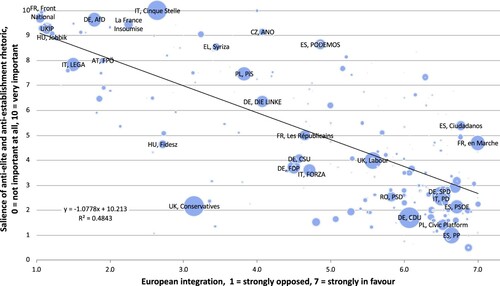
Despite the links between populism and anti-EU voting, the two issues are nevertheless distinct. For example, the Spanish Podemos scores high on anti-elite and anti-establishment rhetoric in the CHES, but is also rated as somewhat in favour of EU integration. The UK Conservatives (2014 rating), the Czech ODS (Civic Democratic Party) and the Dutch Christenunie all score very low on the use of anti-elite rhetoric, but are somewhat against EU integration. The two issues are statistically correlated, but populism only ‘explains’ about half the variation in anti-EU voting (R2 = 0.48) () (see also Appendix C in the supplemental data online).
Figure 6. Votes against European Union integration and populist parties in the EU-28, 2013–18.
The overlap between anti-EU voting and populism depends greatly on which measures of both factors are considered. When a narrow definition of one dimension and a broad one of the other is used, there is almost a perfect overlap:
Almost the entire vote (98%) for the most populist parties (10) in the EU also goes to parties that are at least somewhat opposed to EU integration.
Almost the entire vote (99%) for parties strongly opposed to EU integration also goes to parties that are at least somewhat populist (8–10).
Most (83%) of the vote for somewhat populist parties also goes to parties that are at least somewhat opposed to EU integration.
Only two-thirds (69%) of the vote for parties somewhat opposed to EU integration goes to parties that are at least somewhat populist (7–10).
Only 20% of the vote for the most populist parties goes to parties that are strongly opposed EU integration.
Only a third (35%) of the vote for the most populist parties goes to parties that are also strongly opposed to EU integration.
WHAT DETERMINES ANTI-SYSTEM AND ANTI-EU VOTES? THE THEORIES
To identify the main causes of the vote against European integration, we combine the theories proposed in research on anti-EU voting – such as the Brexit vote – with research on populism in Europe and beyond. Two types of, not mutually exclusive, explanations emerge from this literature.
First and foremost, research has concentrated on the individual characteristics of the anti-establishment voters. The archetype of the anti-system supporter has been identified as ‘older, working-class, white voters, citizens with few qualifications, who live on low incomes and lack the skills that are required to adapt and prosper amid the modern, post-industrial economy’ (Goodwin & Heath, Citation2016, p. 325). That is, the individuals left behind by the modern economy and processes are much more likely to turn to or find shelter in anti-establishment political options: ‘such “left-behind” voters feel cut adrift by the convergence of the main parties on a socially liberal, multicultural consensus, a worldview that is alien to them’ (Ford & Goodwin, Citation2017, p. 19).
Several factors have been identified as the individual features of those left behind. Age is one of the two most important (Essletzbichler, Disslbacher, & Moser, Citation2018; Ford & Goodwin, Citation2017; Goodwin & Heath, Citation2016; Gordon, Citation2018; Hobolt, Citation2016). Older voters are frequently portrayed as less capable at understanding or coping with economic changes, multiculturalism or immigration (Hobolt, Citation2016, p. 148; see also Ford & Goodwin, Citation2014), and thus more capable of displaying culturally conservative reactions (Gordon, Citation2018, p. 99).
Formal education – or, more exactly, a relative lack of it – is also considered a key source of the anti-system vote (Antonucci, Horvath, Kutiyski, & Krouwel, Citation2017; Becker, Fetzer, & Novy, Citation2017; Bonikowski, Citation2017; Essletzbichler et al., Citation2018; Gordon, Citation2018; Hobolt, Citation2016; Lee, Morris, & Kemeny, Citation2018; Rodrik, Citation2018; Tyson & Maniam, Citation2016). ‘Educational attainment is seen as a critical determinant of populist views, with those holding lower educational qualifications being more likely to be pro-Brexit’ (Lee et al., Citation2018, p. 151), populist or anti-European. Education is also frequently thought to be at the root of the localist/cosmopolitan divide that splits anti-establishment and mainstream party voters (Gordon, Citation2018, p. 110).
The third factor is generally income (Antonucci et al., Citation2017; Becker et al., Citation2017; Ford & Goodwin, Citation2017; Goodwin & Heath, Citation2016; Hobolt, Citation2016; Rodrik, Citation2018). The average anti-system and anti-European voter is not only older and less well educated but also poorer. Individuals on low incomes are much more likely to be Eurosceptic and vote accordingly (Antonucci et al., Citation2017; Becker et al., Citation2017; Ford & Goodwin, Citation2014).
Frequently age, education and income are lumped together to form the ‘holy trinity’ of the populist voter (Becker et al., Citation2017; Ford & Goodwin, Citation2014; Hobolt, Citation2016). As summarized by Los, McCann, Springford, and Thissen (Citation2017, p. 787) regarding Brexit:
citizens who were older, or lesser educated, or socially conservative or lower paid, were all more likely to vote leave, while those who voted remain tended to be on average more highly educated, younger, earning higher incomes and more socially progressive.
Alongside the individual factors, geographical characteristics have also been identified as powerful drivers behind the advent of a geography of EU discontent. The very term ‘geography of discontent’ refers to the unhappiness experienced by people living in a mix of stagnating and low-productivity regions – mainly rural areas and medium-sized and small cities – as a direct consequence of the limited opportunities and economic development prospects they face (Los et al., Citation2017, p. 788; see also Garretsen, Stoker, Soudis, Martin, & Rentfrow, Citation2018; McCann, Citation2018, Citation2019). It is also linked with what is known as the ‘great inversion’ (Moretti, Citation2012; Storper, Citation2013), that is, ‘a combination of job loss, declining labour-force participation or declining per-capita income relative to national averages’ (Martin, Tyler, Storper, Evenhuis, & Glasmeier, Citation2018, p. 9). Many of these places have also been caught in or have moved towards what is known as a middle-income trap (Iammarino, Rodríguez-Pose, & Storper, Citation2019), becoming increasingly incapable of sustaining economic growth as they are de facto not innovative enough to compete with the most productive regions of Europe and the world in high-skilled, high-value-added manufacturing and services, and too expensive to compete with less developed regions of Europe and emerging countries in low-cost manufacturing (Vandermotten, Capron, Decrolly, & Romus, Citation1990). The resulting discontent may have led many of these areas to use the ballot-box to ‘rebel against the feeling of being left behind; against the feeling of lacking opportunities and future prospects’ (Rodríguez-Pose, Citation2018, p. 190).
Several territorial factors have been highlighted by the literature as promoters of this geography of discontent. Migration is probably chief among them as it makes – together with a rejection of European integration – the core of many anti-system party manifestos (Becker et al., Citation2017; Ford & Goodwin, Citation2017; Goodwin & Heath, Citation2016; Goodwin & Milazzo, Citation2017; Hobolt, Citation2016; Lee et al., Citation2018; Rodrik, Citation2018).
According to Ford and Goodwin (Citation2017), migration became the issue that articulated the whole anti-establishment and anti-EU movement in the UK. The emergence of immigration as a central controversy in the mid-2000s led to a ‘surge in support for a new political challenger that swiftly became the primary vehicle for public opposition to EU membership, mass immigration, ethnic change, and the socially liberal and cosmopolitan values that had come to dominate the political establishment’ (p. 20). The arrival of migrants to a given territory often served as the catalyst to channel the economic and cultural fears of the local population. Fears of economic insecurity related to greater competition, increases in trade and the often unfounded, but deep-rooted, perceptions that the new arrivals could take away the jobs of locals (Guiso, Herrera, Morelli, & Sonno, Citation2017). Cultural fears connected with a supposed dilution of local or national identity as a result of the arrival of Muslim or Roma immigrants (Rodrik, Citation2018) or with a dilution of local distinctiveness in multiculturalism (Hobolt, Citation2016). Immigration in Europe is increasingly seen by voters as ‘as a source or symbol of rapid social change that threatens traditional identities and values.’ (Ford & Goodwin, Citation2017, p. 21).
Rurality and low population density have also starred in accounts of the rise of populist vote, mainly in the United States (Cramer, Citation2016; Rodden, Citation2016), but also in the case of Europe (Bonikowski, Citation2017; Essletzbichler et al., Citation2018; Gordon, Citation2018; Martin et al., Citation2018). In this respect, the surfacing of a geography of discontent in the US rustbelt and in the so-called flyover states was associated with the perception that rural voters were not getting their fair share of respect, attention and resources (Cramer, Citation2016). Anti-establishment voters have been found to cluster in rural and small-town America, whereas pro-establishment voters generally live in big cities (Rodden, Citation2016). Population density is key in this respect: the anti-system vote is closely related to relatively low population densities (Rodden, Citation2016). This may be a consequence of a cosmopolitan/traditional divide between cities and rural areas (Essletzbichler et al., Citation2018, p. 86). Geographical isolation has also attracted some attention (Lee et al., Citation2018).
Recently, there has been a stream of explanations focusing on economic decline (Becker et al., Citation2017; Essletzbichler et al., Citation2018; Goodwin & Heath, Citation2016; Johnson, Citation2015; Martin et al., Citation2018; Rodrik, Citation2018; Shafique, Citation2016; Tyson & Maniam, Citation2016). The post-2008 great recession is often mentioned in anti-European party manifestos (e.g., Movimento Cinque Stelle, Citation2018) as a driver of dissatisfaction. Academic research has also focused on the consequences of the crisis for votes (e.g., Algan et al., Citation2017). Globalization and trade competition are further justifications for the rise of anti-system vote – although Becker et al. (Citation2017) find little connection between these factors and Brexit voting.
It is Rodríguez-Pose (Citation2018) who has pushed this thesis farther in his ‘revenge of the places that don't matter’. For him, the anti-system vote is the response to long-term economic and industrial declines – starting well before the outbreak of the crisis – that have fuelled a discontent among the inhabitants of traditional industrial hubs and formerly prosperous places experiencing economic decay and lack of opportunities, in some cases for decades:
The areas left behind, those having witnessed long periods of decline, migration and brain drain, those that have seen better times and remember them with nostalgia, those that have been repeatedly told that the future lays elsewhere, have used the ballot box as their weapon to vent their anger against the establishment.
(p. 200)
PROVING THE THEORIES BEHIND THE GEOGRAPHY OF EU DISCONTENT
Most of the analyses feeding the theories about the geography of discontent and anti-system voting are based either on theoretical essays or on detailed analyses of one country and one election. This makes extracting and generalizing what drives anti-system voting, in general, and anti-European voting, in particular, difficult. Do the factors behind the Brexit vote, for example, explain the support for parties against European integration in Austria, Denmark, France, Italy or the Netherlands? Or are the drivers of anti-Europeanism intrinsically linked to country-specific characteristics?
In this paper we provide the first assessment of the drivers behind the votes for parties opposed to European integration across all member states of the EU, using a high level of granularity – covering more than 63,000 electoral districts in total.
The main aim of the analysis is to assess the extent to which long-term – economic, industrial, demographic and employment – decline is a key factor behind the vote for parties opposed to European integration in the most recent national legislative elections, assuming that different types of decline may have different links to the anti-European vote. Following the thesis of the ‘revenge of the places that don't matter’ (Rodríguez-Pose, Citation2018), it is hypothesized that economic and industrial decline will have a greater bearing on determining the share of the votes against European integration than demographic and employment decline.
We will also examine whether the role of other factors identified by the literature as drivers of anti-system voting – age, education, wealth, unemployment, migration, population density – remains unchanged once different types of economic decline are taken into consideration.
The model
In order to evaluate which factors drive the geography of EU discontent across the EU-28, the following model is adopted:(1)
(1) where
denotes the share of the anti-European vote in the most recent national legislative election until 2018;
represents the independent variable of interest: economic, industrial, demographic and employment change between 2000 and 2014 or 2016;
is a vector of other variables that have been identified by the literature as leading to increases in anti-system and populist vote – following the discussion in the previous section, these include: population density, rurality, regional wealth, employment, share of elderly population, education and migration; the Share non CHES vote
controls for the share of the votes going to parties not included in the CHES;
captures country-specific effects;Footnote4 and
denotes the error term.
Data and geographical units
Data
The dependent variable () depicts the share of valid votes for parties opposed to European integration – as defined by the CHES – in the last national legislative election at the time of writing (for the list and dates of elections covered in the analysis, see Appendix D in the supplemental data online), as defined by the CHES. Following the opinion of the political scientists involved in the CHES, the degree of opposition of a party to European integration is classified according to three different degrees of intensity: a party can be strongly, moderately or somewhat opposed to the European project. In the analysis we group the parties according to their degree of opposition to European integration. The first group includes only parties strongly opposed to European integration. The base group combines parties that are strongly opposed or opposed to integration. The final group encompasses all parties – including those moderately opposed – that manifest some hostility to the European project.
The votes for anti-European parties are gathered in number of votes and expressed as a share of valid votes. For several EU countries such data were retrieved from the CLEA data set (Kollman, Hicken, Caramani, Backer, & Lublin, Citation2016). This data set contains the latest election results at the constituency level. Where constituencies are relatively small, this represents a detailed spatial breakdown of the results. Nevertheless, in several countries, the constituencies are relatively large. Moreover, for several recent elections the results were not yet available in the CLEA data set. In these cases, the election results were retrieved from official national sources.
As not all parties in Europe are covered by the 2014 and 2017 CHES, the share of parties not included in the CHES () is introduced in the regression as a control variable. As seen in , the share of the votes for parties not included in the CHES is, at 5%, marginal. In most countries it remains below 10%. The main exception is Latvia, where it marginally exceeds 50% of the vote, whereas in Croatia, Cyprus and Ireland, it hovers around 20%. Parties not included in the CHES are generally independent parties or those that did not exist in 2017, the latest round of the CHES.
The independent variable of interest, Economic & demographic , stands for the degree of economic and demographic change in EU-28 electoral districts over the long run. Four different types of changes are considered. First is the average annual real growth of gross domestic product (GDP) per head at the NUTS-3 (Nomenclature of Territorial Units for Statistics) and metropolitan region levels. Second, the difference in the industrial employment share in total employment at the NUTS-3 level depicts industrial change. Employment change is represented by the compound annual percentage change in total employment at the NUTS-3 level, while demographic change is covered by the compound annual population growth at NUTS-3. The sources for all variables are Eurostat and Cambridge Econometrics. They cover the period between 2000 and 2014 (in the case of GDP per capita, overall and industrial employment change) or 2016 (in the case of population change).
Vector includes several variables that represent the aggregation at the level of electoral constituency of the individual and geographical factors identified in the theoretical section. Seven different variables are in this vector, including:
Density/rurality: we calculate the weighted population density for each constituency using the density (reference year 2011) of 1 km2 grid cells. For each cell, density is multiplied by the population count. The products are summed by electoral district and divided by the total population of the district, providing a measure of spatial concentration. This indicator is complemented by an indicator of rurality, measuring the population in each grid cell located outside urban clusters. The rural population is expressed as a share of the total population of the spatial unit. Whereas the rural population is 100% or 0% for many spatial units, the density indicator increases steadily from dispersed rural areas, to villages, suburbs, towns, and small, medium and large cities. This makes it a very suitable indicator to capture the urban–rural continuum.
Distance to the capital: the distance between each electoral constituency and its national capital in measured in kilometres as the geodesic distance (as the crow flies) between the geographical centroid of the electoral district and the centroid of the national capital.
Wealth: regional wealth is proxied by the GDP per capita in purchasing power standards at the regional and metropolitan region levels, expressed as an index of the EU-28 average for 2015.
Employment rate: employment rates are calculated using data from regional accounts, divided by population data for the age range 17–74 at the regional and metropolitan region levels in 2015.
Age: the share of the population aged 65 and over in the total population in 2017 is used as a proxy for an ageing society.
Education: education is depicted as the share of adults (25–64) with a tertiary education in 2017.
Net migration: the impact of migration is represented by the net migration rate, that is, the difference between the numbers people moving to the region and out of the region between 2000 and 2016 divided by the total population in 2000.
Constituency breakdown
The geographical breakdown of the units of analysis was performed at the finest possible electoral geographical scale. In order to deliver this geographical granularity, the CLEA data set and the electoral data from national sources were combined with dedicated geospatial data setsFootnote5 representing the boundaries of the electoral districts or of the smallest units for which election result data could be retrieved. Nevertheless, specific constituency boundaries were not always readily available in geospatial data sets for a majority of the EU member states.
To fill these gaps, two strategies were followed. First, in the cases of Greece, Hungary and Malta, the constituency level was converted or aggregated to the NUTS-3 regional level, without substantial losses in spatial detail. The second strategy was retrieving constituency boundaries from national sources or mapping the retrieved election results from national sources at a more detailed spatial level than constituencies. This method was successful for most countries. In some cases, constituencies or another election result-reporting unit needed to be grouped to ensure matching with the available boundary data sets. Specific local administrative boundary data sets were used to match sub-constituency data for most of the countries,Footnote6 or to create constituency boundary data sets.Footnote7
The resulting breakdown includes a total of 63,417 geographical units in the EU-28, including municipalities or equivalent units in 13 countries, electoral constituencies in 10 countries, and NUTS-3 regions in the remaining five EU member states. Table D1 in Appendix D in the supplemental data online shows the geographical units used, their number and average population by country.
WHAT DRIVES VOTES AGAINST EU INTEGRATION?
Long-term economic decline and the different controls
To assess which of the factors, identified in the literature as potential drivers of anti-system votes, is linked to anti-EU voting, we perform an ordinary least squares (OLS) regression using model (1). The base model considers only the votes for those parties that are strongly opposed or opposed to European integration, thus leaving aside those with a moderate degree of opposition to the European project. Relative economic decline – measured by the rate of change of GDP per capita between 2000 and 2014 – is used as the independent variable of interest. The results of the regressions are presented in .
Table 1. Factors behind votes for parties (strongly) opposed to European integration.
The results confirm the main hypothesis. First, national-specific factors explain the majority of the variation in voting patterns across Europe. When the country fixed effects are included (, regression 2), the adjusted R2 jumps from almost 13 to 61%. This implies that European citizens cast their votes in national elections mostly in response to domestic issues, meaning that identifying ‘European’ causes for the rise of Eurosceptic parties remains difficult. Second, the coefficient of the main variable of interest – the rate of economic change – is, regardless of the controls and of the inclusion or not of country fixed effects, always negative and very strongly significant in all six regressions. Places that have experienced long-term above-average economic growth tend to vote less for parties opposed to European integration than those that have undergone relative economic decline (, regressions 1–3). Third, once the economic trajectory of places is controlled for, population density is also a powerful driver of anti-system voting. Localities and regions with a lower population density are more prone to support anti-European integration parties (regression 3), and while rurality also has the expected sign (regression 4), its effect is trumped by that of density (regression 4). The remaining control variables are introduced in regression 6. The results indicate that votes for parties (strongly) opposed to European integration are associated with the levels of education of the population living in a place, existing levels of employment, regional wealth and distance to the capital. Ageing and net migration provide significant coefficients with the expected signs, but with a significance that is far lower than that associated with economic decline, density, education and wealth (regression 6).
While the majority of the results seem to be in line with expectations based on the literature, there are several important surprises. First, once the economic trajectory of a place is controlled for, it seems that the anti-system vote is not at all linked to where poor people live. Richer places vote more for parties against European integration than poorer ones. The combination of long-term economic decline and wealth explains, for example, voting patterns in the north of Italy, where a still relatively wealthy population that has witnessed better times and experienced long-term relative economic decline supported the Lega in large numbers in the 2018 national election. The fact is that a non-negligible share of the relatively well-off live in places that have been economically declining for quite some time. Second, ageing, which has featured prominently in individual accounts of populism, seems to be a more marginal factor of the anti-establishment vote than most other factors. Finally, regions and cities closer to the capital are marginally more likely to vote for parties opposed to European integration.
The OLS analysis presented in does, however, not say anything about the direction of causality. While long-term economic decline may lead to a swelling of the ranks of those voting for parties opposed to European integration, it may be the case that more votes for anti-system parties could undermine the economic prospects of a place. We do not believe that endogeneity is a serious problem in our case as the ascent of anti-system parties is a recent phenomenon in Europe and, as their brush with power has until recently been very limited, their capacity to affect regional economic performance in the past could be considered as almost negligible. However, and in order to dispel any potential endogeneity risks, we resort to an instrumental variables (IV) analysis. We instrument long-term economic change with fertility rates, as differences in fertility are connected to economic performance (low fertility is associated with lower economic growth), but there are no theoretical arguments that link high or low fertility to specific political options or to a more pro- or anti-European stance. Societies with low levels of fertility are not more or less likely to vote for parties critical of European integration. Econometrically, fertility is a very strong instrument and all tests satisfy the relevance criteria of IV analysis, with an extremely large first-stage F-statistic.
The results of the IV analysis are reported in Appendix G in the supplemental data online. The results presented in stand. If anything, economic decline becomes reinforced as a driver of votes for anti-European parties. The most significant difference with the OLS analysis is that distance to the capital in regression 6 changes sign and becomes positive and significant.
As a further robustness test of the results presented in , the same regression is run including only the share of the votes for parties opposing European integration as the percentage of total number of votes for parties covered by the 2014 and 2017 CHES. This reduces the number of observations by almost 10,000. The results, reported in Appendix H in the supplemental data online, generally hold. The anti-European vote is mainly driven by economic decline, lower population density, employment opportunities, education and regional wealth (richer regions, once other factors are controlled for, remain more anti-European).
Considering parties with different degrees of opposition to European integration
What happens when the share of parties moderately opposed to European integration enters the equation? Parties opposed to European integration vary in their degree of opposition to the EU project. looks at the relationship between the variables included in regression 6 in and the share of the votes for anti-European parties. First, only votes for the parties most strongly opposed to European integration are considered (1). Then, those strongly opposed and opposed (1 and 2) and, finally, all parties that have voiced some opposition – even moderate – to the European project (1–3).
Table 2. Factors behind the vote for parties opposed to European integration, considering different degrees of opposition.
Five factors emerge as the most constant drivers of anti-system voting in Europe. Relative economic decline, lower levels of education and fewer employment opportunities are all connected to stronger anti-European votes – regardless of the level of opposition to European integration. The same applies for GDP per capita, although, once again, the sign of the coefficient is positive and significant, meaning that, once long-term economic decline is controlled for, relatively better-off places in Europe are more likely to vote for parties opposed to European integration than poorer ones (). Distance to the capital displays a negative and significant coefficient in the three regressions: once other factors are considered, areas closer to the capital are more likely to support anti-European integration parties in national elections. However, these results have to be considered in light of the volatility of this coefficient in the IV regression (see Appendix G in the supplemental data online) and the analysis including only parties counted in the CHES (see Appendix H in the supplemental data online).
Other factors that have been considered as drivers of populist vote show a lower degree of consistency. Density only seems a catalyst for the anti-system vote when the votes for parties opposed or strongly opposed to European integration are taken into account. In contrast to the American literature, density (or the urban rural/divide) becomes irrelevant once moderately anti-European votes are included in the analysis (the coefficient turns positive and moderately significant in regression 1–3). European cities can also back moderate anti-European parties. Once this type of parties is included in the analysis, anti-Europeanism ceases to be a rural phenomenon as urban dwellers are marginally, but significantly, more likely to vote for moderate anti-system parties than rural ones ().
The coefficient for areas with a high share of an elderly population is highly volatile. The coefficient is positive and significant in the base regression, but negative and significant both when only the vote for the strongest anti-European parties is taken into account, as well as when the whole spectrum of opposition to European integration is included in the analysis.
Finally, migration also does not seem to be as relevant an issue for the orientation of the vote as has been portrayed by populist parties. Zones with the highest recent inflows of migrants are less likely to vote anti-European. This does not apply to when votes for parties strongly opposed and opposed to European integration (in this case, the coefficient becomes positive and significant) or when the whole spectrum of anti-European parties (insignificant) are considered ().
Different types of economic and demographic change
The final analysis looks at the link between different types of economic and demographic change and the share of the vote for parties opposed and strongly opposed to European integration, our base regression. Four different types of change are analysed: three of an economic nature – change in GDP per capita, industrial employment share and overall employment – alongside demographic changes (). The regressions are run with the same control variables as in (regression 6). The coefficients for the controls are not reported because they are in line with those presented in . The only significant changes concern the regression for demographic change, where ageing regions and those receiving larger shares of migrants become less anti-European.
Table 3. Economic and demographic change and anti-European vote.
The results show that the anti-European vote is only associated with long-term economic and industrial decline. Places that have seen better times, often based on past industrial power, are turning in droves to parties opposed to European integration. Places with population and employment decline are, by contrast, less likely to vote for anti-European parties ().Footnote8
DISCUSSION
The empirical analysis of anti-European integration voting across the EU has confirmed some of the basic beliefs about the drivers of the geography of EU discontent. Education is confirmed as an important factor for support (or lack of it) for European integration. Education has been prominent in past analyses of anti-establishment votes and is deemed to have played a crucial role not only in the Brexit referendum but also in presidential elections in the United States and Austria (Essletzbichler et al., Citation2018).
Lack of employment opportunities also ranks high up on the list of factors behind recent populist votes in Europe. As already noted by Algan et al. (Citation2017), low levels of employment play a major role in the geography of EU discontent. However, and in contrast with Algan et al.’s (Citation2017) emphasis on changes in unemployment, our results point towards low levels of employment as a boost for non-mainstream parties.
However, the similarities with the dominant narrative are as noteworthy as the differences unearthed by the analysis. One of these differences relates to wealth. Most of the past research highlighted how anti-system voters came from poor backgrounds. Yet, while we unveil that local wealth matters, the sign of the analysis does not match the previous results. Once other factors – and especially long-term economic decline – are controlled for, richer places in Europe display a greater opposition to European integration. In other words, regions with a higher GDP per head faced with the same level of economic decline are more like to vote for anti-EU options.
Moreover, the presence of an elderly population – one of the most frequent explanations for the strength of populism – does not result in a greater anti-EU vote. Once the economic trajectory, the levels of education of the population and the wealth of a place are taken into account, areas with a large share of the elderly population vote less for both radical and moderate anti-EU parties. Also, net migration, rather than becoming the almighty reason behind reactions against the system as portrayed by anti-system parties, is only a marginal player (see also Becker et al., Citation2017; Colantone & Stanig, Citation2018). If at all, places with a higher share of migrants vote less for parties strongly opposed to European integration. A greater pressure on public services, such as the health and education systems, does not seem to have resulted in greater support for parties opposed to the EU project. This finding, however, warrants further attention in order to decompose what types of migration and demographic composition, if at all, may influence the anti-European vote to a greater extent.
Purely geographical factors, which have usually attracted less attention, turn out to be robust drivers of anti-European voting. Density and rurality matter for this type of electoral behaviour, but have less of a role than that identified by US political scientists (e.g., Cramer, Citation2016; Rodden, Citation2016). In Europe, once moderate anti-European parties are considered in the analysis, there is a reversal in the role of density and urbanites turn out to be more likely to vote anti-European than people living in less dense suburban and rural places.
Distance to the capital varies according to the method used. If anything, areas further from national capitals tend to vote more for pro-European integration options.
Long-term economic and industrial decline emerge as two of the fundamental drivers of the anti-EU vote. As indicated by Gordon (Citation2018, p. 110), it has been long forecast that persistent territorial inequalities could lead to major political breakdown. However, more than the gap between rich and poor regions, it is the long-term economic and industrial trajectory of places that makes the difference for the anti-system vote. Corroborating the theory of the ‘places that don't matter’, the long-term decline of areas that saw better times, that often had a grander industrial past, together with the economic stagnation of places hitting a middle-income trap, provide fertile breeding grounds for the brewing of anti-system and anti-European integration sentiments. This result vindicates the electoral strategies of many anti-establishment parities that have heavily focused their electoral campaigning on old industrial and economically declining areas (Essletzbichler et al., Citation2018; Goodwin & Heath, Citation2016; Shafique, Citation2016).
Not all types of decline, however, are behind the vote for parties hostile to European integration. Population and employment decline have been shown to play no role in the geography of EU discontent. One potential explanation of this is that, at least in terms of employment change, governments may have already tried to address the sources of long-term economic decline by promoting employment, mainly in the public and non-tradable sectors (Rodríguez-Pose, Citation2018), often contributing to generate sheltered economies with a limited capacity to fend for themselves in a more integrated economic environment (Fratesi & Rodríguez-Pose, Citation2016).
Overall, the results of the analysis mainly fall in line with Becker et al.’s (Citation2017) account of the Brexit vote: a geography of discontent in which immigration and trade play limited roles and which is fuelled primarily by low levels of education, low employment opportunities and a historical dependence on manufacturing. The main, and important, difference with Becker et al. is that once education, employment opportunities and economic and industrial change are controlled for, richer places are more opposed to European integration than poorer ones.
CONCLUSIONS
This research has been the first to shed a light on what drives votes against European integration across electoral districts in the whole of the EU, comparing votes for parties opposed to EU integration in the most recent national legislative election and controlling for different degrees of opposition to the European project.
The results stress that the vote for anti-EU parties is driven by specific combinations of socioeconomic and geographical factors, and that the latter often shape the influence of the former at the ballot box. Hence, once long-term economic and industrial decline are addressed, it becomes difficult to assert that pro-/anti-system divides ‘cut across generational, educational and class lines’ (Goodwin & Heath, Citation2016, p. 331). Of these three cleavages, only the educational divide remains. According to our analysis, the evidence that age and wealth matter for anti-EU voting cannot be sustained. In declining places, the old and the rich are more likely to vote pro-European. Large shares of the elderly and the poor happen to live in economically and industrially declining places, but across the whole of Europe, they are not necessarily more inimical to European integration than the rest of the population.
Hence, anti-EU voting reflects long-term economic trajectories, and once this is controlled for, only education, density and lack of employment go along with expectations.
Anti-EU voting is on the rise. Many governments and mainstream parties seem to be at a loss on how to react to this phenomenon. The research conducted in this paper may offer some initial suggestions about how to address the issue. The results indicate that if Europe is to combat the geography of EU discontent, fixing the so-called places that don't matter is possibly one of the best ways to start. Responding to this emerging geography of EU discontent requires addressing the territorial distress felt by the places that have been left behind and promoting policies that go beyond fundamentally targeting, as has often been the case until now, either the more developed and often dynamic large cities or simply the least developed regions. There is an urgent need to think about viable development intervention to deal with long-term trajectories of low, no or negative growth and to provide solutions to places suffering from industrial decline and brain drain. Moreover, the policies have to go beyond simple compensatory and/or appeasement measures. This would imply tapping into the often overlooked economic potential most of these places have and providing real opportunities to tackle neglect and decline. Place-sensitive policies (Iammarino et al., Citation2019; Rodríguez-Pose & Ketterer, Citation2019) may thus be the best policy option to confront the economic decline, weak human resources and low employment opportunities that are at the base of the geography of EU discontent. They may also represent the best method to stem and revert the rise of anti-establishment voting, which is threatening not only European integration but also the very economic, social and political stability which have overseen the longest period of relative peace and prosperity the Continent has witnessed in its long history.
Supplemental Material
Download PDF (1.1 MB)ACKNOWLEDGEMENTS
The authors are indebted to David Bailey, the editor in charge, and the reviewers for their incisive comments during the refereeing process. Earlier versions of the paper benefited from the feedback received by participants during presentations given in Amsterdam, Ancona, Brussels (16), Florence, Groningen, Iași, Ispra, Jönköping, Luxembourg, London (3), Madrid (3), Paris (3), Milan (2), Melbourne, Santiago, Seville (2), Split, Stockholm (2), Tale, The Hague, Trento, Turin, Vienna and Washington, DC (2).
DISCLOSURE STATEMENT
No potential conflict of interest was reported by the authors. The content of this paper reflects only the views of the authors. The European Commission cannot be held responsible for any use that may be made of the information contained therein.
Notes
1. CHES assesses the orientation of political parties on a variety of issues, ranging from political orientation to position on specific issues. The 1999–2014 trend file and 2107 surveys cover the political parties that received at least 5% of the vote in the election before the assessment. For the 2014 exercise, 337 experts assessed 268 parties in the EU-28. The election years covered per EU member state are listed in Appendix A in the supplemental data online. The 40 most anti-European parties, according to their score, are listed in Appendix B online.
2. These descriptions are based on the CHES assessment made in 2014 or 2017. They may no longer correspond to the current position of these parties.
3. The elections considered in the analysis took place between 2013 and 2018. In this and the following sections, the 2017 UK election was excluded because we wanted to analyse links without the result of the Brexit referendum on UK politics.
4. The introduction of country fixed effects reflects the fact that in national elections European citizens primarily cast their vote based on national and local political issues and not on their perception of the state of European integration. The country fixed effects are thus used to capture nationally specific issues that may sway votes. They are also intended to capture variations in voting patterns reflecting differences in national electoral systems. It is expected that a large share of the variation in voting patterns will be explained by the country fixed effects.
5. GRED = georeferenced electoral districts data sets.
6. EuroGeographics EuroBoundaryMap local administrative units data for Bulgaria, Spain, Croatia, Italy, Portugal, Poland, Finland, Sweden and Slovakia, and aggregated LAU-2 (local administrative unit) data for Belgium. For the Netherlands, France and Austria recent LAU-2 boundaries were retrieved from official national sources, as these boundaries are not yet available as part of the EuroBoundaryMap product.
7. Ireland: electoral division boundaries combined from CSO Ireland, see http://census.cso.ie/censusasp/saps/boundaries/eds_bound.htm combined with http://www.constituency-commission.ie/docs/constituencies_ireland.pdf; Latvia: EuroBoundaryMap combined with data from https://www.cvk.lv/pub/public/30997.html; Estonia, Slovenia, Lithuania and Luxembourg: combinations of NUTS-3 and/or LAU-2 boundaries.
8. The large variation between countries in the size and population of the electoral districts may lead to distortions, as the processes operating at the micro-scale that lead to anti-EU votes differ from one country to another. In order to test whether the results are not fundamentally affected by the variation in size and population of electoral districts, we re-estimate the analysis presented in – reporting all the controls as in – across comparable territorial units: the NUTS-3 regions. The results of this analysis, presented in Appendix I in the supplemental data online, basically reproduce those of the main analysis – the only exceptions being the insignificant coefficients for population change and employment rate. This means that the findings are robust to changes in the territorial units.
Related Research Data
REFERENCES
- Algan, Y., Guriev, S., Papaioannou, E., & Passari, E. (2017). The European trust crisis and the rise of populism. Brookings Papers on Economic Activity, 2017(2), 309–400. doi: https://doi.org/10.1353/eca.2017.0015
- Alternative für Deutschland (AfD). (2016). Manifesto for Germany: The political programme of the alternative for Germany. Retrieved from chrome-extension://oemmndcbldboiebfnladdacbdfmadadm/https://www.afd.de/wp-content/uploads/sites/111/2017/04/2017-04-12_afd-grundsatzprogramm-englisch_web.pdf
- Antonucci, L., Horvath, L., Kutiyski, Y., & Krouwel, A. (2017). The malaise of the squeezed middle: Challenging the narrative of the ‘left behind’ Brexiter. Competition and Change, 21(3), 211–229. doi: https://doi.org/10.1177/1024529417704135
- Becker, S. O., Fetzer, T., & Novy, D. (2017). Who voted for Brexit? A comprehensive district-level analysis. Economic Policy, 32(92), 601–650. doi: https://doi.org/10.1093/epolic/eix012
- Bonikowski, B. (2017). Ethno-nationalist populism and the mobilization of collective resentment. British Journal of Sociology, 68, S181–S213.
- Buti, M., & Pichelmann, K. (2017). European integration and populism: Addressing Dahrendorf’s quandary. LUISS School of European Political Economy Policy Brief, 30, 1–8.
- Colantone, I., & Stanig, P. (2018). Global competition and Brexit. American Political Science Review, 112(2), 201–218. doi: https://doi.org/10.1017/S0003055417000685
- Cramer, K. J. (2016). The politics of resentment: Rural consciousness in Wisconsin and the rise of Scott Walker. Chicago: University of Chicago Press.
- Essletzbichler, J., Disslbacher, F., & Moser, M. (2018). The victims of neoliberal globalisation and the rise of the populist vote: A comparative analysis of three recent electoral decisions. Cambridge Journal of Regions, Economy and Society, 11(1), 73–94. doi: https://doi.org/10.1093/cjres/rsx025
- Ford, R., & Goodwin, M. J. (2014). Revolt on the right: Explaining support for the radical right in Britain. London: Routledge.
- Ford, R., & Goodwin, M. J. (2017). Britain after Brexit: A nation divided. Journal of Democracy, 28(1), 17–30. doi: https://doi.org/10.1353/jod.2017.0002
- Fratesi, U., & Rodríguez-Pose, A. (2016). The crisis and regional employment in Europe: What role for sheltered economies? Cambridge Journal of Regions, Economy and Society, 9(1), 33–57. doi: https://doi.org/10.1093/cjres/rsv032
- Garretsen, H., Stoker, J. I., Soudis, D., Martin, R. L., & Rentfrow, P. J. (2018). Brexit and the relevance of regional personality traits: More psychological openness could have swung the regional vote. Cambridge Journal of Regions, Economy and Society, 11(1), 165–175. doi: https://doi.org/10.1093/cjres/rsx031
- Goodwin, M. J., & Heath, O. (2016). The 2016 referendum, Brexit and the left behind: An aggregate-level analysis of the result. Political Quarterly, 87(3), 323–332. doi: https://doi.org/10.1111/1467-923X.12285
- Goodwin, M., & Milazzo, C. (2017). Taking back control? Investigating the role of immigration in the 2016 vote for Brexit. British Journal of Politics and International Relations, 19(3), 450–464. doi: https://doi.org/10.1177/1369148117710799
- Gordon, I. R. (2018). In what sense left behind by globalisation? Looking for a less reductionist geography of the populist surge in Europe. Cambridge Journal of Regions, Economy and Society, 11(1), 95–113. doi: https://doi.org/10.1093/cjres/rsx028
- Guiso, L., Herrera, H., Morelli, M., & Sonno, T. (2017). Demand and supply of populism (CEPR Discussion Paper No. DP11871). London: Centre for Economic Policy Research (CEPR).
- Hobolt, S. B. (2016). The Brexit vote: A divided nation, a divided continent. Journal of European Public Policy, 23(9), 1259–1277. doi: https://doi.org/10.1080/13501763.2016.1225785
- Iammarino, S., Rodríguez-Pose, A., & Storper, M. (2019). Regional inequality in Europe: Evidence, theory and policy implications. Journal of Economic Geography, 19(2), 273–298. doi: https://doi.org/10.1093/jeg/lby021
- Johnson, P. (2015). Older industrial Britain being left behind. NewStart, March 26 . Retrieved from https://newstartmag.co.uk/articles/older-industrial-britain-being-left-behind-in-economic-upturn/
- Kollman, K., Hicken, A., Caramani, D., Backer, D., & Lublin, D. (2016). Constituency-level elections archive (Data file and codebook). Ann Arbor: Center for Political Studies, University of Michigan.
- Leconte, C. (2015). From pathology to mainstream phenomenon: Reviewing the Euroscepticism debate in research and theory. International Political Science Review, 36(3), 250–263. doi: https://doi.org/10.1177/0192512115576236
- Lee, N., Morris, K., & Kemeny, T. (2018). Immobility and the Brexit vote. Cambridge Journal of Regions, Economy and Society, 11(1), 143–163. doi: https://doi.org/10.1093/cjres/rsx027
- Lega. (2018). Programma di governo. Salvini Premier. Retrieved from https://www.leganord.org/notizie/news-2018/16455-elezioni-2018-programma-di-governo-lega-salvini-premier
- Los, B., McCann, P., Springford, J., & Thissen, M. (2017). The mismatch between local voting and the local economic consequences of Brexit. Regional Studies, 51(5), 786–799. doi: https://doi.org/10.1080/00343404.2017.1287350
- Martin, R., Tyler, P., Storper, M., Evenhuis, E., & Glasmeier, A. (2018). Globalization at a critical conjuncture? Cambridge Journal of Regions, Economy and Society, 11(1), 3–16. doi: https://doi.org/10.1093/cjres/rsy002
- McCann, P. (2018). The trade, geography and regional implications of Brexit. Papers in Regional Science, 97(1), 3–8. doi: https://doi.org/10.1111/pirs.12352
- McCann, P. (2019). Perceptions of regional inequality and the geography of discontent: Insights from the UK. Regional Studies, doi: https://doi.org/10.1080/00343404.2019.1619928
- Moretti, E. (2012). The new geography of jobs. New York: Houghton Mifflin Harcourt.
- Movimento Cinque Stelle. (2018). Il programma per l’Italia scritto dagli Italiani. Unione Europea. Retrieved from https://www.movimento5stelle.it/programma/
- Partij voor der Vrijhiid. (2017). Concept – Verkiezingsprogramma PVV 2017–2021. Nederland weer van ons! Retrieved from https://www.pvv.nl/visie.html
- Polk, J., & Rovny, J. (2017). Anti-elite/establishment rhetoric and party positioning on European Integration. Chinese Political Science Review, 2(3), 356–371. doi: https://doi.org/10.1007/s41111-017-0068-9
- Rassemblement National. (2017). 144 Engagements Présidentiels. Marine 2017. Retrieved from https://www.rassemblementnational.fr/le-projet-de-marine-le-pen/
- Rodden, J. (2016). This map will change how you think about American voters – Especially small-town, heartland white voters. The Washington Post, October 31 . Retrieved from https://www.washingtonpost.com/news/monkey-cage/wp/2016/10/31/this-map-will-change-how-you-think-about-american-voters-especially-small-town-heartland-white-voters/?utm_term=.1e1956fd2d82
- Rodríguez-Pose, A. (2018). The revenge of the places that don’t matter (and what to do about it). Cambridge Journal of Regions, Economy and Society, 11(1), 189–209. doi: https://doi.org/10.1093/cjres/rsx024
- Rodríguez-Pose, A., & Ketterer, T. (2018). Institutional change and the development of lagging regions in Europe. Regional Studies. doi: https://doi.org/10.1080/00343404.2019.1608356
- Rodrik, D. (2018). Populism and the economics of globalization. Journal of International Business Policy, 1(1), 12–33. doi: https://doi.org/10.1057/s42214-018-0001-4
- Shafique, A. (2016). Brexit was driven by places ‘left behind’. The RSA, August 30 . Retrieved from https://www.thersa.org/discover/publications-and-articles/rsa-blogs/2016/08/brexit-was-driven-by-places-left-behind
- Socialist Party (Netherlands) (SP). (2018). Europees beleid. Retrieved November 30, 2018, from https://www.sp.nl/onderwerp/europees-beleid
- Storper, M. (2013). Keys to the city: How economics, institutions, social interaction, and politics shape development. Princeton: Princeton University Press.
- Tyson, A., & Maniam, S. (2016). Behind Trump’s victory: Divisions by race. Gender and Education, November 9 . Retrieved from http://www.pewresearch.org/fact-tank/2016/11/09/behind-trumps-victory-divisions-by-race-gender-education/
- UKIP. (2015). UKIP manifesto 2015. Retrieved from chrome-extension://oemmndcbldboiebfnladdacbdfmadadm/https://d3n8a8pro7vhmx.cloudfront.net/ukipdev/pages/1103/attachments/original/1429295050/UKIPManifesto2015.pdf?1429295050
- Vandermotten, C., Capron, H., Decrolly, M., & Romus, P. (1990). Les régions et l’Europe (Actes du Neuvième Congrès des Economistes Belges de langue française). Namur: CIFoP.