
 ?Mathematical formulae have been encoded as MathML and are displayed in this HTML version using MathJax in order to improve their display. Uncheck the box to turn MathJax off. This feature requires Javascript. Click on a formula to zoom.
ABSTRACT
This study addresses how diversity in the local sector structure is associated with employment development across different municipality types (urban, intermediate and rural). While this relationship has been studied primarily from an urban perspective, increasing economic diversity has gained traction as a policy tool, particularly in rural areas. Given the diverse roles of municipalities in the urban hierarchy, the analysis explicitly identifies the impact of other nearby local economies. It is found that nearby dense and diverse local economies are indeed important for employment growth for all three types of municipality. Diversity in a given municipality has no or even a negative relationship with growth.
INTRODUCTION
Changes in the composition of the economic system are a critical determinant of economic growth (Saviotti & Pyka, Citation2004). An important related question is to what extent regional economic growth can be spurred by sector specialization or diversity. Van Oort (Citation2007) claims that the constitution of the urban system determines economic growth. One of the most prominent debates among regional scientists addresses the potential economic benefits for regions due to sector specialization or diversity (Beaudry & Schiffauerova, Citation2009; De Groot, Poot, & Smit, Citation2016; Glaeser, Kallal, Scheinkman, & Sheifler, Citation1992; Melo, Graham, & Noland, Citation2009; for Dutch examples, see Frenken, Van Oort, & Verburg, Citation2007). Even though many empirical studies have considered distinct regional levels in studying the relationship between sector distribution and economic development (De Groot et al., Citation2016), the argument has been placed primarily within an urban context. This is despite the oft-mentioned problem of rural areas lacking diversity and being dependent on agriculture (Dibden & Cocklin, Citation2009).Footnote1 The input–output relationships, learning effects and labour market effects that are used to explain the expected benefits of a varied and/or specialized sector structure implicitly assume that there is sufficient mass to create such positive externalities (Melo et al., Citation2009). The title of the frequently referenced article ‘Growth in cities’ (Glaeser et al., Citation1992) speaks volumes in this respect. Glaeser et al. (Citation1992) find that employment growth is strengthened by sector diversity. In this study, we consider the question to what extent economic diversity (and specialization) influences employment development in municipalities of various population densities (urban–intermediate–rural) in the Netherlands. In so doing, we address the issue as to whether the relationship between diversity and growth holds when relaxing the implicit assumption of sufficient economic mass. De Groot et al. (Citation2016) suggest that explicitly acknowledging the role of different local contexts is a much-needed way forward in further understanding agglomeration benefits. The issue also has an important societal relevance given the long-standing policy aim of diversifying rural areas. Both at the European Union (EU) level and at the level of individual European countries, a strong emphasis has been placed on increasing the economic diversity of rural areas (Dax, Citation2014).
In order to understand the relationship between sector diversity and economic development in municipalities of various densities, we assess employment development in Dutch municipalities between 1996 and 2012. The Netherlands is a strongly urbanized country with a population density of almost 500 inhabitants/km2 in 2012. The high urbanization level and the small size of the country have implications for the empirical approach, particularly as rural areas have excellent connections to nearby urban centres. With a high density of economic activities and many establishments located close together, the Netherlands is a natural laboratory for testing externalities between locations (Van Oort, Citation2007). To account for this, we carefully correct for the influence of nearby municipalities. As a result, we can assess the distinct influences that cities, rural municipalities and intermediate municipalities may experience from neighbouring municipalities.
The paper is structured as follows. In the next section, we will first discuss how diversity can impact on economic development, while acknowledging the distinct contextual differences within the country. The methods section then explains the general empirical strategy with special attention for the issue of how to account for the influence of relevant neighbouring municipalities. We then present and discuss the results.
THEORETICAL CONSIDERATIONS
Is a diversified economic base conducive to regional economic growth, or is specialization better? This question has underpinned a stream of research in which the impact of Marshall externalities (specialization) on regional growth are compared with the impact of Jacobs externalities (diversity and competition) (Beaudry & Schiffauerova, Citation2009; De Groot et al., Citation2016; Duranton & Puga, Citation2000; Frenken et al., Citation2007; Glaeser, Citation1999; Glaeser et al., Citation1992; Henderson, Citation1997, Citation2003; Van der Panne, Citation2004; Van Oort, Citation2002, Citation2007). Following biology’s notion of diversity – the variation of the different life forms present in an ecosystem – diversity here means that the economy contains different sectors. Similarly, an economy is specialized if one or a few sectors are overrepresented (following Boone, Brouwer, Jacobs, Van Witteloostuijn, & De Zwaan, Citation2012).
The literature presents conflicting evidence on the nature of specialization and diversity of the economy and their effects on economic performance. As an illustration, Glaeser et al. (Citation1992) find evidence for positive effects of sector diversity on economic performance measured in employment growth in the United States. Henderson (Citation1997, Citation2003), in contrast, finds that only specialization effects are relevant for traditional manufacturing and for new high-tech industries in terms of both employment generation and innovation in the United States. In a large meta-analysis, De Groot, Poot, and Smit (Citation2009) also note the contrasting evidence and they document that the share of studies with positive effects of specialization (33%) is matched with a similar share of studies that find positive economic effects of diversification (38%). Three Dutch studies also find somewhat mixed evidence. Boschma and Weterings (Citation2005) find no clear effect of regional sector diversity or specialization on patenting activity at the level of labour market regions (NUTS-3).Footnote2 Van der Panne (Citation2004) measures economic growth also in patents and finds clear positive effects for specialization at very low spatial scales (ZIP codes). Finally, Van Oort and Atzema (Citation2004), using the municipal level (NUTS-4, LAU-2)Footnote3 and new firm formation as a measure of economic development, find positive effects both of sector diversity and of specialization.
Even though often presented as a dichotomy, regional economies may be diverse while at the same time specializing in a small number of industries (Van Oort & Atzema, Citation2004). It has been argued that diversity, when seen as a variety of sectors, as such may not be beneficial. Rather, a concentration of more-or-less related industries provides benefits (Bishop & Gripaios, Citation2009; Frenken et al., Citation2007). In line with the focus of this study on the effects of diversity – given its prominence in discussions about rural development strategies – we limit our discussion to two mechanisms that govern the potential positive effects of diversity: the portfolio effect and spillover effects.
Diversity enhances the resilience of the economy: the ability of the economic system to perform effectively while the situation may alter (Malerba, Citation2006; Pasinetti, Citation1981). This effect is known as the portfolio effect. Dissart (Citation2003) argues that having multiple economic sectors in a given region reduces local employment fluctuations because the regional economy is less susceptible to sector-specific downturns. Pasinetti (Citation1981) also argues for the long-term effect of diversity on the economic system, showing that an economy that does not increase the sector diversity over time will ultimately suffer from structural unemployment and stagnation. A region has to develop new sectors if it is to be able to absorb redundant labour from declining sectors (Malerba, Citation2006; Morkutė, Koster, & Van Dijk, Citation2017).
The discussion on whether diversity or specialization is more beneficial for the economy focuses largely on the second argument: the spillover effects. The effects of specialization operate mainly within a specific sector, whereas the effects of diversity stimulate the creation of new ideas across sectors (Stirling, Citation2007). The effects of diversity or Jacobs externalities are caused by the variety in local activities and the interactions of diverse actors that all participate in the processing of innovative ideas that strengthen the economy and add goods, services and economic activities to an economy (Usai & Paci, Citation2003; Van der Panne, Citation2004).
Diversity in regions of varying density
Although the literature is undecided about the exact nature and effects of specialization and diversity, there is a striking consensus regarding the conceptualization of the spatial units considered (Bishop & Gripaios, Citation2007; Citation2009). Municipalities, urban areas and even nations have been used as units of analysis, but this has hardly had any effect on the conceptual arguments regarding the potential effects of economic diversity and specialization. In effect, the impact of economic structure is assumed to be the same regardless of geography and conceptually the city seems to be the default frame of reference. The choice of urban regions as the geographical frame dates back to the original contributions of Marshall and Jacobs who both studied the economic effects of agglomeration with cities in mind. De Groot et al. (Citation2009) assess the economic effects of diversity in different geographies and they conclude that while the magnitude of the effect differs across regional aggregations, the direction does not. This suggests some consistency in the specialization and diversification effect across geographies. At the same time, in studies on rural innovation and economic growth, it has been suggested that economic development is indeed governed by distinct mechanisms in rural areas as compared with urban areas. Korsgaard, Müller, and Tanvig (Citation2015) suggest that rural development builds on local embeddedness. Rather than the quantity of possible network links (as in urban areas), the quality or strength of links is important for rural growth. Such networks dynamics are not only pivotal in the local rural community but also can be extended to other locations. Müller and Korsgaard (Citation2018) stress that in rural areas local resource endowment and spatial bridging between the local and non-local are mechanisms that shape economic activity based on local economic structure, where local resource endowment is specific for rural areas (see also Dubois, Citation2016). Rural development patterns are then based on specific network formation in combination with links beyond the rural area. For the economic effects of agglomeration, the question is then whether to expect different effects of economic specialization and diversity when the argument is taken outside of the urban context?
An initial difference is that rural regions lack the economies of scale enjoyed in urban regions. It is telling, in this respect, that the pivotal element in many definitions of rural areas – including our own, which we will introduce in the next section – is the size of the population. Given the generally small size, particularly the positive effects associated with learning could diminish. Frenken and Boschma (Citation2007), for example, argue that the number of innovations, defined as new combinations, is non-linearly related to the number of elements in an economy such that the learning potential diminishes rapidly with a reducing economic scale. Further, small networks may also be more prone to lock-in and redundancy in information (Perry, Citation2002). As such, diversity by itself may not be the main issue: it may be more that it is diversity in large numbers that stimulates learning potential. Rural regions may be at a disadvantage in this respect. In contrast, local networks may be tighter in rural regions (Van Leeuwen, Citation2010) and this could enhance information transfer between its actors with the information available in the economic actors present being transferred more readily. There is no reason why the portfolio effect should be less effective in rural regions.
To overcome the disadvantages of scale, the embeddedness of rural regions in the wider economy will be crucial. Arguably, even more so than for cities, the interdependencies within larger spatial scales are at the centre of economic change in rural areas. Here, Kalantaridis (Citation2010, p. 418) suggests that ‘local economic conditions in rural areas are the outcome of processes that are both local and non-local in origin’. Bosworth and Venhorst (Citation2018, p. 1083) add that:
migration and real wage adjustments serve to rebalance any interregional equilibrium and … that residential migration out of congested city region combined with commuting back from the rural region to the urban region can be detrimental to the prospects of the rural region’s economy.
To disentangle the complex and composite effects of access to other places, Bosworth and Venhorst (Citation2018) suggest a useful distinction between production and consumption effects. In this framework, in-commuting levels may represent an area’s increased access to a workforce that should enhance production. In contrast, out-commuting then represents the inflow of income from other places of production and, if spent locally, this increases local consumption. Arguably, the relative location of rural areas is particularly crucial in the Dutch situation because Dutch rural areas are easily accessible (Terluin, Citation2003). As a result, it is relatively easy for economic actors to interact with actors from beyond the local area. In a sense, economies of scale are realized through linkages to other, larger, places outside the municipality. If economies of scale are indeed created outside the local economy, then one would expect local conditions (including specialization and diversification) too have little explanatory power in the Dutch rural context, despite being important in other contexts. Westlund (Citation2018) suggests that it is at this scale that relationships between rural and urban places have changed and become visible. Given the declining importance of local materials (farming) in the rural economy, nearby cities become more important as they act as hubs to the larger (knowledge and service) economy. This would suggest that access to agglomerations in the functional region is particularly important for rural economies and increasingly so. Given its small scale, the Netherlands make an interesting test case for understanding the interrelated roles of the constituent parts of larger functional regions (see also Van Oort, Citation2007). To get at this, it is necessary to conduct the analysis at a spatial scale that is smaller than the functional region. At a small spatial scale, we will then address empirically to what extent economic performance, in terms of employment, can be attributed to the local industrial composition and to what extent local performance is related to influences that are not local in nature. These influences could involve general agglomeration forces, but also those specific to specialization and diversification.
EMPIRICAL APPROACH
This study focuses on the relationship between sector diversity and employment in municipalities (NUTS-4, LAU-2) with different population densities in the Netherlands. Given this focus, there are two main challenges in the empirical strategy. First, a conceptualization of municipalities of varying density (urban, intermediate and rural) is needed. Second, as stressed in the previous section, the recursive linkages between municipalities, rural and urban, and their surroundings may be important. As such, in our empirical strategy, we need to address the issue of spatial dependence. We do this by including spatially lagged variables in the analyses. Below, we first discuss these issues before presenting the data used and the estimation approach adopted.
Spatial scale
The Netherlands is a densely populated country. When applying the Eurostat typology of urban and rural regions, none of the 12 Dutch NUTS-2 regions classifies as rural. At the NUTS-3 level (40 regions), which roughly coincides with the labour market regions in the Netherlands, only one region (Zeeuws-Vlaanderen, 0.6% of the population) is classified as predominantly rural (European Union, Citation2010). Thus, although labour market areas (NUTS-3) are often the preferred spatial units for assessing regional employment dynamics, they are too broad for our purpose. The labour market areas all consist of one or more urban centres plus their hinterlands. Measuring rurality at this level would provide only an average indication of rurality. Therefore, we take the level of the municipalities. Dutch municipalities are small with an average area of 101.8 km2 (ranging from 6.92 to 813.1 km2). The average number of inhabitants is 4126 (960–7,99,278), and the average address density is 1006 addresses/km2 (123–6056 addresses/km2) in 2013 (Statistics Netherlands, Citation2013). Given the small sizes of the municipalities, many people work outside of their place of residence. In fact, 56% of the people have a main job outside of their municipality of residence (ranging from 89% to 0% for several island municipalities; data from Statistics NetherlandsFootnote4). Thus, when we take the level of the municipality, we need to correct for the interactions with relevant other municipalities to incorporate higher level dynamics (Goffette-Nagot & Schmitt, Citation1999) (see the next section).
In addition to the methodological considerations, one can also argue for using municipalities as the units of analysis because of their administrative relevance. Municipal governments have considerable leeway in formulating economic policies, also regarding diversification issues. In fact, the Dutch rural development plan emphasizes the need for a diverse rural economy at the municipality level (Van Leeuwen, Citation2010). Therefore, to address rurality in the Dutch context, the analysis needs to be performed at a low level of spatial aggregation. In this study, the analysis is done at the municipal level (NUTS-4, LAU-2).
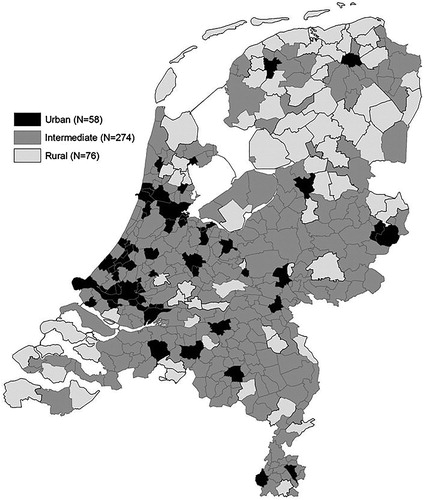
We distinguish between rural and non-rural municipalities based on average population density, and the share of people living in low- or high-density neighbourhoods. First, in order to be defined as rural, municipalities cannot have an average population density of over 150 inhabitants/km2. This is in line with classifications by the European Union (Citation2010) and Terluin (Citation2001). Second, in these municipalities, at least half of the population should live in neighbourhoods with fewer than 500 addresses/km2 (the lowest urbanization level as defined by Statistics Netherlands). In this way, we take into account the geographical size of the municipalities: municipalities with a low average population density but with a relatively large urban centre are excluded from the group of rural municipalities. On the basis of this classification and accounting for missing values, we identify 76 rural municipalities (N total = 408). Furthermore, we define 58 urban municipalities, defined on the basis of a population density of more than 1000 inhabitants/km2 and with more than half of the population living in areas with over 1500 addresses/km2 (the two highest urbanization levels of the five defined by Statistics Netherlands). The remaining 274 municipalities are classified as intermediate. shows the spatial distribution of the three types of municipality. We stress that with these definitions we aim to reflect the Dutch situation and interpretation of rurality.
Figure 1. Municipalities (N = 408, situation in 2013) in the Netherlands by degree of urbanization.
Spatial interaction based on commuting flows
As explained above, because of the small scale of Dutch municipalities, we expect that employment development will be influenced by characteristics of nearby municipalities. We address this issue by including spatially lagged independent variables in the regression analyses. In effect, such spatially lagged variables contain information on nearby municipalities that can also account for employment dynamics in the focus municipality. In this way, drawbacks of doing the analysis on a spatial level lower than the labour market area are mitigated: Information on the wider labour market area is included in the spatially lagged variables (see also LeSage & Pace, Citation2009).
A crucial issue in constructing spatially lagged variables is defining a proper weight matrix (W). The matrix indicates which surrounding municipalities are included in the calculation of the spatially lagged variables; in other words, which municipalities are likely to influence employment levels in the focus municipality. Most studies rely on weight matrices based on insights from gravity models. Near municipalities have a larger influence on the focus municipality than municipalities further away. Based on this stylized fact, studies usually apply weight matrices based on contiguity (areas sharing a border) or distance (Anselin, Citation1988). However, in these approaches, the interactions between spatial units is assumed rather than measured directly. Large cities, for example, are assumed to have the same impact as a small village if they both border the focus municipality. Also, all municipalities beyond a certain cut-off distance are ignored, while some may actually be very important.
In order to overcome the drawbacks of contiguity or distance-based weight matrices, this study uses a substantive weight matrix based on the job locations and residential locations of people. Having distinct municipalities of work and residence translates to commuting between two places. We then interpret the level of commute between two municipalities as economic dependence. The economic dependence between two places may run through production or consumption (Bosworth & Venhorst, Citation2018). Commuting into a municipality effectively indicates an increased local labour market, which may support scale advantages in local production. To account for this type of dependence, the models include weight matrix WI (weights in) which adopt information on in-commuting patterns in Dutch municipalities. In contrast, out-commuting (measured as the job location of people residing in a certain municipality) may convey consumption-side information in that workers bringing home an income earned elsewhere could stimulate employment generation in the core municipality. The matrix reflecting this aspect is labelled WO (weights out). Appendix A in the supplemental data online presents further information on the calculation of the weight matrices.
We assume that larger places, with many people working and living ‘domestically’, are less influenced by other municipalities than a small village with relatively large flows to (or from) nearby urban centres. In constructing the WO and WI matrices, we therefore correct for the relative size of the flows of workers to and from the municipalities (see also Appendix A in the supplemental data online). Some island municipalities have negligible commuter flows in and out of the municipality. This leaves them unconnected to other municipalities in the matrix and the spatially lagged variables for these municipalities are set to zero. presents summary statistics of the variables.
Table 1. Summary statistics of the variables used.
It can be argued that worker flows between municipalities will be influenced by employment developments and that our weight matrices are prone to endogeneity issues. However, the WO and WI matrices were constructed only for the year 2005. As such, they are not affected by changes in employment opportunities in the study period. In addition, we include a model version that includes conventional spatially lagged variables based on a queen contiguity assumption.Footnote5 This matrix is labelled WQ.
Data, model and main variables
The aim of the empirical analysis is to understand the relationship between local employment levels and the diversity of the economy and how this is different for urban, rural and intermediate municipalities. Separate models are estimated for each of the three groups of municipalities. The models focus on the relationship between employment dynamics and sector diversity, while controlling for confounding factors, which include links to surrounding other municipalities. Fixed-effect panel models are estimated in order to capture the time-varying development of employment in the municipalities. Establishment and employment data are derived from the LISA (National Register Work Places) establishment data set, which includes information on all establishments in the Netherlands. All other data are available through Statistics Netherlands. The analysis covers the period 1996–2012.
The dependent variable in the analyses is the log of the municipal employment level. Given the fixed-effect model approach, outcomes can be interpreted as the changes in employment over time. By using employment as the dependent variable, we focus our analysis on one specific aspect of economic development. Other variables, including productivity and innovation indicators, have also been considered in other studies. We are limited by our data, which only includes employment levels. Still, employment is an important and policy-relevant variable. In addition, changes in employment levels, particularly in the long run, can be argued also to reflect regional differences in productivity or innovation (Fritsch, Citation2012). De Groot et al. (Citation2009) show that using employment as the dependent variable – rather than another indicator of economic growth – increases the probability of finding a positive effect of sector diversification on growth.
The main independent variable is the diversity of the local economy. To measure sector diversity, we use Frenken’s (Citation1999, Citation2004) version of the Shannon entropy measure (Sh, equation 1). Sh ranges from zero to infinity, and higher values indicate greater diversification. Pi is the proportion of jobs in a specific sector. Diversity is measured on the basis of NACE-2 two-digit sector classification developed by Eurostat:(1)
(1) In addition to the Shannon index of diversity, we include a measure of specialization (Cr, equation 2) as developed by Crowley (Citation1973). The measure sums the squared location quotients (q) that are > 2 (δ = 1 if q > 2), that is, that indicate a regional specialization for the sector under consideration. The measure thus conveys information both on the number and strength of local specializations:
(2)
(2)
Spatially lagged versions of the specialization and diversity measures (WI_cr, WO_cr, WI_sh, WO_sh) enable one to assess spillover effects associated with specialization and diversity.
Control variables
In addition to the main variables of interest, several control variables have been included that are expected to further explain employment levels. First, we control for urbanization economies by including the population density. This controls for local differences in the labour market and in consumption. In addition, the models include the share of population of 25–45 years of age. This is a corrector for the demographic composition in a municipality. In order to control for any potential agglomeration benefits derived from nearby municipalities, the address density has also been spatially lagged. The spatially lagged population density positions the municipality in relation to its neighbours and can be taken as an indication for the position of the municipality in the spatial hierarchy. A correction for the sector mix has been included as the share of manufacturing jobs (NACE code C) and the share of agricultural jobs (NACE code A). summarizes the variables used.
DIVERSITY AND EMPLOYMENT IN RURAL AND URBAN MUNICIPALITIES
Before turning to the multivariate analysis, we briefly discuss the level and development of employment and the range of industrial economic activities in the three types of Dutch municipalities. The 16-year period covered (1996–2012) provides insights into the medium-term developments in economic diversification and employment.
In terms of employment, we see an on average 3% increase between 1996 and 2012 (). The largest relative increase took place in the rural municipalities (3.8%), with employment growth in intermediate and urban areas somewhat lower (3.1% and 2.4%). This finding is in line with results that indicate that rural and intermediate municipalities just outside an urban core are catching up to urban cores (Broersma & Van Dijk, Citation2002; Organisation for Economic Co-operation and Development (OECD), Citation2012). A similar pattern is found in the number of establishments where the growth is again most pronounced in rural and intermediate municipalities although the difference with urban municipalities is small.
Figure 2. Average and bandwidth of growth in the number of establishments and jobs in the three types of municipality between 1996 and 2012 (1996 = 1).
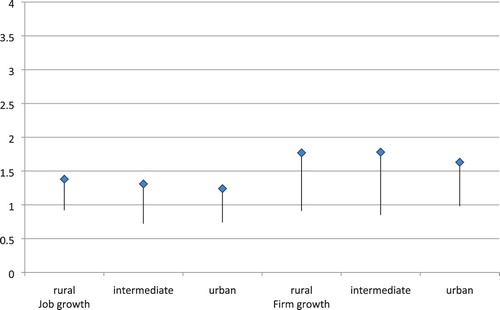
also shows that the development of employment is particularly prone to shocks. The establishment or closure of one large firm or sector can have a sizeable impact on local economies. Both the upper and lower extremes reflect job gains and losses that are specific to one sector or a few establishments.
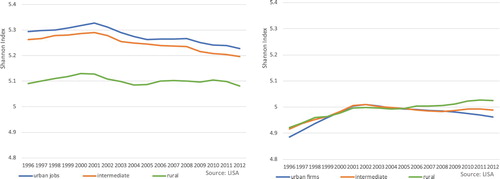
Given its path-dependent nature, the sector mix in municipalities is expected to change only gradually over time. , showing the mean Shannon entropy measures for the three municipality types, confirms this for both the diversity in the number of establishments and of jobs. Even in the 16-year study period, changes in the sector mix are relatively small. The left panel shows sector diversity, measured in jobs. Rural municipalities are the least diverse, but the level is relatively stable. Again, the pattern is one of slow convergence evidencing some catching up by rural municipalities in terms of economic diversity. Overall, suggests a small but consistent overall trend of specialization in the Netherlands. The right panel shows diversity in terms of establishments, and it shows that differences between municipality types, while small, are slightly increasing. Rural municipalities are more diverse than intermediate or urban ones and increasingly so. The distinct patterns for jobs and establishments suggest that even though many sectors are represented in rural municipalities, a relatively large proportion of the employment is still concentrated in a small number of sectors or even individual firms.
Figure 3. Average sector diversity in terms of jobs (left) and establishments (right) by municipality type.
MULTIVARIABLE ANALYSIS
In the descriptive analysis of the data we see a stagnation or slight decrease in the overall diversity of the Dutch economy as well as an increase in employment. We now turn to the question as to what extent these two events are associated and whether there are any differences in the relationship related to geographic context. The results are presented in two steps. First, a model is presented that considers all municipalities simultaneously (). This model has been estimated in four versions: one without spatially lagged variables and three with the different types of weight matrices introduced earlier (WO, WI and WQ). The sample is then split, and the same model is then applied separately for urban, intermediate and rural municipalities (). In this second step, only the version of the model that uses the weight matrix based on the inflow of workers (WI) is presented. Given the fixed-effect nature of the models, the models explain changes in employment levels (and not the regional differences in employment level as such) in terms of changes in the independent variables.
Table 2. Panel regressions explaining the logged employment.
Table 3. Panel regressions explaining the logged level of employment by municipality type.
All municipalities
shows the results for the models that consider the full set of Dutch municipalities. Starting with the control variables, we see that population density is positively associated with changes in employment. A causal link cannot be established in our research as the measures are recorded simultaneously. In this respect, there is still an active debate as to whether employment development is a result of changes in population density or vice versa. Importantly, also the spatially lagged variables for density are positive and significant in models 2–4. This indicates the importance of access to agglomerated areas to sustain employment growth. The specification of the weight matrix that stresses in-commuting (WI) yields higher coefficient sizes, which tentatively suggests that access to additional resources for production, a larger labour market, is more important than consumption effects (WO) in explaining the potential benefits of borrowed size. The share of the population between 25 and 45 years of age has a negative association with employment development, which could reflect the possibility that this variable picks up the residential function of certain municipalities. Indeed, as mentioned above, over 50% of the people live and work in different municipalities, making sleeper towns a prominent phenomenon. The share of manufacturing in the local economy has no significant effect, but the share of agriculture is negatively associated with employment growth. It is difficult to establish causality and the result is consistent with the trend that employees in the agricultural sector (farmers) shift to other sectors and that freed resources are reallocated elsewhere. Similarly, it aligns with the idea that an improved and more competitive economy does not translate into agricultural jobs as much of the growth in this sector is in the mechanization and automatization of production, not in employment (Bryden & Bollman, Citation2000).
The models show consistent results for the diversity and specialization measures. Overall, diversity has a weak negative association with employment development, while specialization appears to have no significant effect. In addition, none of the lagged specialization measures has a positive association with employment. One explanation for the negative effect of diversity is put forward in De Groot et al. (Citation2009) when they propose that a certain measure of market power is necessary to capture and internalize possible productivity effects of spillovers generated as a result of diversity. The diversity measure then captures the combined positive effect of increased knowledge spillover following a more diverse set of possible resources combinations and a lack of market power and absorptive capacity to convert the ideas into innovations, increased productivity and ultimately employment. This interpretation is consistent with the positive effect of the spatially lagged variable on diversity. A lack of local capacity to capitalize on new combinations will have a local effect, while the positives of knowledge spillovers are transferable across space. A more prosaic argument is the overrepresentation of manufacturing in the sector classification (Frenken et al., Citation2007). High levels of sector diversity may reflect a substantial presence of declining manufacturing sectors even though this should, at least partially, be accounted for by the variable share of manufacturing.
The final result here concerns the three specifications of the weight matrix. Each of them gives a different representation of the functional region. This is reflected in the coefficient sizes, which indeed differ across the models. However, the general patterns are very similar. Changing the specification of the weight matrix does not alter the results regarding the main variables.
Rural, intermediate and urban municipalities
Do the above results hold for each of the different geographical contexts? presents the results for urban, intermediate and rural municipalities separately. By splitting the municipalities into the three categories, we find pronounced differences in the results.
The effects of density differ among the categories. General agglomeration effects in terms of population density of the surrounding municipalities(s) seem to play a role for all three types of municipality. The largest effects are found for the rural municipalities. For these municipalities, also the own population density has a relatively large positive impact on employment growth compared with intermediate and urban municipalities. This may indicate a slow outward shift of agglomerated area and indeed a symbiotic relationship between rural and urban places as suggested by Westlund (Citation2018). Rural areas closest to cities may offer firms attractive, cheap alternatives to locations in the cities. At the same time, access to the city may also provide access to the wider economy and additional resources for growth. It is noteworthy though that similar arguments, although less pronounced, appear important at the urban level as well. The share of population in the working age is negatively associated with employment growth in rural and intermediate municipalities. This may reflect the relatively strong residential function of those kind of municipalities which people in the working age find an attractive place to live while keeping their job in the cities (Bosworth & Venhorst, Citation2018).
The results for specialization and diversification also vary across the urban hierarchy. The effect of diversification is only significant, and negative, in intermediate municipalities. Again, the interpretation of the negative effect is not obvious. It may signify that such municipalities have a diverse economy because of an overrepresentation (compared with other municipalities) of declining sectors. This could be an explanation for a short-term change but, in the longer run, the portfolio effect should make municipalities more resilient to sector-specific changes. Also, it could pick up the lack of market power as explained earlier. The lagged diversity variableFootnote6 shows that all municipalities benefit from having economically diverse neighbours. Spillover effects of diversity, possibly including increased consumption and access to a larger market, lead to positive employment effects. This comes to show that the relative location of municipalities, regardless their level of urbanity is indeed crucially important in terms of access to resources for employment growth.
The conclusions regarding specialization are different. Again, there appears no significant effect on employment in the own municipality. In addition, having specialized neighbouring municipalities only results in negative employment spillovers for rural municipalities. In intermediate and urban municipalities this effect is not encountered.
Overall, the results suggest that access to larger centres is an important explanatory variable of employment development in rural municipalities. This corroborates earlier findings by Curry and Webber (Citation2012) and by Agarwal et al. (Citation2009). It shows that even in small and well-connected countries such as the Netherlands, relative geography, and the associated accessibility, is a crucially important determinant of economic differences between rural municipalities.
CONCLUSIONS
This study has assessed the extent to which the sector structure is associated with employment development. More specifically, it contributes to existing debates by addressing the issue as to whether this association is homogenous across different municipality types (urban, intermediate and rural). Further, the analysis explicitly incorporates the recursive economic relationships between municipalities. As such, we have been able to identify, for each type of municipality, the effect of surrounding municipalities. Given the focus on regions of varying density and the government’s policy aim of diversifying economies in regions of low population density, the argument is built around the effects of having a diverse sector structure. Nevertheless, the relationship between specialization and employment generation has been also assessed. A few major conclusions stand out.
Overall, the results show a positive effect of economic diversity in the wider region on employment growth. However, we find a negative effect of diversity within any given municipality. This effect is driven by intermediate municipalities in the Netherlands. The negative within-municipality effect is counterintuitive although this has also been found in other studies. It may be indicative of a lack of market power or absorptive capacity by a few larger firms that can capitalize on the knowledge spillovers emanating from the diverse set of resources available. The benefits of a diverse economy, learning and portfolio effects, do appear at the scale of the labour market region. Furthermore, no local effect of specialization could be found. Only on a higher scale, we find a negative effect of surrounding specialized municipalities for rural areas. This may indicate a dearth of growth opportunities in the wider region. It is also consistent with the idea that rural areas are outcompeted by denser, specialized regions in finding specific resources.
The analysis clearly shows that there are significant relationships between municipalities and their surrounding areas. All municipalities profit from economically diverse neighbours with cities most strongly benefitting from diversified inputs from nearby municipalities. Especially rural and intermediate municipalities encounter negative competition effects of nearby specialized municipalities. This suggests that strongly developed specialized clusters of activity act as a magnet for economic resources putting the brake on employment development in non-urban areas. This is then countered by a more generic positive effect of access to urbanized areas, which may run through non-rival resources for production as well as consumption effects. Access to urbanized places is important across the urban hierarchy, while it is particularly salient for rural municipalities. The results thus identify a patchwork of complementary and competitive relationships between municipalities that may, taken together, play out differently for specific municipalities depending on their relative geography and position in the urban hierarchy.
Implications
Despite the specific geographical context of the Netherlands, the study has several implications for the development of rural municipalities, particularly in the light of the diversification policy strategies that have been adopted.
A diversification strategy seems only to be fruitful if it is implemented on the scale of a functional region. That is, across combinations of rural municipalities in conjunction with an urban centre. The positive effects of diversity are only recorded at higher spatial levels. The employment situation in rural municipalities is particularly influenced by the characteristics and dynamics of the surrounding region. This has two implications. First, it can be argued that the municipal level is too small when trying to steer economic development in rural areas and, indeed, functional regions seem more relevant. Municipalities, however, are still largely in charge of their own economic development strategies. Cooperation between groups of municipalities seems to be indispensable to successfully coordinate economic development policies. Second, the impact of surrounding municipalities suggests that establishing good links to other centres, possibly including public transport, road connections and broadband provision, is a critical element in any viable rural development strategy.
Supplemental Material
Download PDF (90 KB)DISCLOSURE STATEMENT
No potential conflict of interest was reported by the authors.
Notes
1. In the period 2007–13, the European Rural Development Policy (ERDP) focused on three main themes, of which the third focused on improving the quality of life and the diversification of the rural economy. This included measures such as diversification into non-agricultural activities, support for business creation and development, encouragement for tourism activities, and providing basic services for the economy and the rural population (Uthes et al., Citation2011). In total, €27 billion has been spent between 2007 and 2013 on this third theme within the EU-27, of which more than half was directed towards diversification (Dax, Citation2014). Although, environmental quality has become increasingly important at both the EU and the national levels, also in the current period 2014–20, the ERDP puts an emphasis on job growth in rural regions (European Union, Citation2015).
2. NUTS = Nomenclature of Territorial Units for Statistics.
3. LAU = local administrative unit.
4. The commuting data refer to 2005, the year used in the empirical analysis to account for spatial relationships between municipalities
5. We also tested versions of the WO and WI matrices that did not use the actual size of the flows. Using different threshold values, we determined whether or not there was a flow between municipalities resulting in binary weight matrices much like the matrices based on contiguity. This approach did not change the results and these are therefore not reported.
6. Here we only show the models with the WI matrix as this most directly relates to access to the labour market, which is an important element of employment growth. The results were similar when using the other weight matrices.
REFERENCES
- Agarwal, S., Rahman, S., & Errington, A. (2009). Measuring the determinants of relative economic performance of rural areas. Journal of Rural Studies, 25, 309–321. doi: 10.1016/j.jrurstud.2009.02.003
- Anselin, L. (1988). Spatial econometrics: Methods and models. Dordrecht: Kluwer.
- Beaudry, C., & Schiffauerova, A. (2009). Who’s rights, Marshall or Jacobs? The localization versus urbanization debate. Research Policy, 38, 318–337. doi: 10.1016/j.respol.2008.11.010
- Bishop, P., & Gripaios, P. (2007). Explaining spatial patterns of industrial diversity: An analysis of sub-regions in Great Britain. Urban Studies, 44, 1739–1757. doi: 10.1080/00420980701426632
- Bishop, P., & Gripaios, P. (2009). Spatial externalities, relatedness and sector employment growth in Great Britain. Regional Studies, 43, 1–12. doi: 10.1080/00343400802699981
- Boone, C., Brouwer, A. E., Jacobs, J., Van Witteloostuijn, A., & De Zwaan, M. (2012). Religious pluralism and organizational diversity: An empirical test in the city of Zwolle, the Netherlands, 1851–1914. Sociology of Religion: A Quarterly Review, 73, 150–173. doi: 10.1093/socrel/srr034
- Boschma, R. A., & Weterings, A. B. R. (2005). The effect of regional differences on the performance of software firms in the Netherlands. Journal of Economic Geography, 5, 567–588. doi: 10.1093/jeg/lbh074
- Bosworth, G., & Venhorst, V. A. (2018). Economic linkages between urban and rural regions – What’s in it for the rural? Regional Studies, 52(8), 1075–1085. doi: 10.1080/00343404.2017.1339868
- Broersma, L., & Van Dijk, J. (2002). Regional labour market dynamics in the Netherlands. Papers in Regional Science, 81, 343–364. doi: 10.1007/s101100200126
- Bryden, J., & Bollman, R. (2000). Rural employment in industrialised countries. Agricultural Economics, 22(2), 185–197. doi: 10.1111/j.1574-0862.2000.tb00017.x
- Crowley, R. W. (1973). Reflections and further evidence on population size and industrial diversification. Urban Studies, 10(1), 91–94. doi: 10.1080/00420987320080071
- Curry, N., & Webber, D. J. (2012). Economic performance in rural England. Regional Studies, 46, 279–291. doi: 10.1080/00343404.2010.505914
- Dax, T. (2014). Shaping rural development research in Europe: Acknowledging the interrelationships between agriculture, regional and ecological development. Studies in Agricultural Economics, 116, 59–66. doi: 10.7896/j.1408
- De Groot, H. L., Poot, J., & Smit, M. J. (2009). Agglomeration externalities, innovation and regional growth: theoretical perspectives and meta-analysis (Handbook of Regional Growth and Development Theories No. 256) (pp. 256–281). Cheltenham: Edward Elgar.
- De Groot, H. L., Poot, J., & Smit, M. J. (2016). Which agglomeration externalities matter most and why? Journal of Economic Surveys, 30(4), 756–782. doi: 10.1111/joes.12112
- Dibden, J., & Cocklin, C. (2009). Multifunctionality: Trade protectionism or a new way forward. Environment and Planning A, 41, 163–182. doi: 10.1068/a40127
- Dissart, J. C. (2003). Regional economic diversity and regional economic stability: Research results and agenda. International Regional Science Review, 26, 423–446. doi: 10.1177/0160017603259083
- Dubois, A. (2016). Transnationalising entrepreneurship in a peripheral region – The translocal embeddedness paradigm. Journal of Rural Studies, 46, 1–11. doi: 10.1016/j.jrurstud.2016.05.003
- Duranton, G., & Puga, D. (2000). Diversity and specialisation in cities: Why, where and when does it matter? Urban Studies, 37, 533–555. doi: 10.1080/0042098002104
- European Union. (2010). Eurostat regional yearbook 2010. Belgium: Eurostat Statistical Books.
- European Union. (2015). EU agriculture spending: focused on results. Retrieved from https://ec.europa.eu/agriculture/sites/agriculture/files/cap-funding/pdf/cap-spending-09-2015_en.pdf
- Frenken, K. (1999). Entropy statistics as a methodology to analyse the evolution of complex technological systems. Application to aircraft, helicopters and motorcycles. Paper prepared for the European meeting on Applied Evolutionary Economics, Grenoble, France, June 1999.
- Frenken, K. (2004). Entropy and information theory. In H. Horst, & A. Pyke (Eds.), The Elgar companion to Neo-Schumpeterian economics (pp. 544–555). Cheltenham: Edward Elgar.
- Frenken, K., & Boschma, R. A. (2007). A theoretical framework for evolutionary economic geography: Industrial dynamics and urban growth as a branching process. Journal of Economic Geography, 7, 635–649. doi: 10.1093/jeg/lbm018
- Frenken, K., Van Oort, F., & Verburg, T. (2007). Related variety, unrelated variety and regional economic growth. Regional Studies, 41, 685–698. doi: 10.1080/00343400601120296
- Fritsch, M. (2012). The effect of new business formation on regional development: Empirical evidence, interpretation, and avenues for further research. In M. Fritsch (Ed.), Handbook of research on entrepreneurship and regional development. National and regional perspectives (pp. 58–106). Cheltenham: Edward Elgar.
- Glaeser, E. L. (1999). Learning in cities. Journal of Urban Economics, 46, 254–277. doi: 10.1006/juec.1998.2121
- Glaeser, E. L., Kallal, H., Scheinkman, J., & Sheifler, A. (1992). Growth in cities. Journal of Political Economy, 100, 1126–1152. doi: 10.1086/261856
- Goffette-Nagot, F., & Schmitt, B. (1999). Agglomeration economies and spatial configuration in rural areas. Environment and Planning, 31, 1239–1257. doi: 10.1068/a311239
- Hans, L., & Koster, S. (2018). Urbanization and start-up rates in different geographies: Belgium, the Netherlands, and Sweden. Small Business Economics, 51(4), 1033–1054. doi: 10.1007/s11187-017-9967-2
- Henderson, J. V. (1997). Externalities and industrial development. Journal of Urban Economics, 42, 449–470. doi: 10.1006/juec.1997.2036
- Henderson, J. V. (2003). Marshall’s scale economies. Journal of Urban Economics, 53, 1–28. doi: 10.1016/S0094-1190(02)00505-3
- Kalantaridis, C. (2010). In-migration, entrepreneurship and rural–urban interdependencies: The case of East Cleveland, North East England. Journal of Rural Studies, 26, 418–427. doi: 10.1016/j.jrurstud.2010.03.001
- Klaesson, J., Larsson, J. P., & Norman, T. (2015). Market potential and accessibility analysis. In C. Karlsson, M. Andersson, & T. Norman (Eds.), Handbook of research methods and applications in economic geography (pp. 412–435). Cheltenham: Edward Elgar.
- Korsgaard, S., Müller, S., & Tanvig, H. (2015). Rural entrepreneurship or entrepreneurship in the rural – Between place and space. International Journal of Entrepreneurial Behavior and Research, 21(1), 5–26. doi: 10.1108/IJEBR-11-2013-0205
- LeSage, J., & Pace, R. K. (2009). Introduction to spatial econometrics. Boca Raton: Chapman & Hall/CRC.
- Malerba, F. (2006). Innovation and the evolution of industries. Journal of Evolutionary Economics, 16(1), 3–24. doi: 10.1007/s00191-005-0005-1
- Markantoni, M., & Van Hoven, B. (2012). Bringing ‘invisible’ side activities to light. A case study of rural female entrepreneurs in the Veenkoloniën, the Netherlands. Journal of Rural Studies, 34(3), 241–259.
- Melo, P. C., Graham, D. J., & Noland, R. B. (2009). A meta-analysis of estimates of urban agglomeration economies. Regional Studies and Urban Economics, 39(3), 332–342. doi: 10.1016/j.regsciurbeco.2008.12.002
- Morkutė, G., Koster, S., & Van Dijk, J. (2017). Employment growth and inter-industry job reallocation: Spatial patterns and relatedness. Regional Studies, 51(6), 958–971. doi: 10.1080/00343404.2016.1153800
- Müller, S., & Korsgaard, S. (2018). Resources and bridging: The role of spatial context in rural entrepreneurship. Entrepreneurship and Regional Development, 30(1–2), 224–255. doi: 10.1080/08985626.2017.1402092
- Organisation for Economic Co-operation and Development (OECD). (2012). Promoting growth in all regions. Paris: OECD.
- Pasinetti, L. L. (1981). Structural change and economic growth. Cambridge: Cambridge University Press.
- Perry, M. (2002). Small firms and network economies (2nd Ed.). New York: Routledge.
- Saviotti, P. P., & Pyka, A. (2004). Economic development by the creation of new sectors. Journal of Evolutionary Economics, 14, 1–35. doi: 10.1007/s00191-003-0179-3
- Statistics Netherlands. (2013). Demografische kerncijfers Gemeenten 2013. The Hague: Statistics Netherlands.
- Stirling, A. (2007). A general framework for analysing diversity in science, technology and society. Interface. Journal of the Royal Society, 4(15), 707–719.
- Terluin, I. J. (2001). Rural regions in the EU: Exploring differences in economic development (Dutch Geographic Studies No. 289). Utrecht: University of Groningen.
- Terluin, I. J. (2003). Difference in economic development in rural regions of advanced countries: An overview and critical analysis of theories. Journal of Rural Studies, 19, 327–344. doi: 10.1016/S0743-0167(02)00071-2
- Usai, S., & Paci, R. (2003). Externalities and local economic growth in manufacturing industries. In B. Fingleton (Ed.), European regional growth (pp. 293–321). Berlin: Springer.
- Uthes, S., Piorra, A., Zandera, P., Biesskowskic, J., Ungarod, F., … et al. (2011). Regional impacts of abolishing direct payments: An integrated analysis in four European regions. Agricultural Systems, 104(2), 110–121. doi: 10.1016/j.agsy.2010.07.003
- Van der Panne, G. (2004). Agglomeration externalities: Marshall versus Jacobs. Journal of Evolutionary Economics, 14, 593–604. doi: 10.1007/s00191-004-0232-x
- Van Leeuwen, E. S. (2010). Urban–rural interactions: Towns as focus points of rural development. Heidelberg: Springer.
- Van Oort, F. G. (2002). Innovation and agglomeration economies in the Netherlands. Tijdschrift voor Economische en Sociale Geografie, 93(3), 344–360. doi: 10.1111/1467-9663.00207
- Van Oort, F. G. (2007). Spatial and sectoral composition effects of agglomeration economies in the Netherlands. Papers in Regional Science, 86(1), 5–30. doi: 10.1111/j.1435-5957.2006.00088.x
- Van Oort, F. G., & Atzema, O. A. L. C. (2004). On the conceptualization of agglomeration economies: The case of new firm formation in the Dutch ICT sector. Annals of Regional Science, 38, 263–290. doi: 10.1007/s00168-004-0195-8
- Westlund, H. (2018). Urban–rural relations in the post-urban world. In T. Haas, & Westlund (Eds.), The post-urban world (pp. 70–81). New York: Routledge.